Project Funding
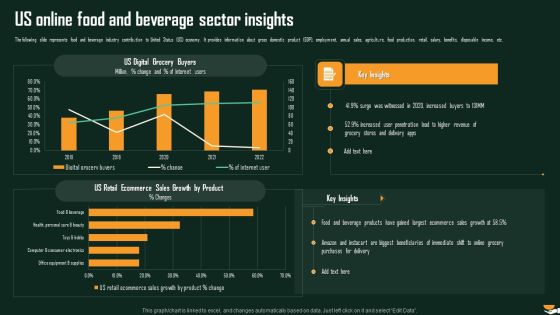
Us Online Food And Beverage Sector Insights International Food And Beverages Sector Analysis Template PDF
The following slide represents food and beverage industry contribution to United Status US economy. It provides information about gross domestic product GDP, employment, annual sales, agriculture, food production, retail, salary, benefits, disposable income, etc. Deliver and pitch your topic in the best possible manner with this Us Online Food And Beverage Sector Insights International Food And Beverages Sector Analysis Template PDF. Use them to share invaluable insights on Digital Grocery, Increased Penetration, Retail Ecommerce and impress your audience. This template can be altered and modified as per your expectations. So, grab it now.

Company Financial Performance Indicators Dashboard With Liquidity And Turnover Ratios Formats PDF
This graph or chart is linked to excel, and changes automatically based on data. Just left click on it and select Edit Data. Pitch your topic with ease and precision using this Company Financial Performance Indicators Dashboard With Liquidity And Turnover Ratios Formats PDF. This layout presents information on Cash Balance, Days Inventory Outstanding, Days Payable Outstanding. It is also available for immediate download and adjustment. So, changes can be made in the color, design, graphics or any other component to create a unique layout.
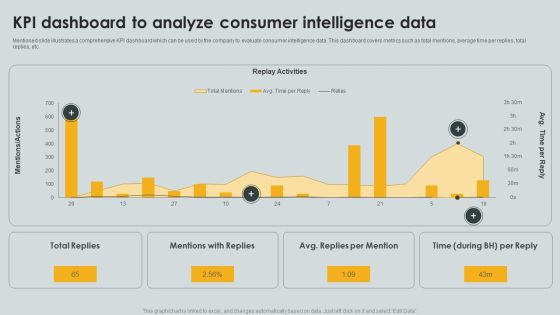
KPI Dashboard To Analyze Consumer Intelligence Data Ppt PowerPoint Presentation File Portfolio PDF
Mentioned slide illustrates a comprehensive KPI dashboard which can be used by the company to evaluate consumer intelligence data. This dashboard covers metrics such as total mentions, average time per replies, total replies, etc. Pitch your topic with ease and precision using this KPI Dashboard To Analyze Consumer Intelligence Data Ppt PowerPoint Presentation File Portfolio PDF. This layout presents information on Replay Activities, Total Replies, Mentions Replies. It is also available for immediate download and adjustment. So, changes can be made in the color, design, graphics or any other component to create a unique layout.
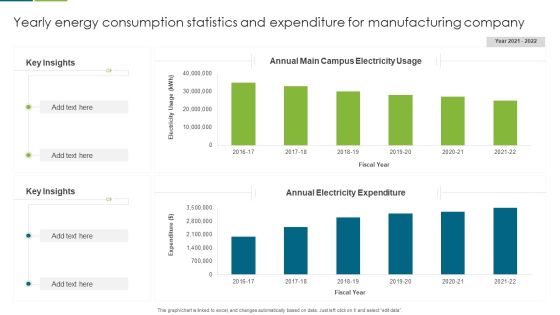
Yearly Energy Consumption Statistics And Expenditure For Manufacturing Company Guidelines PDF
This graph or chart is linked to excel, and changes automatically based on data. Just left click on it and select edit data. Pitch your topic with ease and precision using this Yearly Energy Consumption Statistics And Expenditure For Manufacturing Company Guidelines PDF. This layout presents information on Key Insights, Annual Electricity Expenditure, Annual Main Campus, Electricity Usage. It is also available for immediate download and adjustment. So, changes can be made in the color, design, graphics or any other component to create a unique layout.
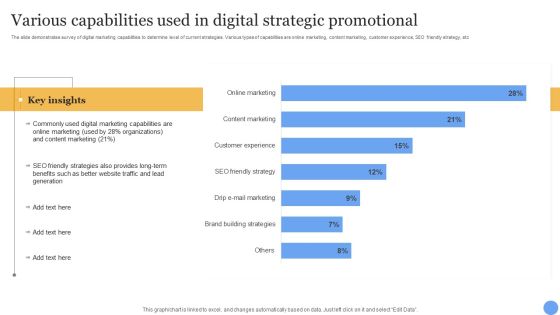
Various Capabilities Used In Digital Strategic Promotional Topics PDF
The slide demonstrates survey of digital marketing capabilities to determine level of current strategies. Various types of capabilities are online marketing, content marketing, customer experience, SEO friendly strategy, etc. Pitch your topic with ease and precision using this Various Capabilities Used In Digital Strategic Promotional Topics PDF. This layout presents information on Digital Marketing Capabilities, Content Marketing, Online Marketing. It is also available for immediate download and adjustment. So, changes can be made in the color, design, graphics or any other component to create a unique layout.
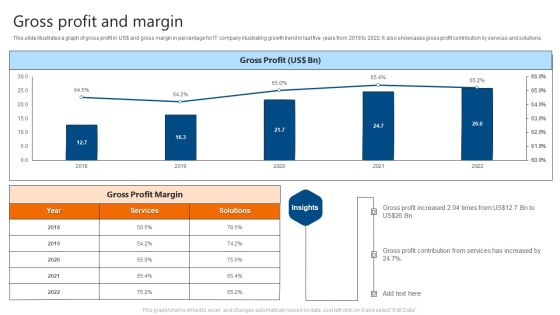
Gross Profit And Margin IT Software Development Company Profile Slides PDF
This slide illustrates a graph of gross profit in US doller and gross margin in percentage for IT company illustrating growth trend in last five years from 2018 to 2022. It also showcases gross profit contribution by services and solutions. Deliver and pitch your topic in the best possible manner with this Gross Profit And Margin IT Software Development Company Profile Slides PDF. Use them to share invaluable insights on Gross Profit, Margin and impress your audience. This template can be altered and modified as per your expectations. So, grab it now.
Net Profit And Margin IT Software Development Company Profile Icons PDF
This slide illustrates a graph of net profit in US doller and net margin in percentage for IT company illustrating growth trend in last five years from 2018 to 2022. It also showcases net profit contribution by services and solutions. Deliver an awe inspiring pitch with this creative Net Profit And Margin IT Software Development Company Profile Icons PDF bundle. Topics like Net Profit, Net Profit Margin can be discussed with this completely editable template. It is available for immediate download depending on the needs and requirements of the user.

Operating Profit And Margin IT Software Development Company Profile Guidelines PDF
This slide illustrates a graph of operating profit in US doller and operating margin in percentage for IT company illustrating growth trend in last five years from 2018 to 2022. It also showcases operating profit contribution by services and solutions. Deliver and pitch your topic in the best possible manner with this Operating Profit And Margin IT Software Development Company Profile Guidelines PDF. Use them to share invaluable insights on Operating Profit, Operating Profit Margin and impress your audience. This template can be altered and modified as per your expectations. So, grab it now.
Research And Development Spend IT Software Development Company Profile Icons PDF
This slide shows the research and development spend by IT company. It highlights historical R and D expenditure, partner R and D center, university tie-ups, research labs, scientist, researchers and technology platform. Deliver and pitch your topic in the best possible manner with this Research And Development Spend IT Software Development Company Profile Icons PDF. Use them to share invaluable insights on Company, Research, Development Spend and impress your audience. This template can be altered and modified as per your expectations. So, grab it now.
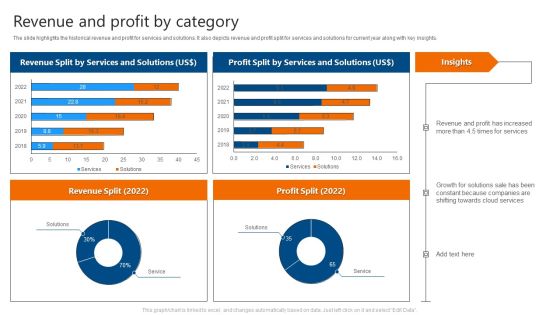
Revenue And Profit By Category IT Software Development Company Profile Graphics PDF
The slide highlights the historical revenue and profit for services and solutions. It also depicts revenue and profit split for services and solutions for current year along with key insights. Deliver an awe inspiring pitch with this creative Revenue And Profit By Category IT Software Development Company Profile Graphics PDF bundle. Topics like Revenue Split By Services, Profit Split By Services can be discussed with this completely editable template. It is available for immediate download depending on the needs and requirements of the user.
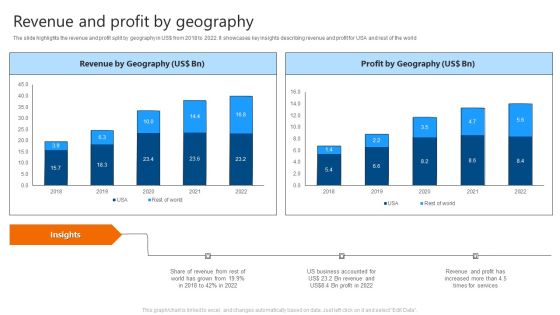
Revenue And Profit By Geography IT Software Development Company Profile Formats PDF
The slide highlights the revenue and profit split by geography in US doller from 2018 to 2022. It showcases key insights describing revenue and profit for USA and rest of the world. Deliver and pitch your topic in the best possible manner with this Revenue And Profit By Geography IT Software Development Company Profile Formats PDF. Use them to share invaluable insights on Revenue By Geography, Profit By Geography and impress your audience. This template can be altered and modified as per your expectations. So, grab it now.
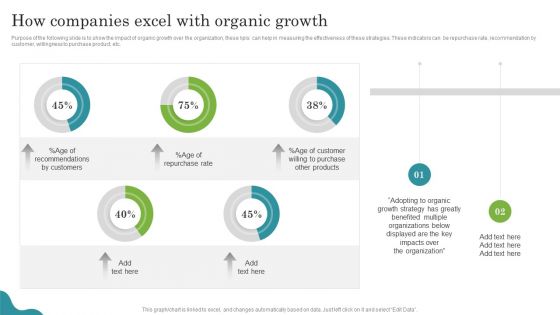
Promoting Growth Internal Operations Techniques Playbook How Companies Excel With Organic Growth Rules PDF
Purpose of the following slide is to show the impact of organic growth over the organization, these kpis can help in measuring the effectiveness of these strategies. These indicators can be repurchase rate, recommendation by customer, willingness to purchase product, etc. Deliver an awe inspiring pitch with this creative Promoting Growth Internal Operations Techniques Playbook How Companies Excel With Organic Growth Rules PDF bundle. Topics like Organizations, Growth Strategy, Purchase can be discussed with this completely editable template. It is available for immediate download depending on the needs and requirements of the user.

Customer Behavior Analytics Dashboard To Improve Satisfaction Ppt File Infographics PDF
The following slide provides an insight of websites performance that includes date parameters. The dashboard includes sessions, users, pageviews, bounce rate and percentage of new sessions. Pitch your topic with ease and precision using this Customer Behavior Analytics Dashboard To Improve Satisfaction Ppt File Infographics PDF. This layout presents information on Session, Avg Session Duration, Bounce Rate. It is also available for immediate download and adjustment. So, changes can be made in the color, design, graphics or any other component to create a unique layout.

Customer Buying Behavior Analytics Report Ppt Inspiration Elements PDF
The following slide showcases analytic report of consumer behavior that provides an insight on consumers purchasing or buying behavior. key findings covered are customers compare prices, prefer online shopping, cut on unnecessary expenses etc. Pitch your topic with ease and precision using this Customer Buying Behavior Analytics Report Ppt Inspiration Elements PDF. This layout presents information on Customer Will, Continue Shopping, Stores Reopen, Customers Compare Prices. It is also available for immediate download and adjustment. So, changes can be made in the color, design, graphics or any other component to create a unique layout.

Annual Staff Productivity Enhancement Graph Ppt PowerPoint Presentation Styles Aids PDF
This slide can be used to show improvement in employee productivity over past four years. The main reason for productivity improvement is the managerial and organizational support provided to employees. Pitch your topic with ease and precision using this Annual Staff Productivity Enhancement Graph Ppt PowerPoint Presentation Styles Aids PDF. This layout presents information on Employee Productivity, Improved Last, Due Continuous. It is also available for immediate download and adjustment. So, changes can be made in the color, design, graphics or any other component to create a unique layout.

Dashboard For Analyzing Hiring Status In Organization Ppt PowerPoint Presentation Gallery Images PDF
This slide defines the analysis dashboard for recruitment status. It includes information related to hiring funnel, age of applicants, and male and female ratio. Pitch your topic with ease and precision using this Dashboard For Analyzing Hiring Status In Organization Ppt PowerPoint Presentation Gallery Images PDF. This layout presents information on Recruitment Funnel, Time To Hire, Age Applicants. It is also available for immediate download and adjustment. So, changes can be made in the color, design, graphics or any other component to create a unique layout.
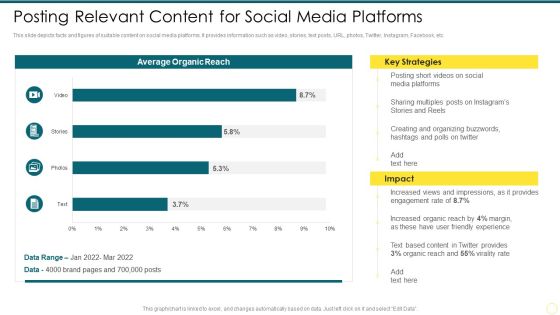
Strategies To Enhance Social Media Posting Relevant Content For Social Media Platforms Designs PDF
This slide depicts facts and figures of suitable content on social media platforms. It provides information such as video, stories, text posts, URL, photos, Twitter, Instagram, Facebook, etc. Deliver and pitch your topic in the best possible manner with this Strategies To Enhance Social Media Posting Relevant Content For Social Media Platforms Designs PDF. Use them to share invaluable insights on Video, Stories, Text Posts, URL, Photos and impress your audience. This template can be altered and modified as per your expectations. So, grab it now.
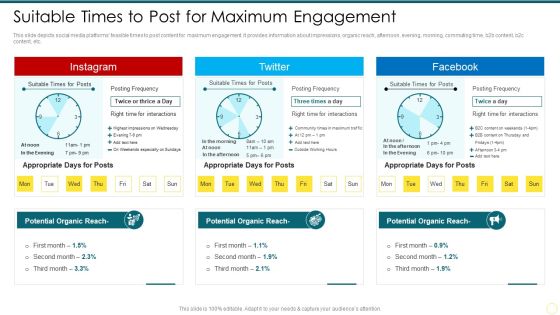
Strategies To Enhance Social Media Suitable Times To Post For Maximum Engagement Guidelines PDF
This slide depicts social media platforms feasible times to post content for maximum engagement. It provides information about impressions, organic reach, afternoon, evening, morning, commuting time, b2b content, b2c content, etc. Deliver and pitch your topic in the best possible manner with this Strategies To Enhance Social Media Suitable Times To Post For Maximum Engagement Guidelines PDF. Use them to share invaluable insights on Instagram, Twitter, Facebook and impress your audience. This template can be altered and modified as per your expectations. So, grab it now.

Company Key Figures For Past 5 Years Market Entry Approach For Apparel Sector Clipart PDF
This slide covers the dashboard with major values for the last five years. It includes KPIs such as sales, net operating profit, sales by geographic areas, and number of employees. Deliver an awe inspiring pitch with this creative Company Key Figures For Past 5 Years Market Entry Approach For Apparel Sector Clipart PDF bundle. Topics like Sales Geographical, Number Employees, Operating Profit can be discussed with this completely editable template. It is available for immediate download depending on the needs and requirements of the user.

Analysis Of Average Wait Time At Retail Store Checkout Counters Retail Outlet Performance Assessment Mockup PDF
The slide visually provides information regarding the average time customer spent at the checkout counter of retail store. It also provides details regarding waiting timings of competitors.Deliver and pitch your topic in the best possible manner with this Analysis Of Average Wait Time At Retail Store Checkout Counters Retail Outlet Performance Assessment Mockup PDF. Use them to share invaluable insights on Average Customer, Counter Reflecting, Checkout Counter and impress your audience. This template can be altered and modified as per your expectations. So, grab it now.

Assessment Of Theft Incidents At Retail Store Retail Outlet Performance Assessment Mockup PDF
This slide provides information regarding the percentage of theft incidents that occurred at the retail store in a given quarter such as shoplifting, employee theft, card fraud, etc. Deliver and pitch your topic in the best possible manner with this Assessment Of Theft Incidents At Retail Store Retail Outlet Performance Assessment Mockup PDF. Use them to share invaluable insights on Assessment Theft, Incidents, Retail Store and impress your audience. This template can be altered and modified as per your expectations. So, grab it now.

Retail Store Employee Engagement Dashboards Retail Outlet Performance Assessment Summary PDF
This slide represents the dashboard to showcase retail stores employee engagement score teamwise, hierarchy levels wise. It also provides details of score on multiple engagement dimensions such as work life balance, salary, growth opportunities etc.Deliver an awe inspiring pitch with this creative Retail Store Employee Engagement Dashboards Retail Outlet Performance Assessment Summary PDF bundle. Topics like Engagement Score, Promoter Score, Engagement Dimensions can be discussed with this completely editable template. It is available for immediate download depending on the needs and requirements of the user.
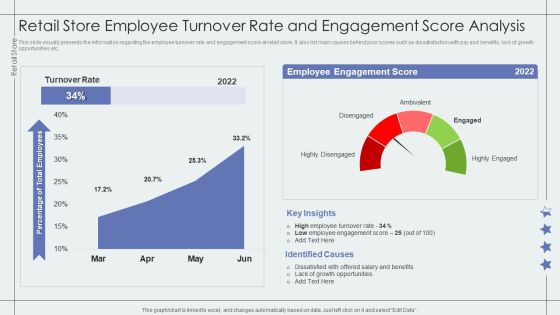
Retail Store Employee Turnover Rate And Engagement Score Analysis Retail Outlet Performance Assessment Professional PDF
This slide visually presents the information regarding the employee turnover rate and engagement score at retail store. It also list main causes behind poor scores such as dissatisfaction with pay and benefits, lack of growth opportunities etc.Deliver an awe inspiring pitch with this creative Retail Store Employee Turnover Rate And Engagement Score Analysis Retail Outlet Performance Assessment Professional PDF bundle. Topics like Employee Engagement, Identified Causes, Growth Opportunities can be discussed with this completely editable template. It is available for immediate download depending on the needs and requirements of the user.

Retail Store Social Media Activities Analysis Retail Outlet Performance Assessment Rules PDF
This slide represents the dashboard to showcase retail store social media activities such as followers on Facebook, Twitter, website traffic, etc. It also provides information regarding social media channels engagement in terms of clicks, shares, likes, and comments.Deliver an awe inspiring pitch with this creative Retail Store Social Media Activities Analysis Retail Outlet Performance Assessment Rules PDF bundle. Topics like Social Media, Channels, Referral Traffic can be discussed with this completely editable template. It is available for immediate download depending on the needs and requirements of the user.

Landing Page Leads And Revenue Generation Analytics For User Experience Optimization Dashboard Formats PDF
This slide covers website analytics based on revenue earned. It also included leads generated, bounce rates, customer churn stats, annual and monthly recurring revenue, etc. Pitch your topic with ease and precision using this Landing Page Leads And Revenue Generation Analytics For User Experience Optimization Dashboard Formats PDF. This layout presents information on Monthly Recurring Revenue, Bounce Rate, Gross Volume. It is also available for immediate download and adjustment. So, changes can be made in the color, design, graphics or any other component to create a unique layout.
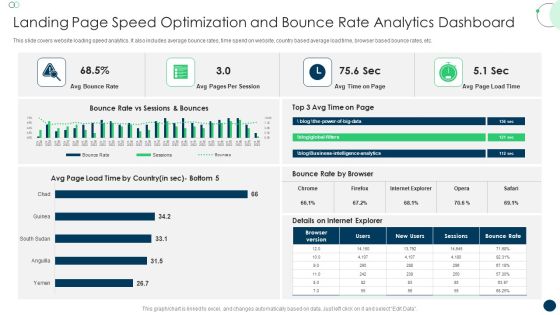
Landing Page Speed Optimization And Bounce Rate Analytics Dashboard Topics PDF
This slide covers website loading speed analytics. It also includes average bounce rates, time spend on website, country based average load time, browser based bounce rates, etc. Pitch your topic with ease and precision using this Landing Page Speed Optimization And Bounce Rate Analytics Dashboard Topics PDF. This layout presents information on Avg Bounce Rate, Avg Pages, Per Session. It is also available for immediate download and adjustment. So, changes can be made in the color, design, graphics or any other component to create a unique layout.

Customer Client Referral Program Performance Dashboard Ppt File Visual Aids PDF
This slide covers customer referral program performance evaluating dashboard. It involves participation rate by referrals, number of referred customers, conversion rate and total revenue generated. Pitch your topic with ease and precision using this Customer Client Referral Program Performance Dashboard Ppt File Visual Aids PDF. This layout presents information on Participation Rate Referrals, Number Referred Customers, Referral Conversion Rate. It is also available for immediate download and adjustment. So, changes can be made in the color, design, graphics or any other component to create a unique layout.
Youtube Video Marketing Analytics Dashboard Ppt Icon Portrait PDF
This slide covers dashboard illustrating performance of ad campaigns on YouTube. It includes elements such as total gained subscribers, likes, dislikes, daily active users, views, campaign performance, traffic sources by views, etc. Pitch your topic with ease and precision using this Youtube Video Marketing Analytics Dashboard Ppt Icon Portrait PDF. This layout presents information on Average Vies, Per Week, Campaigns, Traffic Sources. It is also available for immediate download and adjustment. So, changes can be made in the color, design, graphics or any other component to create a unique layout.

Best Practices Of Automating Customer Service Achieving Operational Efficiency Brochure PDF
The following slide outlines key practices of automating customer support. Featuring automated replies, organizing the support queue, redirecting customers to helpdesk and conducting customer surveys are some of the major practices which are highlighted in the slide. Deliver an awe inspiring pitch with this creative Best Practices Of Automating Customer Service Achieving Operational Efficiency Brochure PDF bundle. Topics like Featuring Automated, Support Queue, Redirect Customers can be discussed with this completely editable template. It is available for immediate download depending on the needs and requirements of the user.

Impact Of Manual Process On Business Performance Achieving Operational Efficiency Guidelines PDF
The following slide outlines the impact of current manual process on organization performance. The organization faces various issues such as reduction in productivity, bottom line and increase in error rate.Deliver and pitch your topic in the best possible manner with this Impact Of Manual Process On Business Performance Achieving Operational Efficiency Guidelines PDF. Use them to share invaluable insights on Reduction Productivity, Increase Errors, Decline Profit and impress your audience. This template can be altered and modified as per your expectations. So, grab it now.
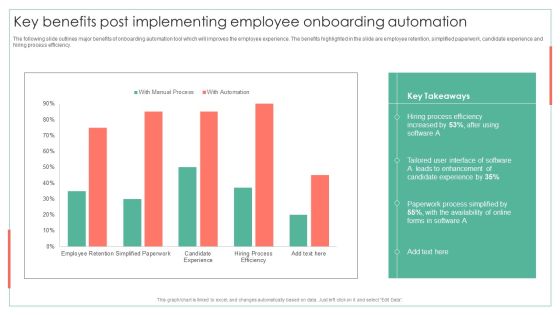
Key Benefits Post Implementing Employee Onboarding Automation Achieving Operational Efficiency Elements PDF
The following slide outlines major benefits of onboarding automation tool which will improves the employee experience. The benefits highlighted in the slide are employee retention, simplified paperwork, candidate experience and hiring process efficiency. Deliver an awe inspiring pitch with this creative Key Benefits Post Implementing Employee Onboarding Automation Achieving Operational Efficiency Elements PDF bundle. Topics like Process Efficiency, Interface Software, Paperwork Process can be discussed with this completely editable template. It is available for immediate download depending on the needs and requirements of the user.
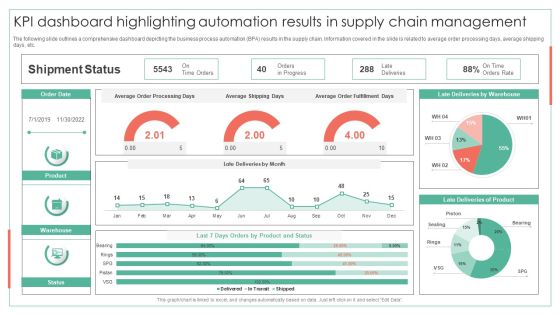
KPI Dashboard Highlighting Automation Results In Supply Achieving Operational Efficiency Graphics PDF
The following slide outlines a comprehensive dashboard depicting the business process automation BPA results in the supply chain. Information covered in the slide is related to average order processing days, average shipping days, etc.Deliver and pitch your topic in the best possible manner with this KPI Dashboard Highlighting Automation Results In Supply Achieving Operational Efficiency Graphics PDF. Use them to share invaluable insights on Orders Progress, Late Deliveries, Deliveries Warehouse and impress your audience. This template can be altered and modified as per your expectations. So, grab it now.

KPI Dashboard To Track Automation Performance In Employee Onboarding Achieving Operational Efficiency Download PDF
The following slide outlines performance key performance indicator KPI which can be used to evaluate business process automation performance in employee onboarding. The metrics highlighted in the slide are onboarding completion status, hires per office, etc.Deliver an awe inspiring pitch with this creative KPI Dashboard To Track Automation Performance In Employee Onboarding Achieving Operational Efficiency Download PDF bundle. Topics like Onboarding Completion, Onboarding, Onboarding Completion can be discussed with this completely editable template. It is available for immediate download depending on the needs and requirements of the user.
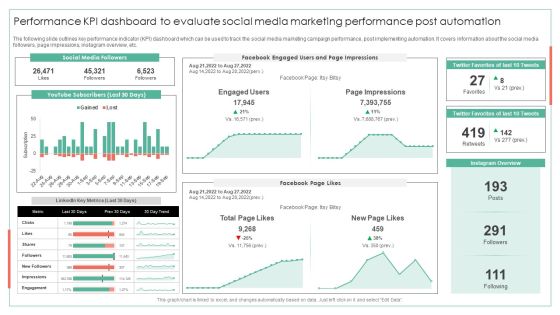
Performance KPI Dashboard To Evaluate Social Media Marketing Performance Post Automation Ideas PDF
The following slide outlines key performance indicator KPI dashboard which can be used to track the social media marketing campaign performance, post implementing automation. It covers information about the social media followers, page impressions, instagram overview, etc.Deliver an awe inspiring pitch with this creative Performance KPI Dashboard To Evaluate Social Media Marketing Performance Post Automation Ideas PDF bundle. Topics like Page Impressions, Twitter Favorites, Instagram Overview can be discussed with this completely editable template. It is available for immediate download depending on the needs and requirements of the user.

Various Factors To Consider While Selecting The Supply Chain Achieving Operational Efficiency Template PDF
The following slide outlines the different factors which can be considered before selecting the automation tool. Reliability of the vendor, availability of core features, usability of the software and deployment are some of the key factors which are highlighted in the slide.Deliver an awe inspiring pitch with this creative Various Factors To Consider While Selecting The Supply Chain Achieving Operational Efficiency Template PDF bundle. Topics like Reliability Vendor, Cloud Deployment, Objectives Effectively can be discussed with this completely editable template. It is available for immediate download depending on the needs and requirements of the user.

Digitalization Guide For Business How Digital Transformation Can Change Your Organization Background PDF
Purpose of the following slide is to show, how digital transformation can change organization as it provides key stats related to the same. It displays adoption rate of digital transformation, total number of companies who have experienced increase in revenues etc. Deliver an awe inspiring pitch with this creative Digitalization Guide For Business How Digital Transformation Can Change Your Organization Background PDF bundle. Topics like Adoption Rate, Digital Transformation, Various Organizations can be discussed with this completely editable template. It is available for immediate download depending on the needs and requirements of the user.

Improving Digital Community Engagement Strategy Posting Relevant Content For Social Media Platforms Pictures PDF
This slide depicts facts and figures of suitable content on social media platforms. It provides information such as video, stories, text posts, URL, photos, Twitter, Instagram, Facebook, etc. Deliver and pitch your topic in the best possible manner with this Improving Digital Community Engagement Strategy Posting Relevant Content For Social Media Platforms Pictures PDF. Use them to share invaluable insights on Increase Organic, Social Media Platforms, Posting Relevant Content and impress your audience. This template can be altered and modified as per your expectations. So, grab it now.

Improving Digital Community Engagement Strategy Social Media Platforms Dashboard With Key Metrics Professional PDF
This slide shows KPI dashboard for assessing performance of social media platforms. It provides information about followers, likes, clicks, shares, impressions, engaged users, new followers, etc. Deliver and pitch your topic in the best possible manner with this Improving Digital Community Engagement Strategy Social Media Platforms Dashboard With Key Metrics Professional PDF. Use them to share invaluable insights on Social Media Platforms Engagement, Key Engagement Metrics and impress your audience. This template can be altered and modified as per your expectations. So, grab it now.

Positive Impact Post Successful Implementation Of Social Media Engagement Strategy Microsoft PDF
This slide shows major impact post implementing social media strategy for improved engagement. It provides information about organic reach, lead generation, average share per post, new page likes and followers, etc. Deliver and pitch your topic in the best possible manner with this Positive Impact Post Successful Implementation Of Social Media Engagement Strategy Microsoft PDF. Use them to share invaluable insights on Successful Implementation, Social Media Engagement Strategy and impress your audience. This template can be altered and modified as per your expectations. So, grab it now.

Analyzing Top Reasons For Product Portfolio Failure Designs PDF
This slide displays various reasons that may contribute to product portfolio failure in new region. Most contributing factor is unclear or continuously changing product definitions which contribute 42 percentage to product failure. Deliver and pitch your topic in the best possible manner with this Analyzing Top Reasons For Product Portfolio Failure Designs PDF. Use them to share invaluable insights on Product Portfolio, Analyzing Top Reasons and impress your audience. This template can be altered and modified as per your expectations. So, grab it now.

Method To Introduce New Product Offerings In The Industry Categorizing Different Products Using BCG Matrix Structure PDF
Following slide portrays McKinsey portfolio matrix that can be used by an organization to categorize its different product offerings with respect to market attractiveness and business strength. Deliver and pitch your topic in the best possible manner with this Method To Introduce New Product Offerings In The Industry Categorizing Different Products Using BCG Matrix Structure PDF. Use them to share invaluable insights on Categorizing Different Products, Matrix and impress your audience. This template can be altered and modified as per your expectations. So, grab it now.
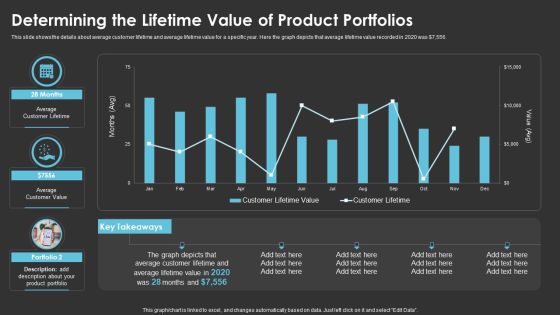
Method To Introduce New Product Offerings In The Industry Determining The Lifetime Value Of Product Portfolios Information PDF
This slide shows the details about average customer lifetime and average lifetime value for a specific year. Here the graph depicts that average lifetime value recorded in 2020 was dollar 7,556. Deliver an awe inspiring pitch with this creative Method To Introduce New Product Offerings In The Industry Determining The Lifetime Value Of Product Portfolios Information PDF bundle. Topics like Average Customer Lifetime, Product Portfolio can be discussed with this completely editable template. It is available for immediate download depending on the needs and requirements of the user.
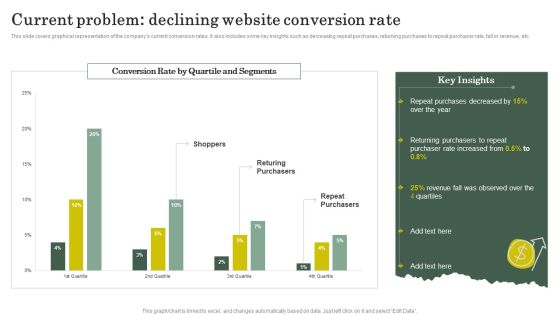
Strategies To Attract Customers And Lead Generation Current Problem Declining Website Conversion Rate Themes PDF
This slide covers graphical representation of the companys current conversion rates. It also includes some key insights such as decreasing repeat purchases, returning purchases to repeat purchaser rate, fall in revenue, etc. Deliver and pitch your topic in the best possible manner with this Strategies To Attract Customers And Lead Generation Current Problem Declining Website Conversion Rate Themes PDF. Use them to share invaluable insights on Revenue, Purchaser Rate and impress your audience. This template can be altered and modified as per your expectations. So, grab it now.
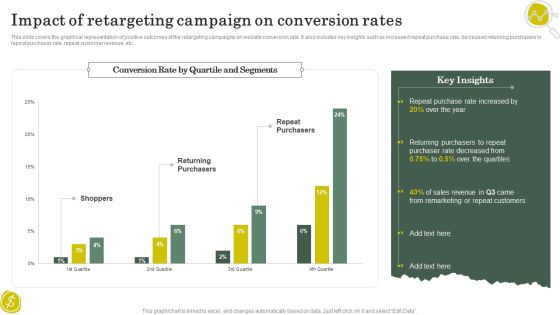
Strategies To Attract Customers And Lead Generation Impact Of Retargeting Campaign On Conversion Rates Pictures PDF
This slide covers the graphical representation of positive outcomes of the retargeting campaigns on website conversion rate. It also includes key insights such as increased repeat purchase rate, decreased returning purchasers to repeat purchaser rate, repeat customer revenue, etc. Deliver and pitch your topic in the best possible manner with this Strategies To Attract Customers And Lead Generation Impact Of Retargeting Campaign On Conversion Rates Pictures PDF. Use them to share invaluable insights on Purchase Rate, Remarketing, Sales Revenue and impress your audience. This template can be altered and modified as per your expectations. So, grab it now.

Deployment Of Smart Factory Solutions Key Impact Of Smart Manufacturing Implementation Download PDF
This slide represents key impact of smart manufacturing on organization. It highlights increase in product quality and productivity level leading to enhancement in customer satisfaction level and revenue generation. Deliver and pitch your topic in the best possible manner with this Deployment Of Smart Factory Solutions Key Impact Of Smart Manufacturing Implementation Download PDF. Use them to share invaluable insights on Product Quality, Customer Satisfaction, Product Defects, Revenue and impress your audience. This template can be altered and modified as per your expectations. So, grab it now.
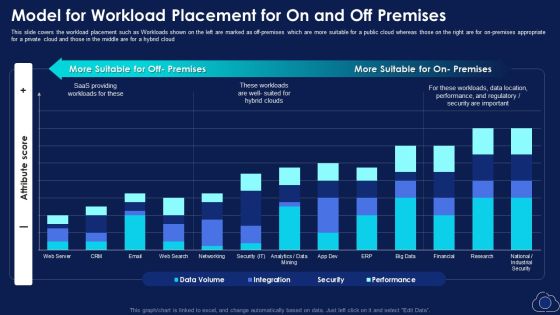
Model For Workload Placement For On And Off Premise Topics PDF
This slide covers the workload placement such as Workloads shown on the left are marked as off premises which are more suitable for a public cloud whereas those on the right are for on premises appropriate for a private cloud and those in the middle are for a hybrid cloud. Deliver an awe inspiring pitch with this creative Model For Workload Placement For On And Off Premise Topics PDF bundle. Topics like Model For Workload Placement, On And Off Premises can be discussed with this completely editable template. It is available for immediate download depending on the needs and requirements of the user.
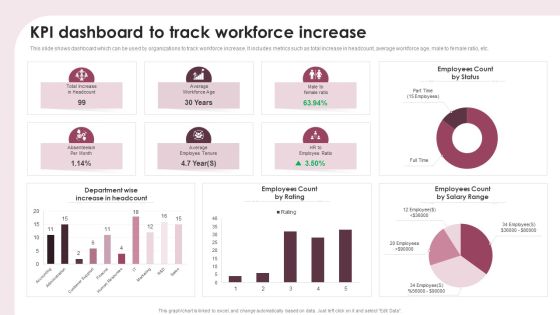
KPI Dashboard To Track Workforce Increase Ppt Show Portfolio PDF
This slide shows dashboard which can be used by organizations to track workforce increase. It includes metrics such as total increase in headcount, average workforce age, male to female ratio, etc. Pitch your topic with ease and precision using this KPI Dashboard To Track Workforce Increase Ppt Show Portfolio PDF. This layout presents information on Department Wise, Increase Headcount, Employees Count Rating. It is also available for immediate download and adjustment. So, changes can be made in the color, design, graphics or any other component to create a unique layout.
Developing Significant Business Product And Customer Performance Tracking Clipart PDF
This slide provides information regarding dashboard utilized by firm to monitor performance of products offered and customer associated. The performance is tracked through revenues generated, new customer acquired, customer satisfaction, sales comparison, etc. Deliver and pitch your topic in the best possible manner with this Developing Significant Business Product And Customer Performance Tracking Clipart PDF. Use them to share invaluable insights on Revenue, New Customer, Revenue and impress your audience. This template can be altered and modified as per your expectations. So, grab it now.

Youtube Advertising Techniques Customer Shifting Patterns Towards Youtube Professional PDF
This slide highlights customer shifting patterns with user time spend on Facebook, YouTube, twitter and Instagram and also showcases how customer preference changing from Facebook to YouTube. Deliver and pitch your topic in the best possible manner with this Youtube Advertising Techniques Customer Shifting Patterns Towards Youtube Professional PDF. Use them to share invaluable insights on Yearly Company Revenue, Monthly Product Sales, 2016 To 2021 and impress your audience. This template can be altered and modified as per your expectations. So, grab it now.

IT Security Automation Tools Integration Time To Fix Security Threat With Manual Testing Template PDF
This slide highlights the time to fix the security threat and error with manual testing in bar graph format. It covers key takeaways which explains how much percent of error are fixed in 1 to 3 hour, 3 to 6 hour and working day etc. Deliver and pitch your topic in the best possible manner with this IT Security Automation Tools Integration Time To Fix Security Threat With Manual Testing Template PDF. Use them to share invaluable insights on Manual Testing, Fix Error, 3 Working Days and impress your audience. This template can be altered and modified as per your expectations. So, grab it now.
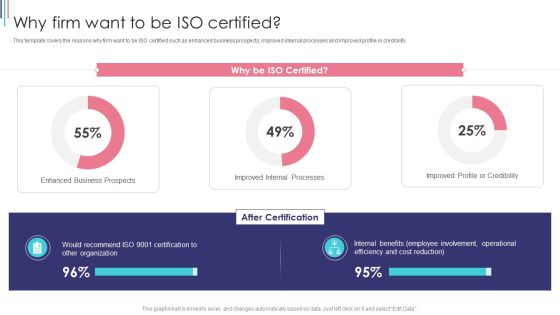
ISO 9001 Standard For Quality Control Why Firm Want To Be ISO Certified Mockup PDF
This template covers the reasons why firm want to be ISO certified such as enhanced business prospects, improved internal processes and improved profile or credibility Deliver an awe inspiring pitch with this creative ISO 9001 Standard For Quality Control Why Firm Want To Be ISO Certified Mockup PDF bundle. Topics like Improved Internal Processes, Improved Profile Or Credibility, Enhanced Business Prospects can be discussed with this completely editable template. It is available for immediate download depending on the needs and requirements of the user.

Employee Headcount Analysis On The Basis Of Employees Age Ppt PowerPoint Presentation Model Ideas PDF
This slide shows the age wise headcount analysis of employees in the organization. It include various age groups such as 20 25, 25 30, 30 35, etc.Pitch your topic with ease and precision using this Employee Headcount Analysis On The Basis Of Employees Age Ppt PowerPoint Presentation Model Ideas PDF. This layout presents information on Employee Headcount, Analysis Basis, Employees Age. It is also available for immediate download and adjustment. So, changes can be made in the color, design, graphics or any other component to create a unique layout.

Revenue Generated From Various Types Of Engineering And Construction Services Ppt PowerPoint Presentation File Guide PDF
This slide shows the revenue generated from engineering and construction services. It includes new construction, interior fit out and site improvement. Pitch your topic with ease and precision using this Revenue Generated From Various Types Of Engineering And Construction Services Ppt PowerPoint Presentation File Guide PDF. This layout presents information on Revenue Generated, New Construction, Been Increased. It is also available for immediate download and adjustment. So, changes can be made in the color, design, graphics or any other component to create a unique layout.

Key Insights Of Digital Marketing Administration Ppt PowerPoint Presentation Styles Graphics Template PDF
The following slide highlights the KPIs of digital marketing to assess ROI. It includes monthly active user rate, customer retention rate at the end of the year, current vs previous active users, quarterly growth rate etc.Pitch your topic with ease and precision using this Key Insights Of Digital Marketing Administration Ppt PowerPoint Presentation Styles Graphics Template PDF. This layout presents information on Possible Reasons, Content Marketing, Growth Rate. It is also available for immediate download and adjustment. So, changes can be made in the color, design, graphics or any other component to create a unique layout.
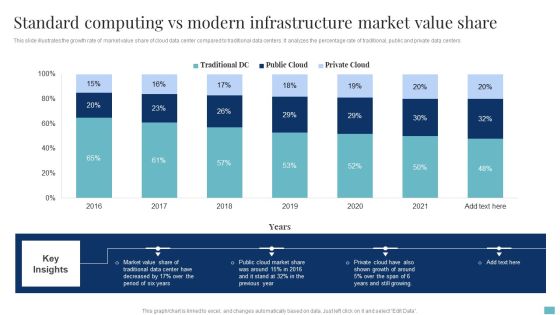
Standard Computing Vs Modern Infrastructure Market Value Share Brochure PDF
This slide illustrates the growth rate of market value share of cloud data center compared to traditional data centers. It analyzes the percentage rate of traditional, public and private data centers. Pitch your topic with ease and precision using this Standard Computing Vs Modern Infrastructure Market Value Share Brochure PDF. This layout presents information on Cloud Market Share, Market Value Share, Growth. It is also available for immediate download and adjustment. So, changes can be made in the color, design, graphics or any other component to create a unique layout.

Client Engagement Loyalty Programs Comparison Chart Infographics PDF
This slide depicts comparison chart of customer loyalty programs used to check most effective loyalty program. It includes programs such as point rewards, expense rewards, cash back, surprise rewards, etc. Pitch your topic with ease and precision using this Client Engagement Loyalty Programs Comparison Chart Infographics PDF. This layout presents information on Point Rewards, Next Purchase, Customers. It is also available for immediate download and adjustment. So, changes can be made in the color, design, graphics or any other component to create a unique layout.

Employee Risk Key Performance Indicator Dashboard With Case Incident Rate Ppt Professional Information PDF
The following slide highlights the employee safety key performance indicator dashboard with case incident rate illustrating total case occurrence rate, last reported case, days without reported, causing items, corrective actions, incident pyramid, incident by month and major causes. Pitch your topic with ease and precision using this Employee Risk Key Performance Indicator Dashboard With Case Incident Rate Ppt Professional Information PDF. This layout presents information on Total Case, Incident Rate, Last Incident Reported, Incident Causing Items. It is also available for immediate download and adjustment. So, changes can be made in the color, design, graphics or any other component to create a unique layout.

Health And Risk KPI Dashboard Ppt Pictures Designs Download PDF
The slide highlights the health and safety key performance indicator dashboard illustrating key headings which includes key objectives, inspections, total reports vs over due reports, injuries by body part and accident trends. Pitch your topic with ease and precision using this Health And Risk KPI Dashboard Ppt Pictures Designs Download PDF. This layout presents information on Key Objectives, Inspections, Accidents Trends. It is also available for immediate download and adjustment. So, changes can be made in the color, design, graphics or any other component to create a unique layout.

Risk Key Performance Indicator Dashboard For Manufacturing Company Ppt Gallery Graphics Design PDF
The following slide highlights the safety key performance indicator dashboard for manufacturing company. It showcases safety incident per employee, total number of cases, safety events avoided, accumulated total and safety incidents. Pitch your topic with ease and precision using this Risk Key Performance Indicator Dashboard For Manufacturing Company Ppt Gallery Graphics Design PDF. This layout presents information on Safety Incidents, Safety Incident Avoided, Safety Incident Accumulated. It is also available for immediate download and adjustment. So, changes can be made in the color, design, graphics or any other component to create a unique layout.

Improve IT Service Desk Service Desk Dashboard For Monitoring IT Infrastructure Introduction PDF
This slide illustrates service desk dashboard for monitoring information technology IT infrastructure. It provides information about issues, safety inspection, problem servers, workstations, operating system, Windows, Mac, Linux, etc.Deliver and pitch your topic in the best possible manner with this Improve IT Service Desk Service Desk Dashboard For Monitoring IT Infrastructure Introduction PDF. Use them to share invaluable insights on Problem Servers, Problem Workstations, Operating System and impress your audience. This template can be altered and modified as per your expectations. So, grab it now.


 Continue with Email

 Home
Home


