Project Funding

Statistics Indicating Future Demand For Digital Insurance Technologies Brochure PDF
This slide illustrates data indicating future demand for insurtech digital technology. It provides information about data analytics, cloud technology, internal blockchain application, artificial intelligence, etc. Pitch your topic with ease and precision using this Statistics Indicating Future Demand For Digital Insurance Technologies Brochure PDF. This layout presents information on Data Analytics, Cloud Technology, Internal Blockchain Application. It is also available for immediate download and adjustment. So, changes can be made in the color, design, graphics or any other component to create a unique layout.

Graph Indicating Clinical Trial Phases Probability Of Success Infographics PDF
This slide compares and visually presents the success rate of each stage with preceding one of the clinical research procedures to represent the achievement of the drug efficacy objective of the firm.Deliver and pitch your topic in the best possible manner with this Graph Indicating Clinical Trial Phases Probability Of Success Infographics PDF Use them to share invaluable insights on Graph Indicating Clinical Trial Phases Probability Of Success and impress your audience. This template can be altered and modified as per your expectations. So, grab it now.
Key Challenges Faced By The Company At Each Stage Icons PDF
This slide shows the major challenges faced by the company ate different stages of sales funnel. Key challenges mentioned in the slide are lengthy sales cycle, lack of qualified leads, low closing rate etc. Deliver an awe inspiring pitch with this creative Key Challenges Faced By The Company At Each Stage Icons PDF bundle. Topics like Key Challenges Faced By The Company At Each Stage can be discussed with this completely editable template. It is available for immediate download depending on the needs and requirements of the user.
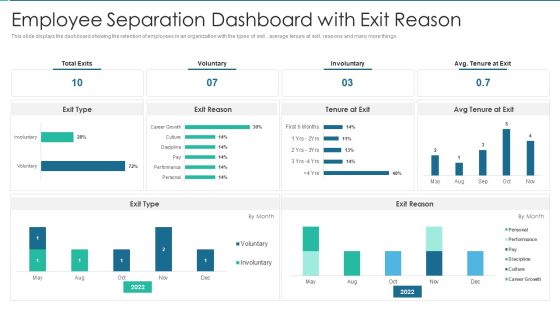
Employee Separation Dashboard With Exit Reason Rules PDF
This slide displays the dashboard showing the retention of employees in an organization with the types of exit , average tenure at exit, reasons and many more things. Pitch your topic with ease and precision using this Employee Separation Dashboard With Exit Reason Rules PDF This layout presents information on Employee Separation Dashboard With Exit Reason It is also available for immediate download and adjustment. So, changes can be made in the color, design, graphics or any other component to create a unique layout.
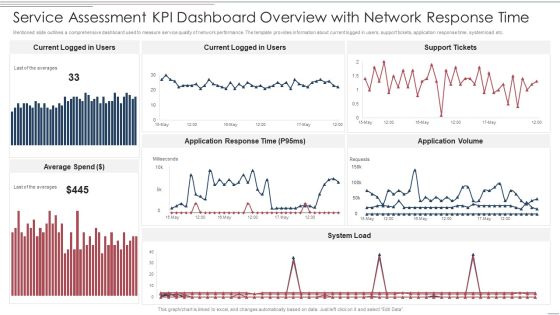
Service Assessment Kpi Dashboard Overview With Network Response Time Themes PDF
Mentioned slide outlines a comprehensive dashboard used to measure service quality of network performance. The template provides information about current logged in users, support tickets, application response time, system load etc. Pitch your topic with ease and precision using this Service Assessment Kpi Dashboard Overview With Network Response Time Themes PDF. This layout presents information on Average Spend, System Load, Application Response Time. It is also available for immediate download and adjustment. So, changes can be made in the color, design, graphics or any other component to create a unique layout.
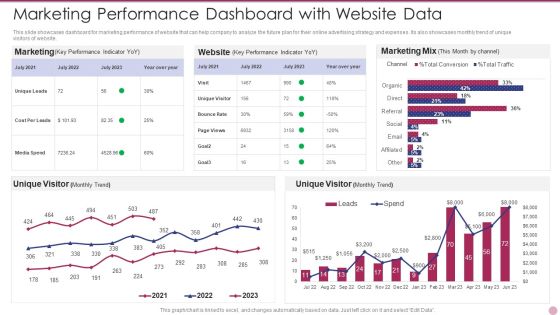
Marketing Performance Dashboard With Website Data Elements PDF
This slide showcases dashboard for marketing performance of website that can help company to analyze the future plan for their online advertising strategy and expenses. Its also showcases monthly trend of unique visitors of website. Pitch your topic with ease and precision using this Marketing Performance Dashboard With Website Data Elements PDF. This layout presents information on Marketing Performance Dashboard With Website Data. It is also available for immediate download and adjustment. So, changes can be made in the color, design, graphics or any other component to create a unique layout.
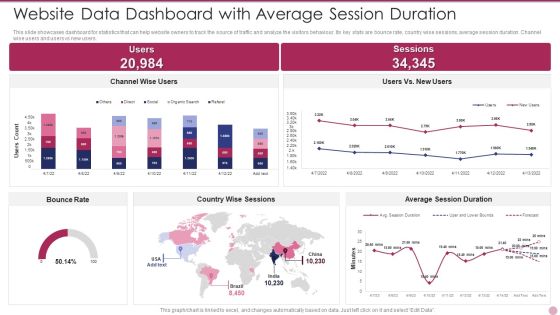
Website Data Dashboard With Average Session Duration Ideas PDF
This slide showcases dashboard for statistics that can help website owners to track the source of traffic and analyze the visitors behaviour. Its key stats are bounce rate, country wise sessions, average session duration. Channel wise users and users vs new users. Pitch your topic with ease and precision using this Website Data Dashboard With Average Session Duration Ideas PDF. This layout presents information on Website Data Dashboard With Average Session Duration. It is also available for immediate download and adjustment. So, changes can be made in the color, design, graphics or any other component to create a unique layout.

Growth Strategy For Startup Company Points Keys To Success And Financial Highlights Download PDF
This slide shows the keys to success points of the company which includes great products and services, sustainable customer loyalty, good profile of product and services, sales, gross margin net profit highlights for five years. Deliver and pitch your topic in the best possible manner with this Growth Strategy For Startup Company Points Keys To Success And Financial Highlights Download PDF. Use them to share invaluable insights on Great Product And Service, Building And Sustaining, Customer Loyalty and impress your audience. This template can be altered and modified as per your expectations. So, grab it now.
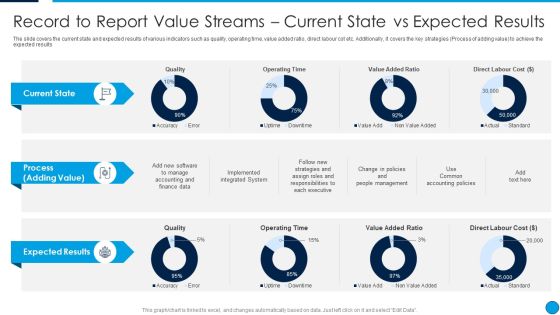
Summary Financial Record To Report Value Streams Current State Vs Expected Results Template PDF
The slide covers the current state and expected results of various indicators such as quality, operating time, value added ratio, direct labour cot etc. Additionally, it covers the key strategies Process of adding value to achieve the expected results. Deliver an awe inspiring pitch with this creative Summary Financial Record To Report Value Streams Current State Vs Expected Results Template PDF bundle. Topics like Current State, Process, Adding Value, Expected Results, Operating Time, Value Added Ratio can be discussed with this completely editable template. It is available for immediate download depending on the needs and requirements of the user.

Summary Financial Software Vendor Scan And Mini Profiles Mockup PDF
The slide provides brief business overview of a financial software vendor. Profile include details such as business overview, revenue from the software, user base the software, major industries served, key partners, major competitors etc. Deliver an awe inspiring pitch with this creative Summary Financial Software Vendor Scan And Mini Profiles Mockup PDF bundle. Topics like Major Industries Served, Key Partners, Major Competitors, 2018 To 2022 can be discussed with this completely editable template. It is available for immediate download depending on the needs and requirements of the user.

Actively Influencing Customers Dashboard For Tracking Marketing Activities At Social Guidelines PDF
This slide covers information regarding the dashboard for tracking essential marketing activities at social media platform in terms of social traffic and conversion, referral traffic by site, key social media metrics. Deliver and pitch your topic in the best possible manner with this Actively Influencing Customers Dashboard For Tracking Marketing Activities At Social Guidelines PDF. Use them to share invaluable insights on Social Events, Social Traffic And Conversion, Referral Traffic By Site, Key Social Metrics and impress your audience. This template can be altered and modified as per your expectations. So, grab it now.

Actively Influencing Customers Determine Roi From Different Marketing Platforms Professional PDF
This slide provides information regarding lead generation through various marketing platforms and determine ROI generated through these platforms such as email marketing, SEO, PPC, etc. Deliver and pitch your topic in the best possible manner with this Actively Influencing Customers Determine Roi From Different Marketing Platforms Professional PDF. Use them to share invaluable insights on Lead Generation Through Various Platforms, ROI, Social Media, PPC, SEO and impress your audience. This template can be altered and modified as per your expectations. So, grab it now.

Actively Influencing Customers Overall Impact Of Enhancing Word Of Mouth Marketing Professional PDF
The slide covers information regarding the overall impact of enhancing word of mouth marketing initiative with decrease in marketing spend and increase conversion rate and reduction in churn rate of customers. Deliver an awe inspiring pitch with this creative Actively Influencing Customers Overall Impact Of Enhancing Word Of Mouth Marketing Professional PDF bundle. Topics like Increase Conversion Rate, Decrease Marketing Spend, Quarterly Churn Rate, Customers can be discussed with this completely editable template. It is available for immediate download depending on the needs and requirements of the user.

Dashboard For Tracking Essential Marketing Activities Actively Influencing Customers Formats PDF
This slide covers information regarding the dashboard for tracking essential marketing activities in terms of total leads, email sent, sales ready leads, new customers and revenues, etc. Deliver and pitch your topic in the best possible manner with this Dashboard For Tracking Essential Marketing Activities Actively Influencing Customers Formats PDF. Use them to share invaluable insights on Total Leads, Sales Ready Leads, New Customers, New Revenue and impress your audience. This template can be altered and modified as per your expectations. So, grab it now.

Innovation Procedure For Online Business Market Scenario And Disruption In Business Diagrams PDF
The following slide illustrates market scenario and business disruption for digital transformation industry. The following slide displays the adoption rate of digital transformation, key issues in the Industry and solution for major problems in Industry. Deliver and pitch your topic in the best possible manner with this Innovation Procedure For Online Business Market Scenario And Disruption In Business Diagrams PDF Use them to share invaluable insights on Key Industries, Solution Digital Transformation, Organizations Dependent and impress your audience. This template can be altered and modified as per your expectations. So, grab it now.

Brand Revenue Comparative Analysis With Net Promoter Score Dashboard Mockup PDF
This slide illustrates graphical representation of revenue of three brands. It includes weekly revenue line graphs and net promoter score by age of customers.Pitch your topic with ease and precision using this Brand Revenue Comparative Analysis With Net Promoter Score Dashboard Mockup PDF. This layout presents information on Brand Revenue Comparative Analysis With Net Promoter Score Dashboard. It is also available for immediate download and adjustment. So, changes can be made in the color, design, graphics or any other component to create a unique layout.

Brand Development Manual Product Market Share Of The Firm Across North America Brochure PDF
Following slide displays year over year product market share of the firm alone in North America. It indicates that market share of product 1 get decreased to 22 persent in 2022 as compared to 26persent in 2021.Deliver and pitch your topic in the best possible manner with this Brand Development Manual Product Market Share Of The Firm Across North America Brochure PDF Use them to share invaluable insights on Product Market Share Of The Firm Across North America and impress your audience. This template can be altered and modified as per your expectations. So, grab it now.
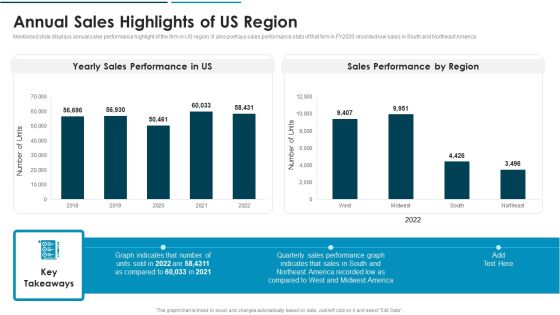
Go To Market Approach For New Product Annual Sales Highlights Of US Region Elements PDF
Mentioned slide displays annual sales performance highlight of the firm in US region. It also portrays sales performance stats of that firm in FY2020 recorded low sales in South and Northeast America. Deliver and pitch your topic in the best possible manner with this Go To Market Approach For New Product Annual Sales Highlights Of US Region Elements PDF Use them to share invaluable insights on Annual Sales Highlights Of Us Region and impress your audience. This template can be altered and modified as per your expectations. So, grab it now.

Go To Market Approach For New Product Dashboard To Measure Sales Rep Performance Formats PDF
This slide illustrates sales representative performance measurement dashboard with key metrics such as average first contact resolution rate, occupancy rate, NPS and top agents by solved tickets.Deliver and pitch your topic in the best possible manner with this Go To Market Approach For New Product Dashboard To Measure Sales Rep Performance Formats PDF Use them to share invaluable insights on Dashboard To Measure Sales Rep Performance and impress your audience. This template can be altered and modified as per your expectations. So, grab it now.
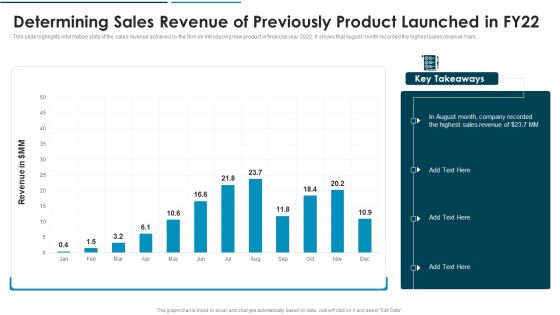
Go To Market Approach For New Product Product Launched In FY22 Inspiration PDF
This slide highlights information stats of the sales revenue achieved by the firm on introducing new product in financial year 2022. It shows that August month recorded the highest sales revenue mark.Deliver and pitch your topic in the best possible manner with this Go To Market Approach For New Product Product Launched In FY22 Inspiration PDF Use them to share invaluable insights on Determining Sales Revenue Of Previously Product Launched In Fy22 and impress your audience. This template can be altered and modified as per your expectations. So, grab it now.
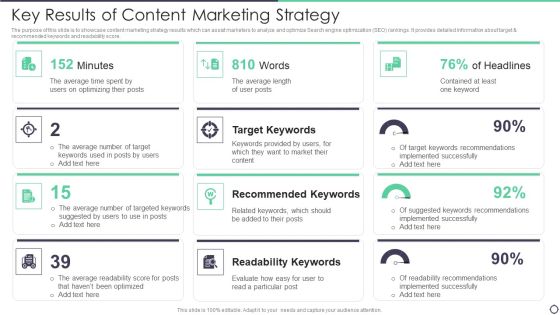
Key Results Of Content Marketing Strategy Background PDF
The purpose of this slide is to showcase content marketing strategy results which can assist marketers to analyze and optimize Search engine optimization SEO rankings. It provides detailed information about target and recommended keywords and readability score. Pitch your topic with ease and precision using this Key Results Of Content Marketing Strategy Background PDF. This layout presents information on Average, Target Keywords, Readability Keywords. It is also available for immediate download and adjustment. So, changes can be made in the color, design, graphics or any other component to create a unique layout.

Marketing Kpi Dashboard Showing Campaign Outcomes Pictures PDF
The purpose of this slide is to outline KPI dashboard of various results generated from marketing campaign. The results highlighted in the slide are total visits, average session duration, bounce rate, traffic sources, top channels by conversion etc. Pitch your topic with ease and precision using this Marketing Kpi Dashboard Showing Campaign Outcomes Pictures PDF. This layout presents information on Marketing Kpi Dashboard Showing Campaign Outcomes. It is also available for immediate download and adjustment. So, changes can be made in the color, design, graphics or any other component to create a unique layout.
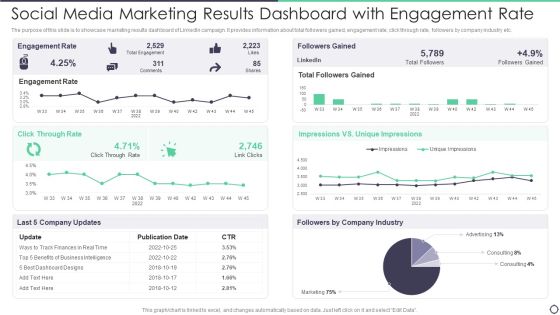
Social Media Marketing Results Dashboard With Engagement Rate Brochure PDF
The purpose of this slide is to showcase marketing results dashboard of LinkedIn campaign. It provides information about total followers gained, engagement rate, click through rate, followers by company industry etc. Pitch your topic with ease and precision using this Social Media Marketing Results Dashboard With Engagement Rate Brochure PDF. This layout presents information on Social Media Marketing Results Dashboard With Engagement Rate. It is also available for immediate download and adjustment. So, changes can be made in the color, design, graphics or any other component to create a unique layout.

Market Summary For Ecommerce Website With Conversion Rate Diagrams PDF
The mentioned slide highlights the highlights the market report for ecommerce website which includes the monthly shoppers and bounce rate with top marketing campaigns. Pitch your topic with ease and precision using this Market Summary For Ecommerce Website With Conversion Rate Diagrams PDF. This layout presents information on Market Summary For Ecommerce Website With Conversion Rate. It is also available for immediate download and adjustment. So, changes can be made in the color, design, graphics or any other component to create a unique layout.

What Is Missing In Our Marketing Promotion Guide To Advertise Brand On Youtube Structure PDF
This slide highlights the statistics of YouTube with other social media channels which showcases average time on site, average page per visit and average bounce of sites with google plas and LinkedIn.Deliver an awe inspiring pitch with this creative What Is Missing In Our Marketing Promotion Guide To Advertise Brand On Youtube Structure PDF bundle. Topics like What Is Missing In Our Marketing can be discussed with this completely editable template. It is available for immediate download depending on the needs and requirements of the user.

Deploying Quality Assurance QA Transformation Average Product Delivery Time In Absence Of Effective Icons PDF
This slide shows details about the increasing Final Product Delivery Time in the past 5 years. The average delivery time is constantly increasing due to absence of advanced software testing techniques leading to increased bug rate in the product. Hence, leading to increased time in delivering the final product.Deliver an awe inspiring pitch with this creative Deploying Quality Assurance QA Transformation Average Product Delivery Time In Absence Of Effective Icons PDF bundle. Topics like Average Product Delivery Time In Absence Of Effective QA Transformation Techniques can be discussed with this completely editable template. It is available for immediate download depending on the needs and requirements of the user.

Deploying Quality Assurance QA Transformation Current Active Defect Rate In Absence Of Effective Slides PDF
This slide shows details about the increasing Product Defect Rate in the past 5 years. The defect rate is constantly increasing due to absence of effective QA Transformation Techniques in the company. Deliver and pitch your topic in the best possible manner with this Deploying Quality Assurance QA Transformation Current Active Defect Rate In Absence Of Effective Slides PDF Use them to share invaluable insights on Current Active Defect Rate In Absence Of Effective QA Transformation Techniques and impress your audience. This template can be altered and modified as per your expectations. So, grab it now.
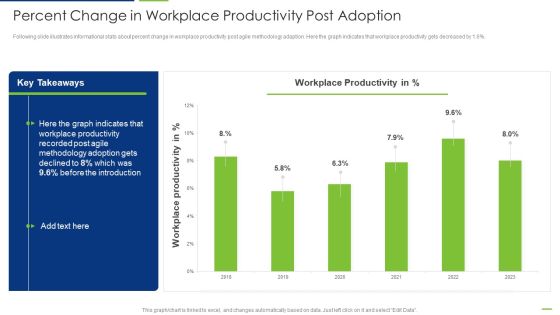
Professional Scrum Master Percent Change In Workplace Productivity Post Adoption Summary PDF
Following slide illustrates informational stats about percent change in workplace productivity post agile methodology adaption. Here the graph indicates that workplace productivity gets decreased by 1.6 percent. Deliver and pitch your topic in the best possible manner with this Professional Scrum Master Percent Change In Workplace Productivity Post Adoption Summary PDF. Use them to share invaluable insights on Workplace Productivity, 2018 To 2023, Agile Methodology and impress your audience. This template can be altered and modified as per your expectations. So, grab it now.
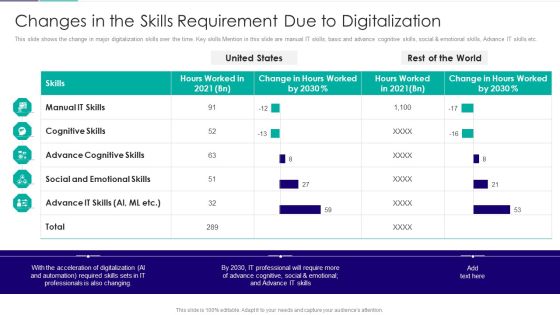
Role Of Technical Competence In Organizational Changes In The Skills Requirement Information PDF
This slide shows the change in major digitalization skills over the time. Key skills Mention in this slide are manual IT skills, basic and advance cognitive skills, social and emotional skills, Advance IT skills etc.Deliver an awe inspiring pitch with this creative Role Of Technical Competence In Organizational Changes In The Skills Requirement Information PDF bundle. Topics like Changes In The Skills Requirement Due To Digitalization can be discussed with this completely editable template. It is available for immediate download depending on the needs and requirements of the user.
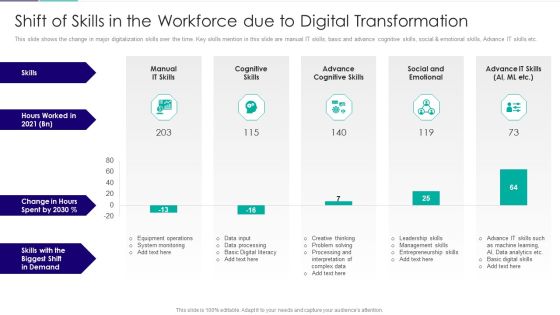
Role Of Technical Competence In Organizational Shift Of Skills In The Workforce Due To Digital Sample PDF
This slide shows the change in major digitalization skills over the time. Key skills mention in this slide are manual IT skills, basic and advance cognitive skills, social and emotional skills, Advance IT skills etc. Deliver an awe inspiring pitch with this creative Role Of Technical Competence In Organizational Shift Of Skills In The Workforce Due To Digital Sample PDF bundle. Topics like Advance Cognitive Skills, Social And Emotional, Cognitive Skills can be discussed with this completely editable template. It is available for immediate download depending on the needs and requirements of the user.

Vendor Scan And Ranking For BI Software BI Transformation Toolset Guidelines PDF
The following slide illustrates the results of the market scan performed to identify key vendors of business intelligence suite. It also contains information regarding vendor scoring and the unique selling proposition. Deliver and pitch your topic in the best possible manner with this Vendor Scan And Ranking For BI Software BI Transformation Toolset Guidelines PDF. Use them to share invaluable insights on Vendor Scan And Ranking For BI Software and impress your audience. This template can be altered and modified as per your expectations. So, grab it now.
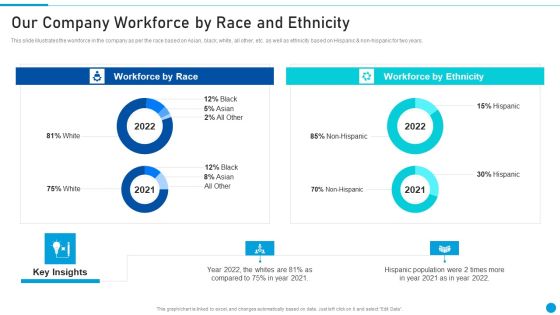
Embed Diversity And Inclusion Our Company Workforce By Race And Ethnicity Slides PDF
This slide illustrates the workforce in the company as per the race based on Asian, black, white, all other, etc. as well as ethnicity based on Hispanic and non-hispanic for two years. Deliver and pitch your topic in the best possible manner with this Embed Diversity And Inclusion Our Company Workforce By Race And Ethnicity Slides PDF. Use them to share invaluable insights on Workforce By Race, Workforce By Ethnicity and impress your audience. This template can be altered and modified as per your expectations. So, grab it now.

Survey Results Of Obstacles Faced By Team Members Due To Diverse Groups At Work Template PDF
This slide illustrates the survey results conducted within the company showing how the team members are getting affected due to diversity and inclusion at the company. Deliver and pitch your topic in the best possible manner with this Survey Results Of Obstacles Faced By Team Members Due To Diverse Groups At Work Template PDF. Use them to share invaluable insights on Racially, Ethically Diverse, Women, Lgbtq, Recruitment, Retention, Advancement, Leadership Commitment and impress your audience. This template can be altered and modified as per your expectations. So, grab it now.
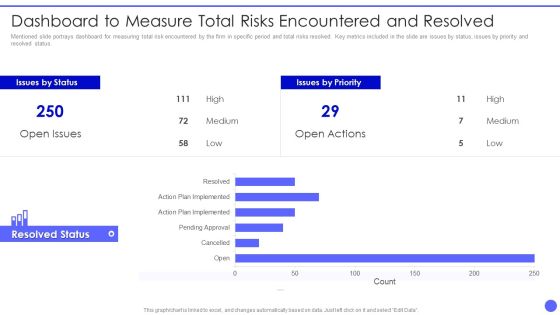
Info Safety And ISO 27001 Dashboard To Measure Total Risks Encountered Slides PDF
Mentioned slide portrays dashboard for measuring total risk encountered by the firm in specific period and total risks resolved. Key metrics included in the slide are issues by status, issues by priority and resolved status. Deliver an awe inspiring pitch with this creative Info Safety And ISO 27001 Dashboard To Measure Total Risks Encountered Slides PDF bundle. Topics like Issues by Status, Resolved Status, High, Medium, Low can be discussed with this completely editable template. It is available for immediate download depending on the needs and requirements of the user.
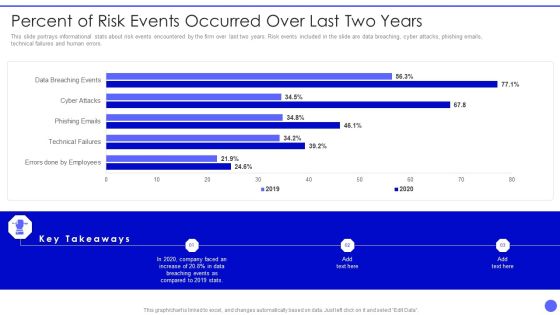
Info Safety And ISO 27001 Percent Of Risk Events Occurred Over Last Two Years Clipart PDF
This slide portrays informational stats about risk events encountered by the firm over last two years. Risk events included in the slide are data breaching, cyber attacks, phishing emails, technical failures and human errors. Deliver an awe inspiring pitch with this creative Info Safety And ISO 27001 Percent Of Risk Events Occurred Over Last Two Years Clipart PDF bundle. Topics like Errors Done By Employees, Technical Failures, Phishing Emails, Cyber Attacks can be discussed with this completely editable template. It is available for immediate download depending on the needs and requirements of the user.
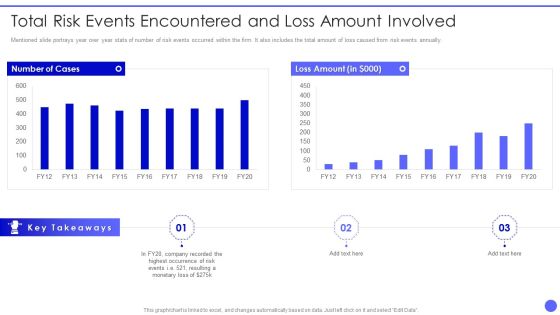
Info Safety And ISO 27001 Total Risk Events Encountered And Loss Amount Involved Clipart PDF
Mentioned slide portrays year over year stats of number of risk events occurred within the firm. It also includes the total amount of loss caused from risk events annually. Deliver and pitch your topic in the best possible manner with this Info Safety And ISO 27001 Total Risk Events Encountered And Loss Amount Involved Clipart PDF. Use them to share invaluable insights on Number Cases, Loss Amount, Highest Occurrence, Risk Events and impress your audience. This template can be altered and modified as per your expectations. So, grab it now.

Business To Business Account B2B Sales Representatives Performance Tracking Dashboard Demonstration PDF
This slide provides information regarding B2B sales representatives performance tracking dashboard to measure leads by region, revenue breakdown, top performers by leads, revenues, etc. Deliver and pitch your topic in the best possible manner with this Business To Business Account B2B Sales Representatives Performance Tracking Dashboard Demonstration PDF. Use them to share invaluable insights on Top 5 Sales Reps By Revenue Pace, Top 5 Sales Reps By Revenue, Top 5 Sales Reps By Leads and impress your audience. This template can be altered and modified as per your expectations. So, grab it now.
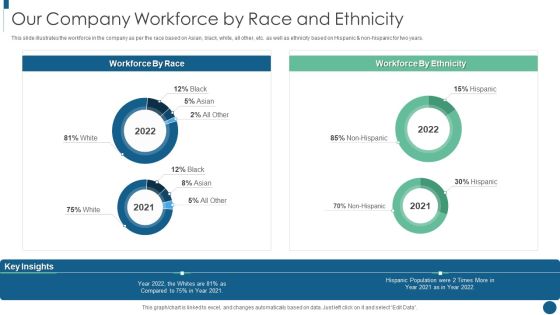
Developing Inclusive And Diversified Our Company Workforce By Race And Ethnicity Mockup PDF
This slide illustrates the workforce in the company as per the race based on Asian, black, white, all other, etc. as well as ethnicity based on Hispanic and non-hispanic for two years. Deliver and pitch your topic in the best possible manner with this Developing Inclusive And Diversified Our Company Workforce By Race And Ethnicity Mockup PDF. Use them to share invaluable insights on Workforce By Race, Workforce By Ethnicity and impress your audience. This template can be altered and modified as per your expectations. So, grab it now.

Defined Sales Assistance For Business Clients Key Statistics Related To B2B Buyer Purchase Pattern Portrait PDF
This slide provides information regarding statistics related to B2B buyer purchase pattern in terms of completion of buying journey, average people involved in buying decision, preference of social media platforms by B2B buyer.Deliver and pitch your topic in the best possible manner with this Defined Sales Assistance For Business Clients Key Statistics Related To B2B Buyer Purchase Pattern Portrait PDF Use them to share invaluable insights on Involvement Of Sales Representative, Reach Out To Vendors, Customized Offers And Experience and impress your audience. This template can be altered and modified as per your expectations. So, grab it now.

Business Buyers Have Higher Expectations As B2C Consumers Introduction PDF
This slide provides information regarding characteristic of B2B buyer as having higher expectations as similar to B2C consumers while making buying decisions and expects firms response and interaction in real time. Deliver and pitch your topic in the best possible manner with this Business Buyers Have Higher Expectations As B2C Consumers Introduction PDF Use them to share invaluable insights on Consumers Expect, Response And Interaction, Render Customized Recommendations and impress your audience. This template can be altered and modified as per your expectations. So, grab it now.

Positive Impact Post Social Media Engagement To Increase Customer Engagement Infographics PDF
This slide shows major impact post implementing social media strategy for improved engagement. It provides information about organic reach, lead generation, average share per post, new page likes and followers, etc. Deliver an awe inspiring pitch with this creative Positive Impact Post Social Media Engagement To Increase Customer Engagement Infographics PDF bundle. Topics like Positive Impact Post Successful Implementation Of Social Media Engagement Strategy can be discussed with this completely editable template. It is available for immediate download depending on the needs and requirements of the user.
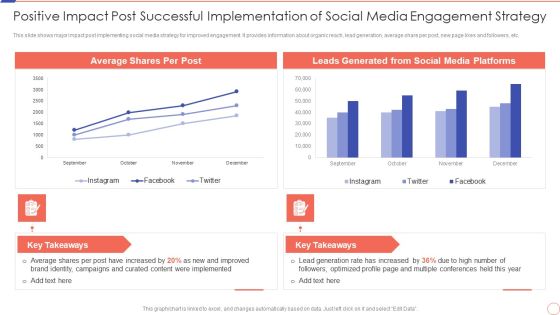
Positive Impact Post Successful Social Media Engagement To Increase Customer Engagement Rules PDF
This slide shows major impact post implementing social media strategy for improved engagement. It provides information about organic reach, lead generation, average share per post, new page likes and followers, etc. Deliver and pitch your topic in the best possible manner with this Positive Impact Post Successful Social Media Engagement To Increase Customer Engagement Rules PDF. Use them to share invaluable insights on Positive Impact Post Successful Implementation Of Social Media Engagement Strategy and impress your audience. This template can be altered and modified as per your expectations. So, grab it now.
Social Media Engagement To Increase Customer Engagement Companys Existing Social Media Engagement Icons PDF
This slide depicts current social media engagement performance of organization. It includes information about organic reach, average shares per post, new likes and followers and leads generated from social media platforms. Deliver an awe inspiring pitch with this creative Social Media Engagement To Increase Customer Engagement Companys Existing Social Media Engagement Icons PDF bundle. Topics like Companys Existing Social Media Engagement Scenario can be discussed with this completely editable template. It is available for immediate download depending on the needs and requirements of the user.
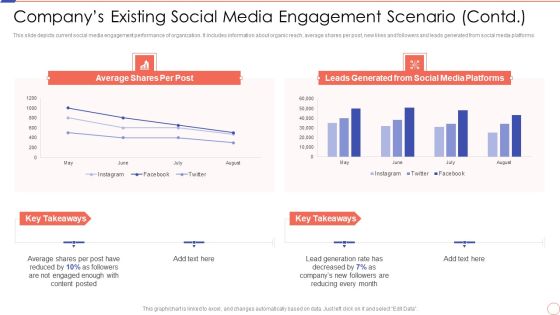
Social Media Engagement To Increase Customer Engagement Companys Existing Social Media Microsoft PDF
This slide depicts current social media engagement performance of organization. It includes information about organic reach, average shares per post, new likes and followers and leads generated from social media platforms. Deliver and pitch your topic in the best possible manner with this Social Media Engagement To Increase Customer Engagement Companys Existing Social Media Microsoft PDF. Use them to share invaluable insights on Companys Existing Social Media Engagement Scenario Contd and impress your audience. This template can be altered and modified as per your expectations. So, grab it now.

Social Media Engagement To Increase Customer Engagement Hosting Virtual Social Media Conferences Demonstration PDF
This slide depicts conducting virtual social media sessions for increasing customer engagement. It provides information about social network, webinar, live, hosts, date, time, loyalty, lead generation, brand awareness, etc. Deliver and pitch your topic in the best possible manner with this Social Media Engagement To Increase Customer Engagement Hosting Virtual Social Media Conferences Demonstration PDF. Use them to share invaluable insights on Social Network, Marketing, Benefits, Customer, Desired Outcome and impress your audience. This template can be altered and modified as per your expectations. So, grab it now.
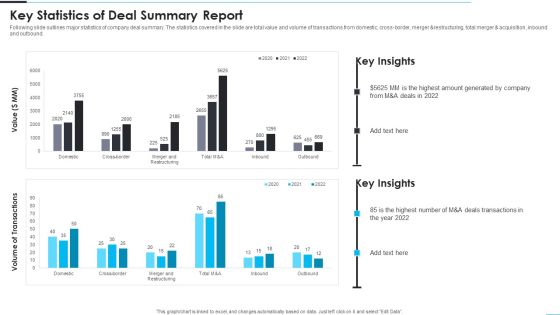
Key Statistics Of Deal Summary Report Formats PDF
Following slide outlines major statistics of company deal summary. The statistics covered in the slide are total value and volume of transactions from domestic, cross-border, merger and restructuring, total merger and acquisition, inbound and outbound. Pitch your topic with ease and precision using this Key Statistics Of Deal Summary Report Formats PDF. This layout presents information on Key Statistics Of Deal Summary Report. It is also available for immediate download and adjustment. So, changes can be made in the color, design, graphics or any other component to create a unique layout.

Real Time Analytics Dashboard To Measure Marketing Campaign Performance Information PDF
The purpose of this slide is to outline analytics dashboard to evaluate the success rate of marketing campaign performance. It provides information about metrics such as clicks, impressions, spend, conversions, site audit score, audience growth, etc. Pitch your topic with ease and precision using this Real Time Analytics Dashboard To Measure Marketing Campaign Performance Information PDF. This layout presents information on Real Time Analytics Dashboard To Measure Marketing Campaign Performance. It is also available for immediate download and adjustment. So, changes can be made in the color, design, graphics or any other component to create a unique layout.

Smartphone App Installation Metrics Dashboard With User Sessions Microsoft PDF
This slide showcases dashboard that can help organization to identify the installation trend of mobile application and formulate strategies in case of declining downloads. Its key components are installs trend, total installs, total sessions and total media source breakdown by revenue. Pitch your topic with ease and precision using this Smartphone App Installation Metrics Dashboard With User Sessions Microsoft PDF. This layout presents information on Smartphone App Installation Metrics Dashboard With User Sessions. It is also available for immediate download and adjustment. So, changes can be made in the color, design, graphics or any other component to create a unique layout.

Current Potential Implications Faced By Firm Intelligent Infrastructure Rules PDF
This slide provides information regarding the potential implications or concerns existing in firm in terms of increase in issues related to employees such as lack of expertise, ineffectiveness in handling issues, reported financial losses due to financial threats and data breaches with records exposed. Deliver an awe inspiring pitch with this creative Current Potential Implications Faced By Firm Intelligent Infrastructure Rules PDF bundle. Topics like Issues Related To Employees, Reported Financial Losses, Due To Increase Security Threats, Data Breaches And can be discussed with this completely editable template. It is available for immediate download depending on the needs and requirements of the user.

Bar Graph Representing Macroeconomic Analysis Employment Change By Industry Background PDF
This slide focuses on the graphical presentation of macroeconomic indicator such as employment rate of different industries which includes service providing and goods producing industries which includes healthcare and social assistance, construction, manufacturing industry, etc. Pitch your topic with ease and precision using this Bar Graph Representing Macroeconomic Analysis Employment Change By Industry Background PDF. This layout presents information on Goods Producing, Service Providing, Financial, Business. It is also available for immediate download and adjustment. So, changes can be made in the color, design, graphics or any other component to create a unique layout.

Dashboard Depicting Macroeconomic Analysis With Population Inspiration PDF
This slide shows the dashboard that depicts the macroeconomic analysis which includes population, gross domestic product, GDP per capita, poverty rate, literacy rate verses internet usage of four different countries and FDI inflow, etc. Pitch your topic with ease and precision using this Dashboard Depicting Macroeconomic Analysis With Population Inspiration PDF. This layout presents information on Poverty Rate, Literacy Rate Vs Internet Usages, FDI Inflow In 2022. It is also available for immediate download and adjustment. So, changes can be made in the color, design, graphics or any other component to create a unique layout.
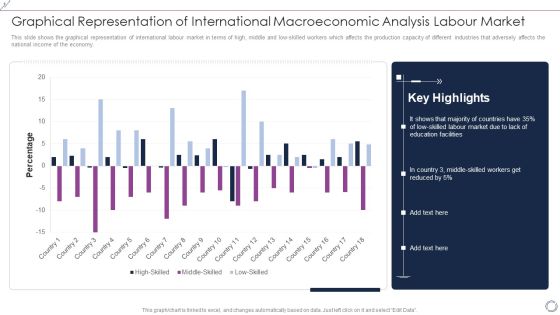
Graphical Representation Of International Macroeconomic Analysis Labour Market Diagrams PDF
This slide shows the graphical representation of international labour market in terms of high, middle and low-skilled workers which affects the production capacity of different industries that adversely affects the national income of the economy. Pitch your topic with ease and precision using this Graphical Representation Of International Macroeconomic Analysis Labour Market Diagrams PDF. This layout presents information on High Skilled, Middle Skilled, Low Skilled. It is also available for immediate download and adjustment. So, changes can be made in the color, design, graphics or any other component to create a unique layout.
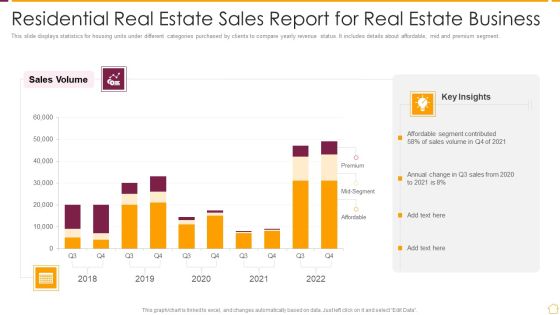
Residential Real Estate Sales Report For Real Estate Business Ppt PowerPoint Presentation File Master Slide PDF
This slide displays statistics for housing units under different categories purchased by clients to compare yearly revenue status. It includes details about affordable, mid and premium segment. Pitch your topic with ease and precision using this Residential Real Estate Sales Report For Real Estate Business Ppt PowerPoint Presentation File Master Slide PDF. This layout presents information on Affordable Segment Contributed, Sales Volume, 2018 To 2022. It is also available for immediate download and adjustment. So, changes can be made in the color, design, graphics or any other component to create a unique layout.
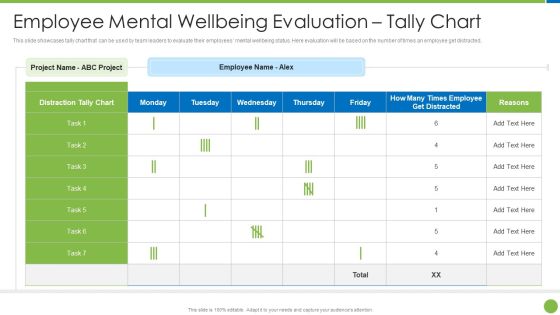
Playbook For Staff Wellbeing Employee Mental Wellbeing Evaluation Tally Chart Pictures PDF
This slide showcases tally chart that can be used by team leaders to evaluate their employees mental wellbeing status. Here evaluation will be based on the number of times an employee get distracted.Deliver an awe inspiring pitch with this creative Playbook For Staff Wellbeing Employee Mental Wellbeing Evaluation Tally Chart Pictures PDF bundle. Topics like Employee Mental Wellbeing Evaluation Tally Chart can be discussed with this completely editable template. It is available for immediate download depending on the needs and requirements of the user.
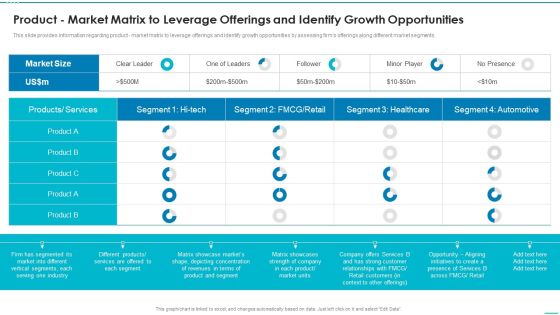
Playbook For Strategic Action Planning Product Market Matrix To Leverage Offerings Topics PDF
This slide provides information regarding product market matrix to leverage offerings and identify growth opportunities by assessing firms offerings along different market segments. Deliver and pitch your topic in the best possible manner with this Playbook For Strategic Action Planning Product Market Matrix To Leverage Offerings Topics PDF Use them to share invaluable insights on Product Market Matrix To Leverage Offerings And Identify Growth Opportunities and impress your audience. This template can be altered and modified as per your expectations. So, grab it now.

Location And Navigation Smartphones Usage Statistics In Usa Demonstration PDF
This slide shows the key statistics about in the smartphone usage in USA. Here the graph indicates that in USA, an increase of 20 percent is recorded in terms of smartphones usage. Deliver an awe inspiring pitch with this creative Location And Navigation Smartphones Usage Statistics In Usa Demonstration PDF bundle. Topics like Location Based Recommendations, Listen to Online Music, Participate In a Video Chat can be discussed with this completely editable template. It is available for immediate download depending on the needs and requirements of the user.

Location Based Services Market Statistics Location And Navigation Topics PDF
Purpose of this slide is to address the key statistics on location based services LBS market. It provide details about the service awareness, usage and concerns of consumers. Deliver and pitch your topic in the best possible manner with this Location Based Services Market Statistics Location And Navigation Topics PDF. Use them to share invaluable insights on Location Based Services, Provide Services, Current Location Organization and impress your audience. This template can be altered and modified as per your expectations. So, grab it now.
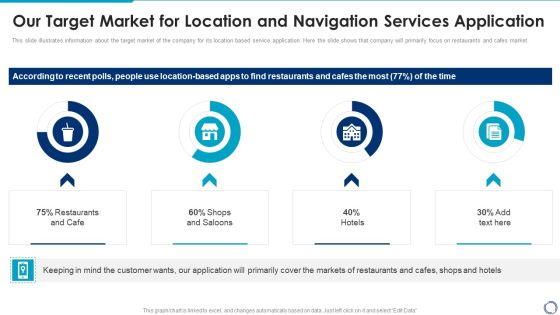
Our Target Market For Location And Navigation Services Application Topics PDF
This slide illustrates information about the target market of the company for its location based service application. Here the slide shows that company will primarily focus on restaurants and cafes market. Deliver an awe inspiring pitch with this creative Our Target Market For Location And Navigation Services Application Topics PDF bundle. Topics like Our Target Market, Location And Navigation, Services Application can be discussed with this completely editable template. It is available for immediate download depending on the needs and requirements of the user.
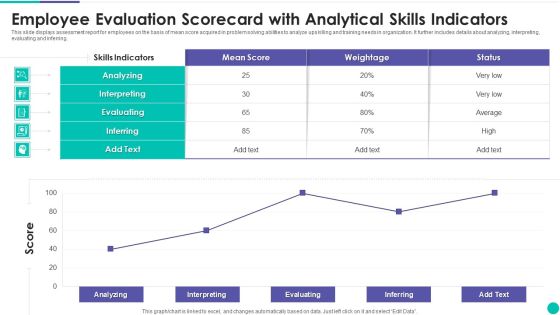
Employee Evaluation Scorecard With Analytical Skills Indicators Clipart PDF
This slide displays assessment report for employees on the basis of mean score acquired in problem solving abilities to analyze upskilling and training needs in organization. It further includes details about analyzing, interpreting, evaluating and inferring. Pitch your topic with ease and precision using this Employee Evaluation Scorecard With Analytical Skills Indicators Clipart PDF. This layout presents information on Analyzing, Interpreting, Evaluating. It is also available for immediate download and adjustment. So, changes can be made in the color, design, graphics or any other component to create a unique layout.
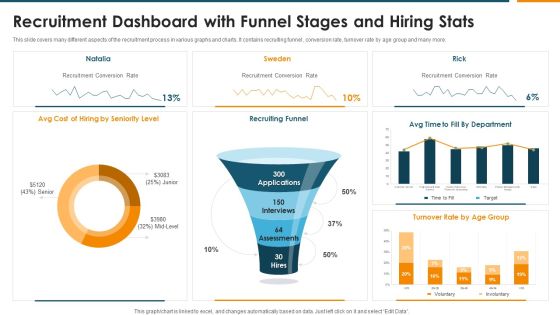
Recruitment Dashboard With Funnel Stages And Hiring Stats Rules PDF
This slide covers many different aspects of the recruitment process in various graphs and charts. It contains recruiting funnel , conversion rate, turnover rate by age group and many more. Pitch your topic with ease and precision using this Recruitment Dashboard With Funnel Stages And Hiring Stats Rules PDF. This layout presents information on Recruiting Funnel, Recruitment Conversion Rate, Seniority Level. It is also available for immediate download and adjustment. So, changes can be made in the color, design, graphics or any other component to create a unique layout.


 Continue with Email

 Home
Home


