Project Funding

Information Technology Solutions Business Profile Comparison Based On Market Share Rules PDF
This slide represents the comparison with competitors based on market share which shows our leading company with greatest share in market due to various reasons such as delivery of cost-effective support, latest technologies, etc. Deliver and pitch your topic in the best possible manner with this Information Technology Solutions Business Profile Comparison Based On Market Share Rules PDF. Use them to share invaluable insights on Leading Highest, Among Competitors, Behind Success and impress your audience. This template can be altered and modified as per your expectations. So, grab it now.
Information Technology Solutions Business Profile Net Profit And Margin Analysis Microsoft PDF
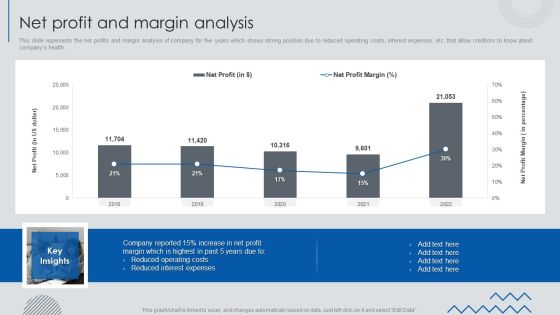
This slide represents the net profits and margin analysis of company for five years which shows strong position due to reduced operating costs, interest expenses, etc. that allow creditors to know about companys health.Deliver an awe inspiring pitch with this creative Information Technology Solutions Business Profile Net Profit And Margin Analysis Microsoft PDF bundle. Topics like Company Reported, Reduced Operating, Reduced Interest can be discussed with this completely editable template. It is available for immediate download depending on the needs and requirements of the user.

Information Technology Solutions Business Profile Research And Development R And D Expenses Information PDF
This slide shows the research and development expenses incurred by our company in last five years in various areas such as technological change, software testing, etc. to improve productivity and reduce additional costs.Deliver an awe inspiring pitch with this creative Information Technology Solutions Business Profile Research And Development R And D Expenses Information PDF bundle. Topics like Improving Technological, Competitive Market, New Technologies can be discussed with this completely editable template. It is available for immediate download depending on the needs and requirements of the user.

Small Business Venture Company Profile Comparison Based On Market Share Summary PDF
This slide represents the comparison with competitors based on market share which shows our leading company with greatest share in market due to various reasons such as delivery of cost-effective support, latest technologies, etc. Deliver and pitch your topic in the best possible manner with this Small Business Venture Company Profile Comparison Based On Market Share Summary PDF. Use them to share invaluable insights on Among Competitors, Technologies And Solutions, Technical Assistance and impress your audience. This template can be altered and modified as per your expectations. So, grab it now.

Small Business Venture Company Profile Net Profit And Margin Analysis Information PDF
This slide represents the net profits and margin analysis of company for five years which shows strong position due to reduced operating costs, interest expenses, etc. that allow creditors to know about companys health.Deliver an awe inspiring pitch with this creative Small Business Venture Company Profile Net Profit And Margin Analysis Information PDF bundle. Topics like Increase Profit, Highest In Past , Reduced Interest can be discussed with this completely editable template. It is available for immediate download depending on the needs and requirements of the user.
Small Business Venture Company Profile Research And Development R And D Expenses Mockup PDF
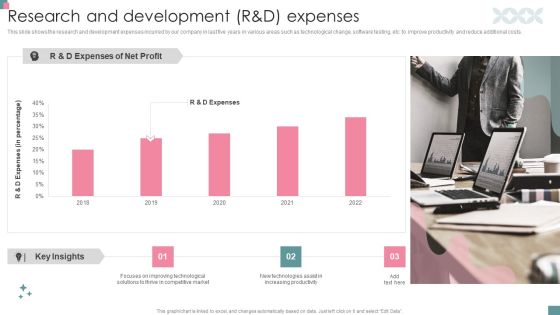
This slide shows the research and development expenses incurred by our company in last five years in various areas such as technological change, software testing, etc. to improve productivity and reduce additional costs.Deliver an awe inspiring pitch with this creative Small Business Venture Company Profile Research And Development R And D Expenses Mockup PDF bundle. Topics like Key Insights, Increasing Productivity, Improving Technological can be discussed with this completely editable template. It is available for immediate download depending on the needs and requirements of the user.

Logistics KPI Status Dashboard With Monthly KPI Ppt Infographic Template Layout PDF
The following slide highlights the transportation status dashboard with monthly KPI illustrating order status with customer, order date and delivery date. It shows financial performance for four quarters as well as todays order, inventory and monthly KPI with Inventory, shipping cost for past 30 days. Pitch your topic with ease and precision using this Logistics KPI Status Dashboard With Monthly KPI Ppt Infographic Template Layout PDF. This layout presents information on Order Status, Today Order, Inventory, Monthly KPI. It is also available for immediate download and adjustment. So, changes can be made in the color, design, graphics or any other component to create a unique layout.
IT Consultancy Services Company Profile Comparison Based On Market Share Ideas PDF
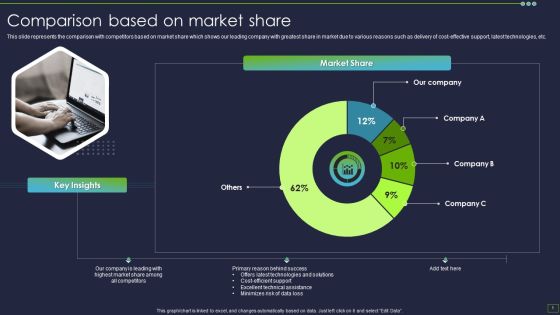
This slide represents the comparison with competitors based on market share which shows our leading company with greatest share in market due to various reasons such as delivery of cost-effective support, latest technologies, etc. Deliver and pitch your topic in the best possible manner with this IT Consultancy Services Company Profile Comparison Based On Market Share Ideas PDF. Use them to share invaluable insights on Market Share, Key Insights, Primary Reason and impress your audience. This template can be altered and modified as per your expectations. So, grab it now.

IT Consultancy Services Company Profile Net Profit And Margin Analysis Sample PDF
This slide represents the net profits and margin analysis of company for five years which shows strong position due to reduced operating costs, interest expenses, etc. that allow creditors to know about companys health.Deliver and pitch your topic in the best possible manner with this IT Consultancy Services Company Profile Net Profit And Margin Analysis Sample PDF. Use them to share invaluable insights on Key Insights, Company Reported, Reduced Operating and impress your audience. This template can be altered and modified as per your expectations. So, grab it now.

IT Consultancy Services Company Profile Research And Development Randd Expenses Diagrams PDF
This slide shows the research and development expenses incurred by our company in last five years in various areas such as technological change, software testing, etc. to improve productivity and reduce additional costs.Deliver an awe inspiring pitch with this creative IT Consultancy Services Company Profile Research And Development Randd Expenses Diagrams PDF bundle. Topics like Focuses Improving, Technological Solutions, Competitive Market can be discussed with this completely editable template. It is available for immediate download depending on the needs and requirements of the user.
End User Computing Effects Of End User Computing On The Business Post Implementation Introduction PDF
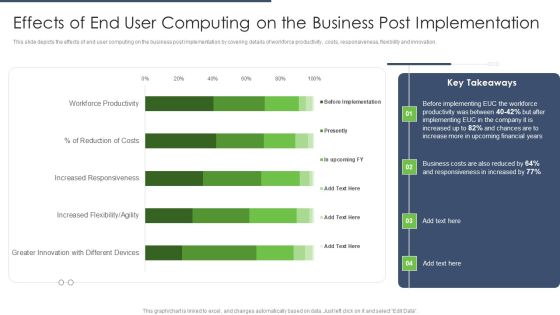
This slide depicts the effects of end user computing on the business post implementation by covering details of workforce productivity, costs, responsiveness, flexibility and innovation.Deliver and pitch your topic in the best possible manner with this End User Computing Effects Of End User Computing On The Business Post Implementation Introduction PDF. Use them to share invaluable insights on Greater Innovation, Different Devices, Increased Flexibility, Increased Responsiveness and impress your audience. This template can be altered and modified as per your expectations. So, grab it now.

Impact Of Enhanced Recruitment And Selection Process Introduction PDF
This slide shows the impact of enhanced recruitment and selection process on cost per hire, offer acceptance rate, quality of hire and applicant satisfaction that will helps company to recruit best talent.Deliver and pitch your topic in the best possible manner with this Impact Of Enhanced Recruitment And Selection Process Introduction PDF. Use them to share invaluable insights on Company Expected, Candidate Assessment, Collection Of Candidates and impress your audience. This template can be altered and modified as per your expectations. So, grab it now.

Key Issues Associated With Employment Process Microsoft PDF
This slide shows the key issues associated with current employment process which includes increase in employee attrition rate and cost per hire due to multiple reasons such as outdated recruitment methods, high agency fees, etc.Deliver and pitch your topic in the best possible manner with this Key Issues Associated With Employment Process Microsoft PDF. Use them to share invaluable insights on Outdated Recruitment, Employee Onboarding, Company Experiencing and impress your audience. This template can be altered and modified as per your expectations. So, grab it now.
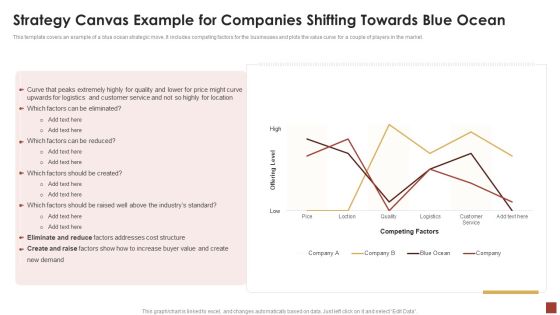
Strategical And Tactical Planning Strategy Canvas Example For Companies Shifting Towards Blue Ocean Themes PDF
This template covers an example of a blue ocean strategic move. It includes competing factors for the businesses and plots the value curve for a couple of players in the market. Deliver an awe inspiring pitch with this creative Strategical And Tactical Planning Strategy Canvas Example For Companies Shifting Towards Blue Ocean Themes PDF bundle. Topics like Eliminate And Reduce, Cost Structure, Offering Level can be discussed with this completely editable template. It is available for immediate download depending on the needs and requirements of the user.

Supply Chain Approaches Dashboard Depicting Supply Chain Metrics Background PDF
This slide shows the dashboard that depicts supply chain metrics such as total net sales, supply chain expenses, average cash to cash cycle in days, carrying costs of inventory, etc.Deliver and pitch your topic in the best possible manner with this Supply Chain Approaches Dashboard Depicting Supply Chain Metrics Background PDF. Use them to share invaluable insights on Supply Chain, Expenses Based Category, Chain Expenses and impress your audience. This template can be altered and modified as per your expectations. So, grab it now.

Online Marketing Activities KPI Dashboard To Improve Sales Ideas PDF
This slide covers online marketing dashboard to improve sales. It involves details such as web performance, conversion funnel, revenue this month, traffic sources and number of followers on social media.Pitch your topic with ease and precision using this Online Marketing Activities KPI Dashboard To Improve Sales Ideas PDF. This layout presents information on Email Performance, Web Performance, Cost Conversion. It is also available for immediate download and adjustment. So, changes can be made in the color, design, graphics or any other component to create a unique layout.

Global Automobile Sector Overview Electric Vehicle Sales Growth In California And The US Slides PDF
This slide covers a graphical representation of EV sales in the United States and California. It also includes key insights about Californias 2022 Q1 sales in comparison to 2021 Q4, increased fuel costs and large super bowl EV ad, etc. Deliver and pitch your topic in the best possible manner with this Global Automobile Sector Overview Electric Vehicle Sales Growth In California And The US Slides PDF. Use them to share invaluable insights on Increased Fuel, Drive Deliveries, Record Amount and impress your audience. This template can be altered and modified as per your expectations. So, grab it now.
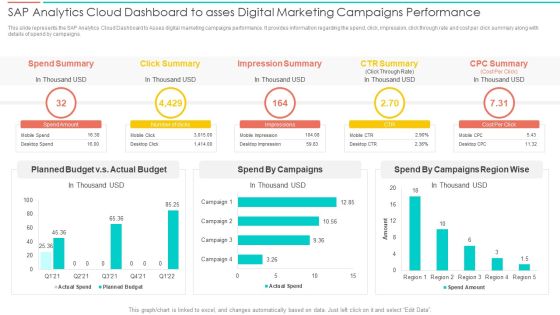
SAC Planning And Implementation SAP Analytics Cloud Dashboard To Asses Digital Marketing Pictures PDF
This slide represents the SAP Analytics Cloud Dashboard to Asses digital marketing campaigns performance. It provides information regarding the spend, click, impression, click through rate and cost per click summary along with details of spend by campaigns. Deliver an awe inspiring pitch with this creative SAC Planning And Implementation SAP Analytics Cloud Dashboard To Asses Digital Marketing Pictures PDF bundle. Topics like Spend Summary, Click Summary, Impression Summary, CTR Summary can be discussed with this completely editable template. It is available for immediate download depending on the needs and requirements of the user.
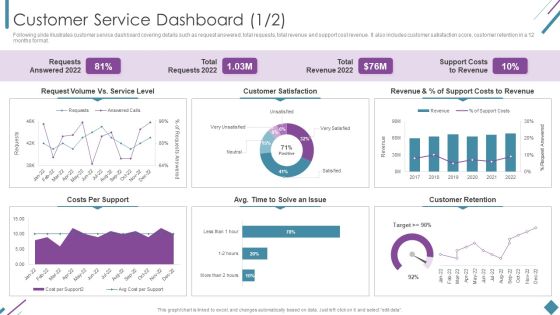
Metrics To Measure Business Performance Customer Service Dashboard Sample PDF
Following slide illustrates customer service dashboard covering details such as request answered, total requests, total revenue and support cost revenue. It also includes customer satisfaction score, customer retention in a 12 months format. Deliver and pitch your topic in the best possible manner with this Metrics To Measure Business Performance Customer Service Dashboard Sample PDF. Use them to share invaluable insights on Requests Answered 2022, Total Requests 2022, Total Revenue 2022 and impress your audience. This template can be altered and modified as per your expectations. So, grab it now.
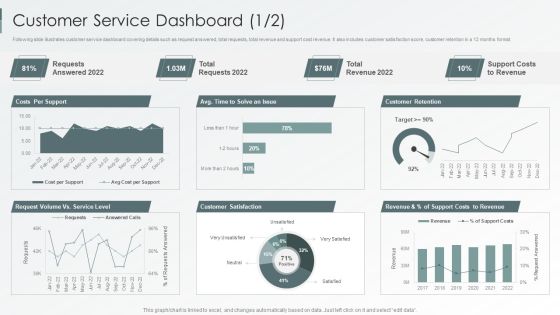
Enterprise Sustainability Performance Metrics Customer Service Dashboard Professional PDF
Following slide illustrates customer service dashboard covering details such as request answered, total requests, total revenue and support cost revenue. It also includes customer satisfaction score, customer retention in a 12 months format.Deliver and pitch your topic in the best possible manner with this Enterprise Sustainability Performance Metrics Customer Service Dashboard Professional PDF. Use them to share invaluable insights on Customer Satisfaction, Customer Retention, Support Revenue and impress your audience. This template can be altered and modified as per your expectations. So, grab it now.

Prospective Buyer Retention Dashboard With Key Performance Indicators Themes PDF
This slide shows the dashboard representing the key performance metrics for retention of potential customers of the organization. It shows no. of active users, churn rate, cost of customer acquisition, their life time value, monthly recurring revenue etc.Pitch your topic with ease and precision using this Prospective Buyer Retention Dashboard With Key Performance Indicators Themes PDF. This layout presents information on Recurring Revenue, Revenue Growth, Customer Acquisition. It is also available for immediate download and adjustment. So, changes can be made in the color, design, graphics or any other component to create a unique layout.
Tracking Channel Campaign Metrics To Measure Web Traffic Sample PDF
This slide covers measuring campaign key performance indicators through tracking channel web traffic which includes total visit, cost per click, engagement rate and total impressions. Pitch your topic with ease and precision using this Tracking Channel Campaign Metrics To Measure Web Traffic Sample PDF. This layout presents information on Revenue By Channel, Website Demographics, Product Sales Trend. It is also available for immediate download and adjustment. So, changes can be made in the color, design, graphics or any other component to create a unique layout.

Brand Promotion Communication Strategy Dashboard For Analyzing Brand Perception Introduction PDF
This slide covers the dashboard for tracking brand reputation. It also includes metrics such as new customer lifetime value, customer acquisition cost, target met, above sales target, average weekly sales revenue, etc. Deliver an awe inspiring pitch with this creative Brand Promotion Communication Strategy Dashboard For Analyzing Brand Perception Introduction PDF bundle. Topics like New customer YTD, Sales revenue YTD, Profit YTD can be discussed with this completely editable template. It is available for immediate download depending on the needs and requirements of the user.

Term Life And General Insurance Company Profile Competitor Comparison Information PDF
The slide highlights top competitors of insurance company in global market. It depicts company comparison on the basis of total policy holders, revenue per customer, cost per claim, return on surplus, renewal rate and policy sales growth. Deliver and pitch your topic in the best possible manner with this Term Life And General Insurance Company Profile Competitor Comparison Information PDF. Use them to share invaluable insights on Global Market, Revenue, Average and impress your audience. This template can be altered and modified as per your expectations. So, grab it now.

Organic Business Growth Strategies Dashboard For Measuring Success Of Our Marketing Efforts Diagrams PDF
Purpose of the following slide is to display a dashboard to help analyze the marketing efforts through essential metrics such as the revenue generated, average revenue generated per unit etc. Deliver an awe inspiring pitch with this creative Organic Business Growth Strategies Dashboard For Measuring Success Of Our Marketing Efforts Diagrams PDF bundle. Topics like Average Revenue, Customer Lifetime Value, Customer Acquisition Cost can be discussed with this completely editable template. It is available for immediate download depending on the needs and requirements of the user.

Tactical Process For Social Dashboard Depicting Social Media Recruitment Metrics Themes PDF
This slide depicts the dashboard showing metrics to measure social media recruitment status which covers sourcing status, bounce rate, filled positions, recruitment expenses, cost per hire, top referrers, etc. Deliver and pitch your topic in the best possible manner with this Tactical Process For Social Dashboard Depicting Social Media Recruitment Metrics Themes PDF. Use them to share invaluable insights on Recruitment Expenses, Bounce Rate, Positions Filled and impress your audience. This template can be altered and modified as per your expectations. So, grab it now.

Tactical Process For Social Kpis To Measure Social Media Recruitment Success Demonstration PDF
This slide focuses on key performance indicators to measure social media recruitment success which includes time to hire, recruitment costs, age of applicants, recruitment funnel, ratio of male and female. Deliver an awe inspiring pitch with this creative Tactical Process For Social Kpis To Measure Social Media Recruitment Success Demonstration PDF bundle. Topics like Male Female Ratio, Recruitment Funnel, Number Applicants can be discussed with this completely editable template. It is available for immediate download depending on the needs and requirements of the user.

Business Advisory Solutions Company Profile Research And Development R And D Expenses Summary PDF
This slide shows the research and development expenses incurred by our company in last five years in various areas such as technological change, software implementation, etc. to improve productivity and reduce additional costs. Deliver an awe inspiring pitch with this creative Business Advisory Solutions Company Profile Research And Development R And D Expenses Summary PDF bundle. Topics like R And D Expenses, Key Insights, 2018 To 2022 can be discussed with this completely editable template. It is available for immediate download depending on the needs and requirements of the user.

Commercial And Urban Architect Business Profile Company Revenue And Profit For 2017 And 2022 Introduction PDF
This slide highlights the company revenue and profit increases with supply chain planning and automation which includes data of 2018 and 2022 through bar graph. Deliver and pitch your topic in the best possible manner with this Commercial And Urban Architect Business Profile Company Revenue And Profit For 2017 And 2022 Introduction PDF. Use them to share invaluable insights on Additional Costs, Revenue Increased, Profits and impress your audience. This template can be altered and modified as per your expectations. So, grab it now.
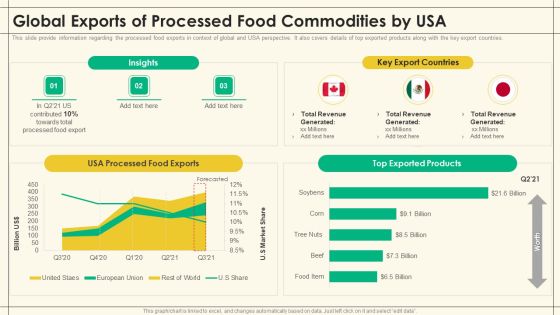
Precooked Food Industry Analysis Global Exports Of Processed Food Commodities By USA Topics PDF
This slide provide information regarding the processed food exports in context of global and USA perspective. It also covers details of top exported products along with the key export countries. Deliver and pitch your topic in the best possible manner with this Precooked Food Industry Analysis Global Exports Of Processed Food Commodities By USA Topics PDF. Use them to share invaluable insights on Supply Chain, Calendar Week, Carrying Costs and impress your audience. This template can be altered and modified as per your expectations. So, grab it now.

Customer Service Dashboard Company Performance Evaluation Using KPI Themes PDF
Following slide illustrates customer service dashboard covering details such as request answered, total requests, total revenue and support cost revenue. It also includes customer satisfaction score, customer retention in a 12 months format. Deliver and pitch your topic in the best possible manner with this Customer Service Dashboard Company Performance Evaluation Using KPI Themes PDF. Use them to share invaluable insights on Requests Answered, Total Revenue, Customer Retention and impress your audience. This template can be altered and modified as per your expectations. So, grab it now.
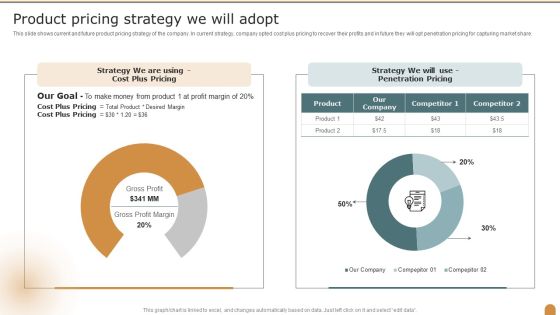
Product Pricing Strategy We Will Adopt Company Performance Evaluation Using KPI Slides PDF
This slide shows current and future product pricing strategy of the company. In current strategy, company opted cost plus pricing to recover their profits and in future they will opt penetration pricing for capturing market share. Deliver an awe inspiring pitch with this creative Product Pricing Strategy We Will Adopt Company Performance Evaluation Using KPI Slides PDF bundle. Topics like Strategy, Penetration Pricing, Our Company can be discussed with this completely editable template. It is available for immediate download depending on the needs and requirements of the user.

Competitor Comparison Health And Property Insurance Company Profile Slides PDF
The slide highlights top competitors of insurance company in global market. It depicts company comparison on the basis of total policy holders, revenue per customer, cost per claim, return on surplus, renewal rate and policy sales growth. Deliver and pitch your topic in the best possible manner with this Competitor Comparison Health And Property Insurance Company Profile Slides PDF. Use them to share invaluable insights on Company, Revenue, Sales Growth and impress your audience. This template can be altered and modified as per your expectations. So, grab it now.
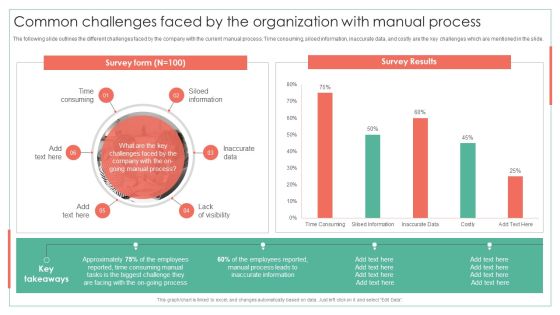
Common Challenges Faced By The Organization With Manual Process Achieving Operational Efficiency Rules PDF
The following slide outlines the different challenges faced by the company with the current manual process. Time consuming, siloed information, inaccurate data, and costly are the key challenges which are mentioned in the slide.Deliver an awe inspiring pitch with this creative Common Challenges Faced By The Organization With Manual Process Achieving Operational Efficiency Rules PDF bundle. Topics like Inaccurate Data, Siloed Information, Time Consuming can be discussed with this completely editable template. It is available for immediate download depending on the needs and requirements of the user.
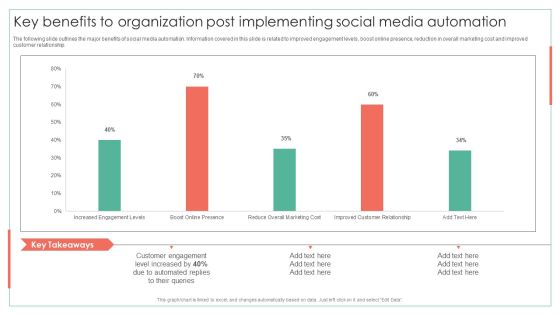
Key Benefits To Organization Post Implementing Social Media Automation Achieving Operational Efficiency Introduction PDF
The following slide outlines the major benefits of social media automation. Information covered in this slide is related to improved engagement levels, boost online presence, reduction in overall marketing cost and improved customer relationship. Deliver and pitch your topic in the best possible manner with this Key Benefits To Organization Post Implementing Social Media Automation Achieving Operational Efficiency Introduction PDF. Use them to share invaluable insights on Customer Engagement, Level Increased, Automated Replies and impress your audience. This template can be altered and modified as per your expectations. So, grab it now.

Key Challenges In Implementing Business Process Automation Achieving Operational Efficiency Infographics PDF
The following slide outlines the various challenges involved in the adoption of business process automation BPA at workplace. The challenges highlighted in the slide is related to lack of clarity in selecting the right automation tool, lack of training to employees, higher cost of automation tool, etc.Deliver an awe inspiring pitch with this creative Key Challenges In Implementing Business Process Automation Achieving Operational Efficiency Infographics PDF bundle. Topics like Lengthy Procedure, Involved Testing, Selecting Automation can be discussed with this completely editable template. It is available for immediate download depending on the needs and requirements of the user.
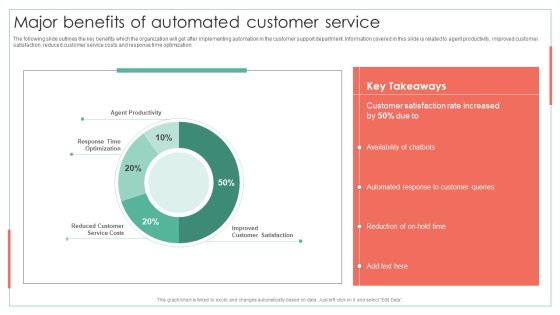
Major Benefits Of Automated Customer Service Achieving Operational Efficiency Graphics PDF
The following slide outlines the key benefits which the organization will get after implementing automation in the customer support department. Information covered in this slide is related to agent productivity, improved customer satisfaction, reduced customer service costs and response time optimization. Deliver an awe inspiring pitch with this creative Major Benefits Of Automated Customer Service Achieving Operational Efficiency Graphics PDF bundle. Topics like Customer Satisfaction, Automated Response, Customer Queries can be discussed with this completely editable template. It is available for immediate download depending on the needs and requirements of the user.

Business Revenue Bar Graph With Business Operational Expenditure Details Summary PDF
This slide represents business revenue bar graph with OPEX details which can be referred by companies to earn more revenue by controlling expenditures. It also provides information about marketing and sales, research and development, administration, total revenue, etc. Pitch your topic with ease and precision using this Business Revenue Bar Graph With Business Operational Expenditure Details Summary PDF. This layout presents information on Cost Of Marketing, Sales, Highest Amount. It is also available for immediate download and adjustment. So, changes can be made in the color, design, graphics or any other component to create a unique layout.

Attain Production Goals And Objectives KPI Metrices Ppt Summary Format Ideas PDF
This slide covers dashboard for comparing targets with actual units produced. It includes metrics such as production volume, quality, performance, production time, scheduled time, operating time, revenue, etc. Pitch your topic with ease and precision using this Attain Production Goals And Objectives KPI Metrices Ppt Summary Format Ideas PDF. This layout presents information on Production, Cost, Revenue, Performance. It is also available for immediate download and adjustment. So, changes can be made in the color, design, graphics or any other component to create a unique layout.

Evaluation Of Risk Factor Influencing Sales Performance Inspiration PDF
This slide depicts the major factors that influences the sales performance of a company. It includes pie chart with weightage showing initial risks like shortage of raw material, increase in price. Pitch your topic with ease and precision using this Evaluation Of Risk Factor Influencing Sales Performance Inspiration PDF. This layout presents information on Production Cost, Customer Shift, Risk Influencing. It is also available for immediate download and adjustment. So, changes can be made in the color, design, graphics or any other component to create a unique layout.

Business Sales And Revenue Summary Dashboard Brochure PDF
This slide exhibits sales report dashboards that provides information of sales activities and performance in financial year. It includes elements such as average weekly sales revenue, customer acquisition cost, customer lifetime value and sales target. Pitch your topic with ease and precision using this Business Sales And Revenue Summary Dashboard Brochure PDF. This layout presents information on Average Revenue, Customer Lifetime, Customer Acquisition. It is also available for immediate download and adjustment. So, changes can be made in the color, design, graphics or any other component to create a unique layout.
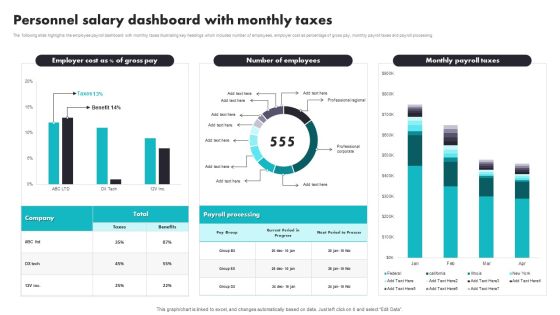
Personnel Salary Dashboard With Monthly Taxes Introduction PDF
The following slide highlights the employee payroll dashboard with monthly taxes illustrating key headings which includes number of employees, employer cost as percentage of gross pay, monthly payroll taxes and payroll processing. Pitch your topic with ease and precision using this Personnel Salary Dashboard With Monthly Taxes Introduction PDF. This layout presents information on Payroll Processing, Benefits. It is also available for immediate download and adjustment. So, changes can be made in the color, design, graphics or any other component to create a unique layout.

Dashboard Showing Digital Marketing Campaign Report Ppt Infographic Template Template PDF
This slide represents the campaign report of digital marketing which includes total spend , impressions , clicks , acquisitions, cost per action that results in analyzing marketing efforts to improve market share of business. Pitch your topic with ease and precision using this Dashboard Showing Digital Marketing Campaign Report Ppt Infographic Template Template PDF. This layout presents information on Customer Acquisition, Total Impressions, Total Clicks, Total Acquisition. It is also available for immediate download and adjustment. So, changes can be made in the color, design, graphics or any other component to create a unique layout.

Organization Demand Administration KPI Dashboard Designs PDF
The following slide represents some kpis to plan further sales and manufacturing processes. It includes elements such as total inventory cost, anticipated surplus stock, out of stock value, slow moving inventory value etc. Pitch your topic with ease and precision using this Organization Demand Administration KPI Dashboard Designs PDF. This layout presents information on Anticipated Surplus Stock, Out Of Stock, Slow Moving Inventory. It is also available for immediate download and adjustment. So, changes can be made in the color, design, graphics or any other component to create a unique layout.

Organizational Operation Expenses Chart With Revenue Microsoft PDF
This slide covers the areas in which the organization has done the expenditure for the growth of the business. The areas includes marketing sales, R D and general and administration.Pitch your topic with ease and precision using this Organizational Operation Expenses Chart With Revenue Microsoft PDF. This layout presents information on Cost Revenue, Research Development, General Administrative. It is also available for immediate download and adjustment. So, changes can be made in the color, design, graphics or any other component to create a unique layout.
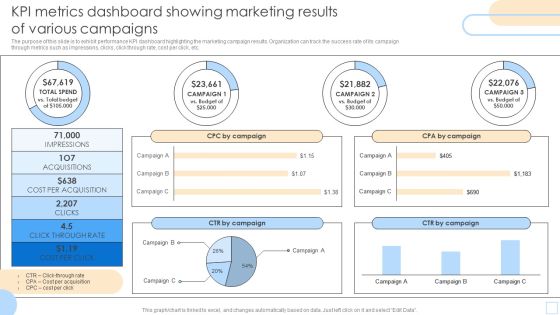
KPI Metrics Dashboard Showing Marketing Results Of Various Campaigns Pictures PDF
The purpose of this slide is to exhibit performance KPI dashboard highlighting the marketing campaign results. Organization can track the success rate of its campaign through metrics such as impressions, clicks, click through rate, cost per click, etc. Pitch your topic with ease and precision using this KPI Metrics Dashboard Showing Marketing Results Of Various Campaigns Pictures PDF. This layout presents information on Impressions, Acquisitions, CPA By Campaign. It is also available for immediate download and adjustment. So, changes can be made in the color, design, graphics or any other component to create a unique layout.
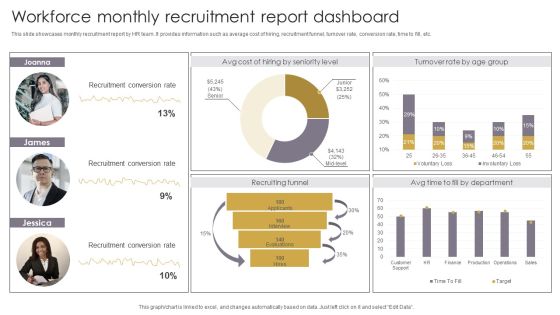
Workforce Monthly Recruitment Report Dashboard Themes PDF
This slide showcases monthly recruitment report by HR team. It provides information such as average cost of hiring, recruitment funnel, turnover rate, conversion rate, time to fill, etc. Pitch your topic with ease and precision using this Workforce Monthly Recruitment Report Dashboard Themes PDF. This layout presents information on Recruiting Funnel, Recruitment Conversion Rate, Recruitment Report Dashboard. It is also available for immediate download and adjustment. So, changes can be made in the color, design, graphics or any other component to create a unique layout.

Workforce Performance Metrics Scorecard To Measure Training Effectiveness Information PDF
Mentioned slide outlines HR KPI scorecard showcasing most important kpis. Organization can measure the success rate of HR strategy by tracking metrics such as training effectiveness, absence rate and cost, benefits satisfaction, productivity rate, net promotor score, etc.Pitch your topic with ease and precision using this Workforce Performance Metrics Scorecard To Measure Training Effectiveness Information PDF. This layout presents information on Absence Rate, Internal Promotion, Engagement Index. It is also available for immediate download and adjustment. So, changes can be made in the color, design, graphics or any other component to create a unique layout.

Healthcare Employees Dashboard With Patient Satisfaction Mockup PDF
The following slide outlines KPI dashboard of healthcare workforce. The KPIs highlighted in the template are total patients, average treatment costs, average ER waiting time, available staff, patients by division, outpatients vs inpatients trend etc.Pitch your topic with ease and precision using this Healthcare Employees Dashboard With Patient Satisfaction Mockup PDF. This layout presents information on Patient Satisfaction, Outpatients Inpatients Trend, Doctor Understand. It is also available for immediate download and adjustment. So, changes can be made in the color, design, graphics or any other component to create a unique layout.
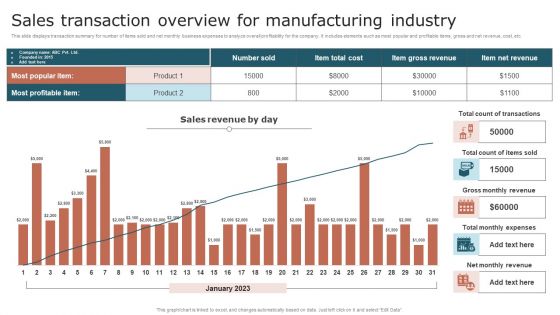
Sales Transaction Overview For Manufacturing Industry Elements PDF
This slide displays transaction summary for number of items sold and net monthly business expenses to analyze overall profitability for the company. It includes elements such as most popular and profitable items, gross and net revenue, cost, etc. Pitch your topic with ease and precision using this Sales Transaction Overview For Manufacturing Industry Elements PDF. This layout presents information on Product, Sales Revenue, Transactions. It is also available for immediate download and adjustment. So, changes can be made in the color, design, graphics or any other component to create a unique layout.

Dashboard To Analyze Performance Of Google Adwords Strategic Campaign Inspiration PDF
This slide displays dashboard for real time tracking and monitoring of marketing KPIs to review campaign performance. It includes elements such as spend, conversions, clicks, impressions, CTR, etc. Pitch your topic with ease and precision using this Dashboard To Analyze Performance Of Google Adwords Strategic Campaign Inspiration PDF. This layout presents information on Spend, Conversions, Cost Benefit Analysis . It is also available for immediate download and adjustment. So, changes can be made in the color, design, graphics or any other component to create a unique layout.

Share Portfolio Tracking Sheet To Analyze Market Indices Themes PDF
Following slide showcases portfolio tracking sheet to analyze stock market performance. This slide provides information about total number of shares purchased, price at which share bought, total cost, current market value of share, etc. Pitch your topic with ease and precision using this Share Portfolio Tracking Sheet To Analyze Market Indices Themes PDF. This layout presents information on Share Portfolio, Tracking Sheet, Market Indices. It is also available for immediate download and adjustment. So, changes can be made in the color, design, graphics or any other component to create a unique layout.
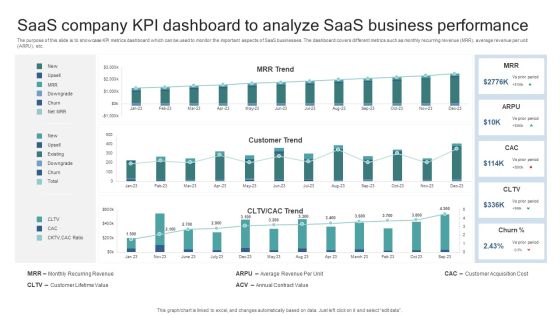
Saas Company KPI Dashboard To Analyze Saas Business Performance Elements PDF
The purpose of this slide is to showcase KPI metrics dashboard which can be used to monitor the important aspects of SaaS businesses. The dashboard covers different metrics such as monthly recurring revenue MRR, average revenue per unit ARPU, etc. Pitch your topic with ease and precision using this Saas Company KPI Dashboard To Analyze Saas Business Performance Elements PDF. This layout presents information on Monthly Recurring Revenue, Customer Lifetime Value, Average Revenue Per Unit, Annual Contract Value, Customer Acquisition Cost. It is also available for immediate download and adjustment. So, changes can be made in the color, design, graphics or any other component to create a unique layout.
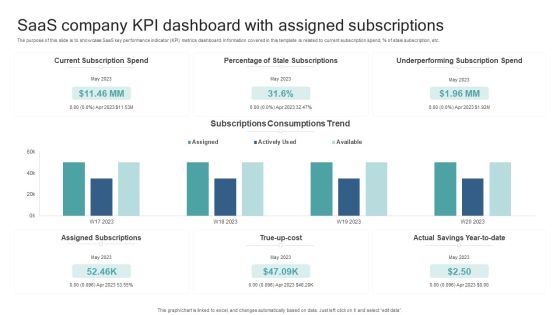
Saas Company KPI Dashboard With Assigned Subscriptions Formats PDF
The purpose of this slide is to showcase SaaS key performance indicator KPI metrics dashboard. Information covered in this template is related to current subscription spend, percent of stale subscription, etc. Pitch your topic with ease and precision using this Saas Company KPI Dashboard With Assigned Subscriptions Formats PDF. This layout presents information on Current Subscription Spend, Percentage Of Stale Subscriptions, True Up Cost, Underperforming Subscription Spend. It is also available for immediate download and adjustment. So, changes can be made in the color, design, graphics or any other component to create a unique layout.
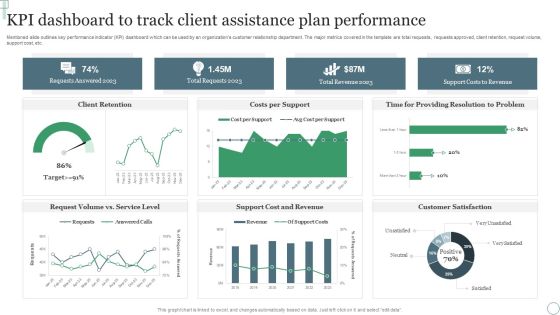
KPI Dashboard To Track Client Assistance Plan Performance Ppt Professional Outfit PDF
Mentioned slide outlines key performance indicator KPI dashboard which can be used by an organizations customer relationship department. The major metrics covered in the template are total requests, requests approved, client retention, request volume, support cost, etc. Pitch your topic with ease and precision using this KPI Dashboard To Track Client Assistance Plan Performance Ppt Professional Outfit PDF. This layout presents information on Requests Answered 2023, Total Requests 2023, Total Revenue 2023. It is also available for immediate download and adjustment. So, changes can be made in the color, design, graphics or any other component to create a unique layout.
Soft Drink Company Executive Report Overview Icons PDF
This slide illustrate soft drink manufacturing company overview along with its vision and mission statement. It includes elements such as company background, key facts about company, sales, revenue and cost of goods comparison etc. Pitch your topic with ease and precision using this Soft Drink Company Executive Report Overview Icons PDF. This layout presents information on Vision, Products, Financial Comparison. It is also available for immediate download and adjustment. So, changes can be made in the color, design, graphics or any other component to create a unique layout.

Metric Dashboard To Track Supplier Diversity And Performance Designs PDF
This slide represents KPI dashboard for tracking supplier diversity in organization and measure performance. It provides information regarding organization spending cost, supplier count, diversity type, status etc. Pitch your topic with ease and precision using this Metric Dashboard To Track Supplier Diversity And Performance Designs PDF. This layout presents information on Diversity Type, Diversity Status, Diverse Supplier. It is also available for immediate download and adjustment. So, changes can be made in the color, design, graphics or any other component to create a unique layout.

Dashboard For Cloud Data Firm Revival Action Plan Summary PDF
Following slide highlights the strategies to optimize recovery performance is to provide a revival techniques to improve performance and overcome the problem of industrial sickness. The major strategies covered herein are cost control strategy, retrenchment strategy and leader replacement strategy. Pitch your topic with ease and precision using this Dashboard For Cloud Data Firm Revival Action Plan Summary PDF. This layout presents information on Device, Success, Process. It is also available for immediate download and adjustment. So, changes can be made in the color, design, graphics or any other component to create a unique layout.

Vendor Quality Performance KPI Dashboard For Distributors Template PDF
This slide exhibits vendor performance annual dashboard that track supply chain strategies and reduce cost and increase margins. It includes elements such as purchasing value, quality performance, supplier wise purchase value, etc. Pitch your topic with ease and precision using this Vendor Quality Performance KPI Dashboard For Distributors Template PDF. This layout presents information on Purchase Value, Quality Performance, Supplier Wise Purchase Value. It is also available for immediate download and adjustment. So, changes can be made in the color, design, graphics or any other component to create a unique layout.

KPI Dashboard To Monitor Performance Of Dcaas Pictures PDF
Following slide highlights major benefits of applying data center as a service to business operations which can be used by businesses looking to modernize their IT infrastructure. Major benefits are in terms of scalability, flexibility, cost effectiveness, and security. Pitch your topic with ease and precision using this KPI Dashboard To Monitor Performance Of Dcaas Pictures PDF. This layout presents information on Customer Type, Counts By Model Attributes, Items By Status. It is also available for immediate download and adjustment. So, changes can be made in the color, design, graphics or any other component to create a unique layout.


 Continue with Email

 Home
Home


