Project Checklist
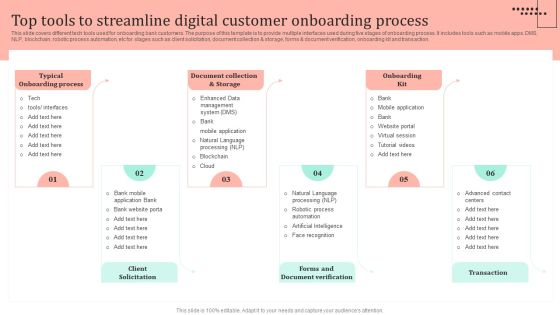
Omnichannel Strategy Implementation For Banking Solutions Top Tools To Streamline Digital Customer Sample PDF
This slide covers different tech tools used for onboarding bank customers. The purpose of this template is to provide multiple interfaces used during five stages of onboarding process. It includes tools such as mobile apps. DMS, NLP, blockchain, robotic process automation, etc for stages such as client solicitation, document collection and storage, forms and document verification, onboarding kit and transaction. If your project calls for a presentation, then Slidegeeks is your go to partner because we have professionally designed, easy to edit templates that are perfect for any presentation. After downloading, you can easily edit Omnichannel Strategy Implementation For Banking Solutions Top Tools To Streamline Digital Customer Sample PDF and make the changes accordingly. You can rearrange slides or fill them with different images. Check out all the handy templates
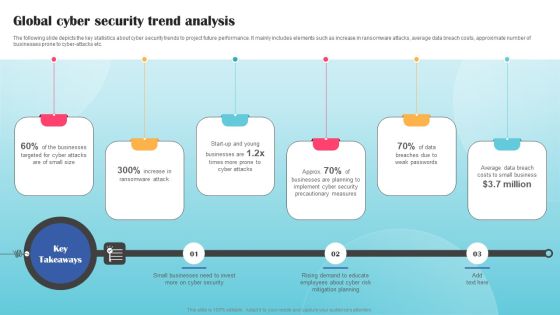
Global Cyber Security Trend Analysis Ppt PowerPoint Presentation File Styles PDF
The following slide depicts the key statistics about cyber security trends to project future performance. It mainly includes elements such as increase in ransomware attacks, average data breach costs, approximate number of businesses prone to cyber-attacks etc. The Global Cyber Security Trend Analysis Ppt PowerPoint Presentation File Styles PDF is a compilation of the most recent design trends as a series of slides. It is suitable for any subject or industry presentation, containing attractive visuals and photo spots for businesses to clearly express their messages. This template contains a variety of slides for the user to input data, such as structures to contrast two elements, bullet points, and slides for written information. Slidegeeks is prepared to create an impression.

Market Size Of Information Technology Industry USA Ppt PowerPoint Presentation Diagram Lists PDF
The following slide showcases expected revenue and compound annual growth rate CAGR of IT industry in USA. Information covered in this statistical slide is related to project oriented services, IT outsourcing services, IT support and training services, and enterprise cloud computing services. Get a simple yet stunning designed Market Size Of Information Technology Industry USA Ppt PowerPoint Presentation Diagram Lists PDF. It is the best one to establish the tone in your meetings. It is an excellent way to make your presentations highly effective. So, download this PPT today from Slidegeeks and see the positive impacts. Our easy to edit Market Size Of Information Technology Industry USA Ppt PowerPoint Presentation Diagram Lists PDF can be your go to option for all upcoming conferences and meetings. So, what are you waiting for Grab this template today.

3d Steps To Execute Success Plan 8 Stages How Wright Business PowerPoint Slides
We present our 3d steps to execute success plan 8 stages how wright business PowerPoint Slides.Present our Process and flows PowerPoint Templates because you can Trigger audience minds with your interesting ideas. Present our Arrows PowerPoint Templates because Our PowerPoint Templates and Slides will bullet point your ideas. See them fall into place one by one. Present our Flow charts PowerPoint Templates because this diagram depicts the essence of this chain reaction like sequence of events. Present our Business PowerPoint Templates because this template can project the path to sucess that you have charted. Download and present our Shapes PowerPoint Templates because you can Place them where they need to be.Use these PowerPoint slides for presentations relating to arrow, background, bullet, business, chart, checkmark, chevron, diagram, drop financial, five, glass, graphic, gray, icon, illustration, management, point, process project, reflection, set, shadow, stage, text, transparency. The prominent colors used in the PowerPoint template are Blue, Gray, White. You can be sure our 3d steps to execute success plan 8 stages how wright business PowerPoint Slides are Majestic. You can be sure our diagram PowerPoint templates and PPT Slides are incredible easy to use. People tell us our 3d steps to execute success plan 8 stages how wright business PowerPoint Slides are Dazzling. We assure you our business PowerPoint templates and PPT Slides are Radiant. The feedback we get is that our 3d steps to execute success plan 8 stages how wright business PowerPoint Slides are Fun. We assure you our bullet PowerPoint templates and PPT Slides are Reminiscent.

Uniform Way To Present Seven Stages In Flow Pizza Business Plan PowerPoint Slides
We present our uniform way to present seven stages in flow pizza business plan PowerPoint Slides.Use our Process and Flows PowerPoint Templates because you can expound on how you plan to gain their confidence and assure them of continued and consistent excellence in quality of service. Download our Business PowerPoint Templates because it helps you to project your enthusiasm and single mindedness to your colleagues. Use our Arrows PowerPoint Templates because this diagram helps you to harness the opportunities, celebrate your performance till date and focus on greater growth and expansion in coming years. Present our Shapes PowerPoint Templates because they are truly some of the wonders of our life. Download and present our Signs PowerPoint Templates because your quicksilver ideas are the arrows in your quiver.Use these PowerPoint slides for presentations relating to Arrows, background, bullet, business, chart, checkmark, chevron, diagram, drop, financial, glass, graphic, gray, icon, illustration, isometric, management, blue, perspective, placeholder, point, process, project, reflection, set, shadow, silver, stage, text, eleven, transparency. The prominent colors used in the PowerPoint template are Green dark , Black, Gray. The feedback we get is that our uniform way to present seven stages in flow pizza business plan PowerPoint Slides are Delightful. The feedback we get is that our diagram PowerPoint templates and PPT Slides will save the presenter time. People tell us our uniform way to present seven stages in flow pizza business plan PowerPoint Slides are Breathtaking. We assure you our chevron PowerPoint templates and PPT Slides are Tranquil. We assure you our uniform way to present seven stages in flow pizza business plan PowerPoint Slides are Stylish. The feedback we get is that our chart PowerPoint templates and PPT Slides are Fantastic.

Business Arrows PowerPoint Templates Business Portfolio Technical Market Analysis Ppt Slides
Business Arrows PowerPoint Templates Business portfolio technical market analysis PPT Slides-Use this powerPoint tempalte to a managing a group of projects, and delivering these projects as a portfolio.-Business Arrows PowerPoint Templates Business portfolio technical market analysis PPT Slides-This template can be used for presentations relating to Adult, Analysis, Blackboard, Board, Business, Businessman, Career, Cartoon, Chalkboard, Character, Chart, Clean, Concept, Data, Diagram, Display, Displaying, Drawing, Finance, Forecast, Gain, Graph, Handsome, Illustration, Loss, Man, Marketing, Meeting, Person, Predict, Present, Profession, Professional
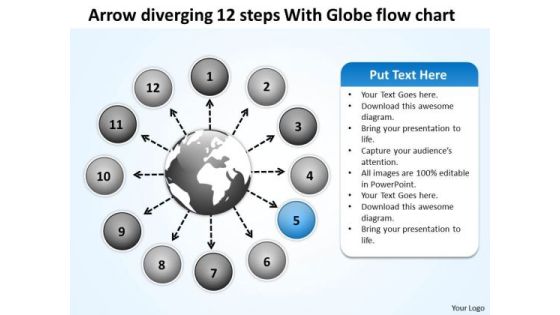
Arrow Diverging 12 Steps With Globe Flow Chart Circular Motion PowerPoint Slides
We present our arrow diverging 12 steps with globe flow chart Circular Motion PowerPoint Slides.Use our Circle Charts PowerPoint Templates because this outlines the path you have in mind in order to boost sales and stay ahead of the competition enhancing your corporate reputation as you go along the road to success. Download our Arrows PowerPoint Templates because Our PowerPoint Templates and Slides are conceived by a dedicated team. Use them and give form to your wondrous ideas. Use our Globe PowerPoint Templates because you can Start with the fundamental basic activities and slowly but surely hone them down to the top of the pyramid, the ultimate goal. Present our Business PowerPoint Templates because profit levels have been steady over the recent past. Spread your heightened excitement to others in the room. Present our Flow Charts PowerPoint Templates because we provide the means to project your views.Use these PowerPoint slides for presentations relating to 3d, abstract, aim, arrow, background, business, career, chart, circle, color, concept, creative, curve, design, development, direction, financial, flowing, gain, graph, green, group, growth, higher, illustration, increase, isolated, motion, moving, moving up, path, prediction, progress, red, series, shape, sign, success, symbol, target, turn, twisted, up, upload, upward, way, white, win. The prominent colors used in the PowerPoint template are Blue, Gray, White. PowerPoint presentation experts tell us our arrow diverging 12 steps with globe flow chart Circular Motion PowerPoint Slides are Perfect. PowerPoint presentation experts tell us our arrow PowerPoint templates and PPT Slides provide great value for your money. Be assured of finding the best projection to highlight your words. Presenters tell us our arrow diverging 12 steps with globe flow chart Circular Motion PowerPoint Slides are Reminiscent. Presenters tell us our background PowerPoint templates and PPT Slides are Flirty. You can be sure our arrow diverging 12 steps with globe flow chart Circular Motion PowerPoint Slides are designed by a team of presentation professionals. We assure you our chart PowerPoint templates and PPT Slides are Ultra.

Emerging Technology Selling Forecasts Report Clipart PDF
This slide covers sales projections for consumer tech products. It includes unit sales for devices such wearable devices, smart speakers, smart home, 4K ultra televisions, virtual reality devices and drones along with percentage of unit sales growth and revenue projections. Showcasing this set of slides titled Emerging Technology Selling Forecasts Report Clipart PDF. The topics addressed in these templates are Emerging Technology Selling Forecasts, Market. All the content presented in this PPT design is completely editable. Download it and make adjustments in color, background, font etc. as per your unique business setting.

Human Resource Strategic Planning And Budget Forecasting Template PDF
Following slide demonstrates budget plan for human resource which benefits organizations to optimize cost of HR related provisions. This slide provides data regarding various human resource categories, projected cost, variance, etc. Showcasing this set of slides titled Human Resource Strategic Planning And Budget Forecasting Template PDF. The topics addressed in these templates are Category, Projected Cost, Actual Cost. All the content presented in this PPT design is completely editable. Download it and make adjustments in color, background, font etc. as per your unique business setting.

5 Years Retail Store Selling Forecasts Revenue Formats PDF
This slide covers retail store revenue projections from product sales. It includes projections for period of 5 years based on estimated footfalls, sale per day, average sale value, revenue earned per day and year, etc. Showcasing this set of slides titled 5 Years Retail Store Selling Forecasts Revenue Formats PDF. The topics addressed in these templates are Revenue, Average Sale Value, Purchase. All the content presented in this PPT design is completely editable. Download it and make adjustments in color, background, font etc. as per your unique business setting.

Retail B2C Ecommerce Selling Forecasts Graph Portrait PDF
This slide depicts sales projections for both retail and ecommerce stores. It includes sales projections for brick and mortar and retail ecommerce stores for period of six years. Pitch your topic with ease and precision using this Retail B2C Ecommerce Selling Forecasts Graph Portrait PDF. This layout presents information on Retail B2C Ecommerce, Selling Forecasts Graph. It is also available for immediate download and adjustment. So, changes can be made in the color, design, graphics or any other component to create a unique layout.

Team Selling Forecasts And Deal Conversion Report Themes PDF
This slide covers sales projections for multiple employees in a team. It includes elements such employee names, sales progress bars, closed sales revenue, planned and projected sales revenue. Pitch your topic with ease and precision using this Team Selling Forecasts And Deal Conversion Report Themes PDF. This layout presents information on Sales Progress, Employee, Team Selling Forecasts. It is also available for immediate download and adjustment. So, changes can be made in the color, design, graphics or any other component to create a unique layout.
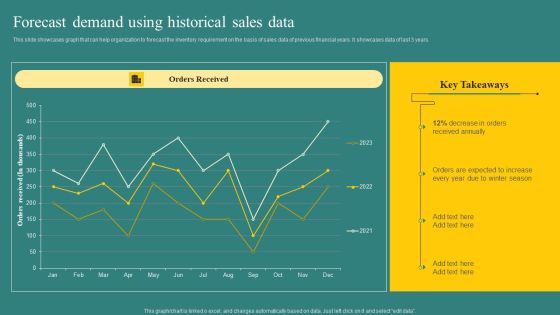
Forecast Demand Using Historical Sales Data Background PDF
This slide showcases graph that can help organization to forecast the inventory requirement on the basis of sales data of previous financial years. It showcases data of last 3 years. Take your projects to the next level with our ultimate collection of Forecast Demand Using Historical Sales Data Background PDF. Slidegeeks has designed a range of layouts that are perfect for representing task or activity duration, keeping track of all your deadlines at a glance. Tailor these designs to your exact needs and give them a truly corporate look with your own brand colors they will make your projects stand out from the rest.

Yearly Selling Forecasts Comparison And IT Store Demonstration PDF
This slide covers two year sales projections for an IT retail store. It includes projections based on per unit sales, prices and overall sale of products and services for systems, services, software, training, etc. Showcasing this set of slides titled Yearly Selling Forecasts Comparison And IT Store Demonstration PDF. The topics addressed in these templates are Service, Sales Per Unit, Price Per Unit. All the content presented in this PPT design is completely editable. Download it and make adjustments in color, background, font etc. as per your unique business setting.
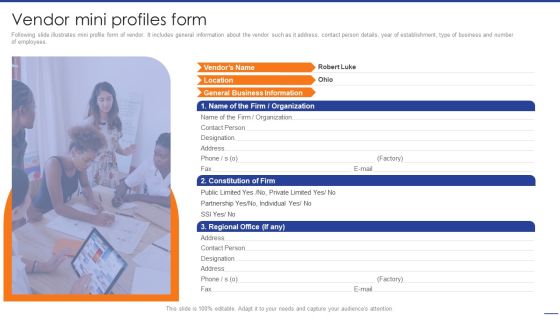
Digital Transformation Of Supply Vendor Mini Profiles Form Infographics PDF
Following slide illustrates mini profile form of vendor. It includes general information about the vendor such as it address, contact person details, year of establishment, type of business and number of employees. Take your projects to the next level with our ultimate collection of Digital Transformation Of Supply Vendor Mini Profiles Form Infographics PDF. Slidegeeks has designed a range of layouts that are perfect for representing task or activity duration, keeping track of all your deadlines at a glance. Tailor these designs to your exact needs and give them a truly corporate look with your own brand colors theyll make your projects stand out from the rest.
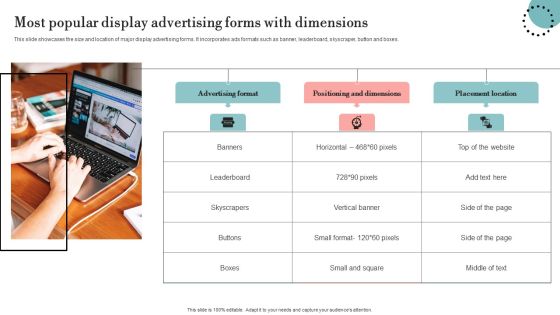
Most Popular Display Advertising Forms With Dimensions Information PDF
This slide showcases the size and location of major display advertising forms. It incorporates ads formats such as banner, leaderboard, skyscraper, button and boxes. Take your projects to the next level with our ultimate collection of Most Popular Display Advertising Forms With Dimensions Information PDF. Slidegeeks has designed a range of layouts that are perfect for representing task or activity duration, keeping track of all your deadlines at a glance. Tailor these designs to your exact needs and give them a truly corporate look with your own brand colors they will make your projects stand out from the rest.

Forecast Analysis Technique IT Overview Of Predictive Modeling Framework Portrait PDF
This slide outlines the overview of the predictive analytics framework and its components, including wide area network, OpenFlow, forecasting, software-defined networking controller, predictive models, elastic cluster, data acquisition and application servers. Take your projects to the next level with our ultimate collection of Forecast Analysis Technique IT Overview Of Predictive Modeling Framework Portrait PDF. Slidegeeks has designed a range of layouts that are perfect for representing task or activity duration, keeping track of all your deadlines at a glance. Tailor these designs to your exact needs and give them a truly corporate look with your own brand colors they will make your projects stand out from the rest.
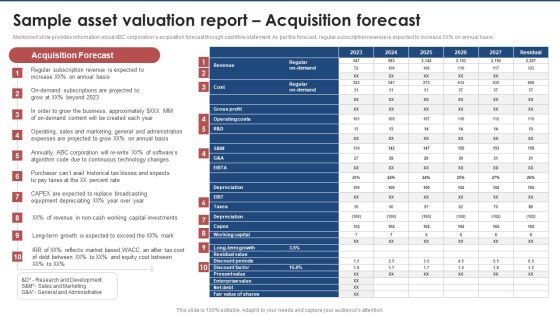
Sample Asset Valuation Report Acquisition Forecast Brand Value Estimation Guide Professional PDF
Mentioned slide provides information about ABC corporations acquisition forecast through cashflow statement. As per the forecast, regular subscription revenue is expected to increase XX precent on annual basis.Take your projects to the next level with our ultimate collection of Sample Asset Valuation Report Acquisition Forecast Brand Value Estimation Guide Professional PDF. Slidegeeks has designed a range of layouts that are perfect for representing task or activity duration, keeping track of all your deadlines at a glance. Tailor these designs to your exact needs and give them a truly corporate look with your own brand colors they all make your projects stand out from the rest.

Financial Services Organization Monthly Sales Forecast Dashboard Ppt Summary Slideshow PDF
This slide shows the dashboard representing data related to monthly sales forecast of the organization offering financial services to its clients. It includes information related to forecasted data, sales forecast, total sales, forecast projection etc. Showcasing this set of slides titled Financial Services Organization Monthly Sales Forecast Dashboard Ppt Summary Slideshow PDF. The topics addressed in these templates are Forecasts Sales, Time Series View, Forecast Projection. All the content presented in this PPT design is completely editable. Download it and make adjustments in color, background, font etc. as per your unique business setting.
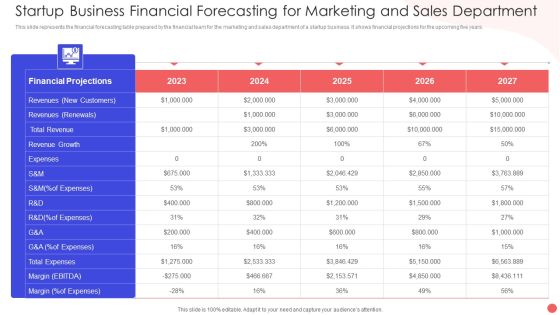
Startup Business Financial Forecasting For Marketing And Sales Department Formats PDF
This slide represents the financial forecasting table prepared by the financial team for the marketing and sales department of a startup business. It shows financial projections for the upcoming five years. Showcasing this set of slides titled Startup Business Financial Forecasting For Marketing And Sales Department Formats PDF. The topics addressed in these templates are Financial Projections Total, Revenue Growth Customers, Total Expenses Revenue. All the content presented in this PPT design is completely editable. Download it and make adjustments in color, background, font etc. as per your unique business setting.
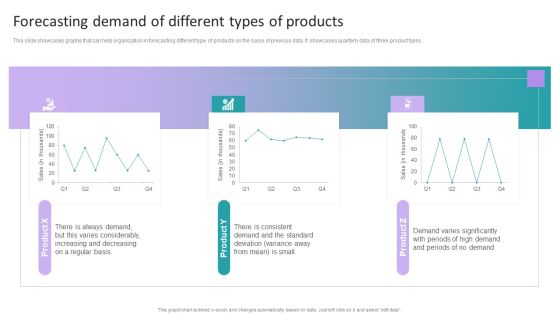
Stock Inventory Acquisition Forecasting Demand Of Different Types Of Products Slides PDF
This slide showcases graphs that can help organization in forecasting different type of products on the basis of previous data. It showcases quarterly data of three product types. Take your projects to the next level with our ultimate collection of Stock Inventory Acquisition Forecasting Demand Of Different Types Of Products Slides PDF. Slidegeeks has designed a range of layouts that are perfect for representing task or activity duration, keeping track of all your deadlines at a glance. Tailor these designs to your exact needs and give them a truly corporate look with your own brand colors theyll make your projects stand out from the rest.

Procurement Strategies For Reducing Stock Wastage Forecast Demand Using Historical Sales Data Designs PDF
This slide showcases graph that can help organization to forecast the inventory requirement on the basis of sales data of previous financial years. It showcases data of last 3 years. Take your projects to the next level with our ultimate collection of Procurement Strategies For Reducing Stock Wastage Forecast Demand Using Historical Sales Data Designs PDF. Slidegeeks has designed a range of layouts that are perfect for representing task or activity duration, keeping track of all your deadlines at a glance. Tailor these designs to your exact needs and give them a truly corporate look with your own brand colors they will make your projects stand out from the rest.

Net Banking Channel And Service Management Direct Deposit Authorization Form Formats PDF
This slide represents direct deposit authorization form. It includes name of customer, bank name, company name, company address, account number, account type etc. Take your projects to the next level with our ultimate collection of Net Banking Channel And Service Management Direct Deposit Authorization Form Formats PDF. Slidegeeks has designed a range of layouts that are perfect for representing task or activity duration, keeping track of all your deadlines at a glance. Tailor these designs to your exact needs and give them a truly corporate look with your own brand colors they will make your projects stand out from the rest.

Strategic Approaches To Efficient Candidate Selection Candidate Recruitment Evaluation And Assessment Form Summary PDF
Following slide represents candidate evaluation through assessment test. It include tests such as technical skills, situational judgement, cognitive ability, communication skills etc. Take your projects to the next level with our ultimate collection of Strategic Approaches To Efficient Candidate Selection Candidate Recruitment Evaluation And Assessment Form Summary PDF. Slidegeeks has designed a range of layouts that are perfect for representing task or activity duration, keeping track of all your deadlines at a glance. Tailor these designs to your exact needs and give them a truly corporate look with your own brand colors they will make your projects stand out from the rest

Key Informational Statistics On Workplace Conflict Portrait PDF
The purpose of this slide is to outline latest workplace conflict statistics. It covers information about employees experiencing verbal abuse, 6 month conflict between key stakeholders, employees feeling stress level etc. Take your projects to the next level with our ultimate collection of Key Informational Statistics On Workplace Conflict Portrait PDF. Slidegeeks has designed a range of layouts that are perfect for representing task or activity duration, keeping track of all your deadlines at a glance. Tailor these designs to your exact needs and give them a truly corporate look with your own brand colors they will make your projects stand out from the rest.
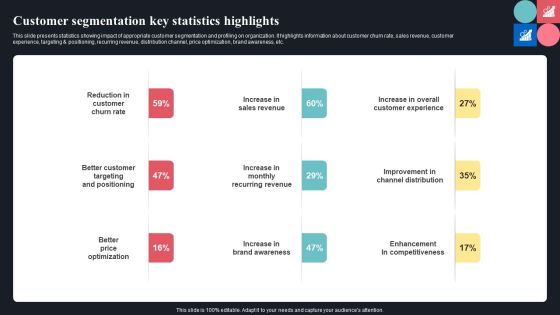
Customer Segmentation Key Statistics Highlights Ppt Layouts Graphics PDF
This slide presents statistics showing impact of appropriate customer segmentation and profiling on organization. It highlights information about customer churn rate, sales revenue, customer experience, targeting and positioning, recurring revenue, distribution channel, price optimization, brand awareness, etc.Take your projects to the next level with our ultimate collection of Customer Segmentation Key Statistics Highlights Ppt Layouts Graphics PDF. Slidegeeks has designed a range of layouts that are perfect for representing task or activity duration, keeping track of all your deadlines at a glance. Tailor these designs to your exact needs and give them a truly corporate look with your own brand colors they will make your projects stand out from the rest.
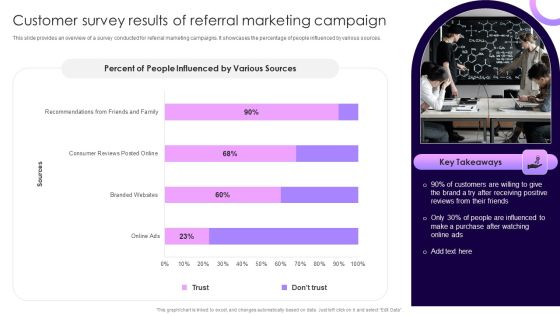
Traditional Marketing Guide To Increase Audience Engagement Customer Survey Results Of Referral Marketing Campaign Summary PDF
This slide provides an overview of a survey conducted for referral marketing campaigns. It showcases the percentage of people influenced by various sources. Take your projects to the next level with our ultimate collection of Traditional Marketing Guide To Increase Audience Engagement Customer Survey Results Of Referral Marketing Campaign Summary PDF. Slidegeeks has designed a range of layouts that are perfect for representing task or activity duration, keeping track of all your deadlines at a glance. Tailor these designs to your exact needs and give them a truly corporate look with your own brand colors they will make your projects stand out from the rest.

Detailed Guide For Talent Acquisition Candidate Experience Assessment Survey Results Clipart PDF
Mentioned slide showcases survey result summary which can be used by business to evaluate new hires onboarding experience. It includes key components such as information communication, recruiter behaviour, recruiter clarify, recruiter interview preparation, etc. Take your projects to the next level with our ultimate collection of Detailed Guide For Talent Acquisition Candidate Experience Assessment Survey Results Clipart PDF. Slidegeeks has designed a range of layouts that are perfect for representing task or activity duration, keeping track of all your deadlines at a glance. Tailor these designs to your exact needs and give them a truly corporate look with your own brand colors they will make your projects stand out from the rest.

Onboarding Journey For Effective Client Communication Customer Onboarding Journey Survey Results Infographics PDF
This exhibits the survey results for client onboarding journey. Major results covered are customers change brands if purchase procedure is difficult, customers prefer personalization, highly engaged users make more purchases, etc. Take your projects to the next level with our ultimate collection of Onboarding Journey For Effective Client Communication Customer Onboarding Journey Survey Results Infographics PDF. Slidegeeks has designed a range of layouts that are perfect for representing task or activity duration, keeping track of all your deadlines at a glance. Tailor these designs to your exact needs and give them a truly corporate look with your own brand colors they will make your projects stand out from the rest.

Cost Scrum Kpis Chart And Key Statistics Ppt Layouts Example Introduction PDF
This slide illustrates graphical representation of cost scrum metrics. It provides Projected Hours per story and actual hours per story point and other key statistics. Pitch your topic with ease and precision using this Cost Scrum Kpis Chart And Key Statistics Ppt Layouts Example Introduction PDF. This layout presents information on Projected Hours, Cost Per Story, Metrics, Actual Cost. It is also available for immediate download and adjustment. So, changes can be made in the color, design, graphics or any other component to create a unique layout.
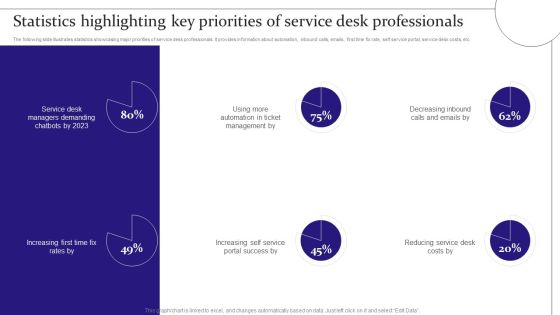
Digitalization Of Service Desk Statistics Highlighting Key Priorities Of Service Desk Professionals Ppt Gallery Grid PDF
The following slide illustrates statistics showcasing major priorities of service desk professionals. It provides information about automation, inbound calls, emails, first time fix rate, self service portal, service desk costs, etc. Take your projects to the next level with our ultimate collection of Digitalization Of Service Desk Statistics Highlighting Key Priorities Of Service Desk Professionals Ppt Gallery Grid PDF. Slidegeeks has designed a range of layouts that are perfect for representing task or activity duration, keeping track of all your deadlines at a glance. Tailor these designs to your exact needs and give them a truly corporate look with your own brand colors they will make your projects stand out from the rest.

ATS Administration To Improve Key Statistics Associated With Asset Management Structure PDF
This slide covers statistics associated with effective asset management. It involves information related to asset tracking system, ownership cost and tax and insurance etc. Take your projects to the next level with our ultimate collection of ATS Administration To Improve Key Statistics Associated With Asset Management Structure PDF. Slidegeeks has designed a range of layouts that are perfect for representing task or activity duration, keeping track of all your deadlines at a glance. Tailor these designs to your exact needs and give them a truly corporate look with your own brand colors theyll make your projects stand out from the rest.

Private Label Branding To Optimize Statistics Associated With Private Label Brand Infographics PDF
This slide represents key statistics for private brand that gives overview for the market. It includes total units sold, market share for private label brand, dollar share etc. Take your projects to the next level with our ultimate collection of Private Label Branding To Optimize Statistics Associated With Private Label Brand Infographics PDF. Slidegeeks has designed a range of layouts that are perfect for representing task or activity duration, keeping track of all your deadlines at a glance. Tailor these designs to your exact needs and give them a truly corporate look with your own brand colors theyll make your projects stand out from the rest.

Comprehensive Guide For Storytelling Promotion Storytelling Marketing Performance Statistics Clipart PDF
This slide mentions statistics that highlight the success rate of implementing storytelling as a part of marketing campaigns by businesses brands. It includes data mentioning product value, customer perception, customer inclination and brand trust. Take your projects to the next level with our ultimate collection of Comprehensive Guide For Storytelling Promotion Storytelling Marketing Performance Statistics Clipart PDF. Slidegeeks has designed a range of layouts that are perfect for representing task or activity duration, keeping track of all your deadlines at a glance. Tailor these designs to your exact needs and give them a truly corporate look with your own brand colors they will make your projects stand out from the rest.
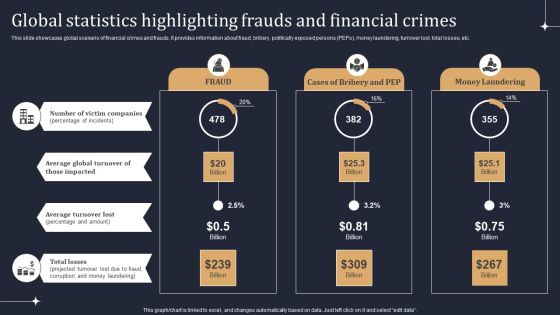
KYC Transaction Monitoring System Business Security Global Statistics Highlighting Frauds Diagrams PDF
This slide showcases global scenario of financial crimes and frauds. It provides information about fraud, bribery, politically exposed persons PEPs, money laundering, turnover lost, total losses, etc. Take your projects to the next level with our ultimate collection of KYC Transaction Monitoring System Business Security Global Statistics Highlighting Frauds Diagrams PDF. Slidegeeks has designed a range of layouts that are perfect for representing task or activity duration, keeping track of all your deadlines at a glance. Tailor these designs to your exact needs and give them a truly corporate look with your own brand colors they will make your projects stand out from the rest.

Charity Fundraising Marketing Plan Key Statistics And Figures Of Nonprofit Marketing Mockup PDF
This slide provides an overview of the nonprofit marketing stats. Major stats covered are marketers find content marketing more effective, funds raised through Instagram, donors use debit and credit cards for donations, etc. Take your projects to the next level with our ultimate collection of Charity Fundraising Marketing Plan Key Statistics And Figures Of Nonprofit Marketing Mockup PDF. Slidegeeks has designed a range of layouts that are perfect for representing task or activity duration, keeping track of all your deadlines at a glance. Tailor these designs to your exact needs and give them a truly corporate look with your own brand colors theyll make your projects stand out from the rest.

Online Banking Administration Procedure Gantt Chart Ppt Inspiration Master Slide PDF
Manage your complex projects and organize them simultaneously with this detailed Gantt Chart PowerPoint Template. Track your milestones, tasks, phases, activities, subtasks amongst other constituents that will give you an updated visual of your project. Reflect your planning horizon and capture your release plan in one view with this Gantt Chart PowerPoint presentation template. You can plot various dependencies directly on this Timeline PowerPoint Presentation Layout to see which tasks are still in the pipeline and how the delays in them are impacting the schedules and deadlines of the project. Apart from this, you can also share this updated visual with your team members and stakeholders, thus making it a resourceful tool to be incorporated in your business structure. Not only this but also the editable layout of this slide helps you to add your data and statistics at your convenience.
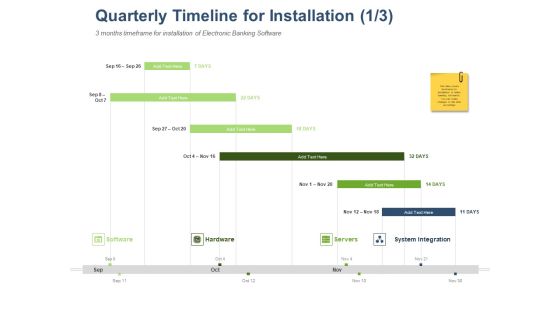
Online Banking Administration Procedure Quarterly Timeline For Installation Ppt Infographic Template Deck PDF
Manage your complex projects and organize them simultaneously with this detailed Gantt Chart PowerPoint Template. Track your milestones, tasks, phases, activities, subtasks amongst other constituents that will give you an updated visual of your project. Reflect your planning horizon and capture your release plan in one view with this Gantt Chart PowerPoint presentation template. You can plot various dependencies directly on this Timeline PowerPoint Presentation Layout to see which tasks are still in the pipeline and how the delays in them are impacting the schedules and deadlines of the project. Apart from this, you can also share this updated visual with your team members and stakeholders, thus making it a resourceful tool to be incorporated in your business structure. Not only this but also the editable layout of this slide helps you to add your data and statistics at your convenience.
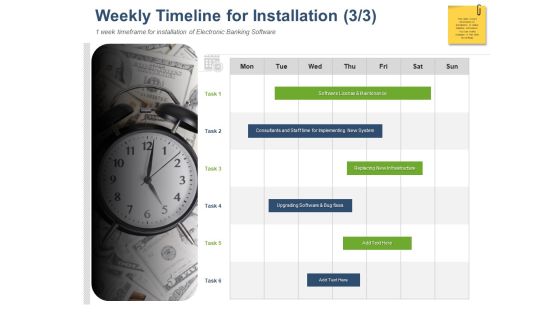
Online Banking Administration Procedure Weekly Timeline For Installation Ppt Inspiration Aids PDF
Manage your complex projects and organize them simultaneously with this detailed Gantt Chart PowerPoint Template. Track your milestones, tasks, phases, activities, subtasks amongst other constituents that will give you an updated visual of your project. Reflect your planning horizon and capture your release plan in one view with this Gantt Chart PowerPoint presentation template. You can plot various dependencies directly on this Timeline PowerPoint Presentation Layout to see which tasks are still in the pipeline and how the delays in them are impacting the schedules and deadlines of the project. Apart from this, you can also share this updated visual with your team members and stakeholders, thus making it a resourceful tool to be incorporated in your business structure. Not only this but also the editable layout of this slide helps you to add your data and statistics at your convenience.
Online Banking Administration Procedure Yearly Timeline For Installation Ppt Icon Brochure PDF
Manage your complex projects and organize them simultaneously with this detailed Gantt Chart PowerPoint Template. Track your milestones, tasks, phases, activities, subtasks amongst other constituents that will give you an updated visual of your project. Reflect your planning horizon and capture your release plan in one view with this Gantt Chart PowerPoint presentation template. You can plot various dependencies directly on this Timeline PowerPoint Presentation Layout to see which tasks are still in the pipeline and how the delays in them are impacting the schedules and deadlines of the project. Apart from this, you can also share this updated visual with your team members and stakeholders, thus making it a resourceful tool to be incorporated in your business structure. Not only this but also the editable layout of this slide helps you to add your data and statistics at your convenience.

SMM Gantt Chart For Instagram Marketing Proposal Ppt Professional Backgrounds PDF
Manage your complex projects and organize them simultaneously with this detailed Gantt Chart PowerPoint Template. Track your milestones, tasks, phases, activities, subtasks amongst other constituents that will give you an updated visual of your project. Reflect your planning horizon and capture your release plan in one view with this Gantt Chart PowerPoint presentation template. You can plot various dependencies directly on this Timeline PowerPoint Presentation Layout to see which tasks are still in the pipeline and how the delays in them are impacting the schedules and deadlines of the project. Apart from this, you can also share this updated visual with your team members and stakeholders, thus making it a resourceful tool to be incorporated in your business structure. Not only this but also the editable layout of this slide helps you to add your data and statistics at your convenience.

Web Banking For Financial Transactions Gantt Chart Ppt Slides Graphics Download PDF
Manage your complex projects and organize them simultaneously with this detailed Gantt Chart PowerPoint Template. Track your milestones, tasks, phases, activities, subtasks amongst other constituents that will give you an updated visual of your project. Reflect your planning horizon and capture your release plan in one view with this Gantt Chart PowerPoint presentation template. You can plot various dependencies directly on this Timeline PowerPoint Presentation Layout to see which tasks are still in the pipeline and how the delays in them are impacting the schedules and deadlines of the project. Apart from this, you can also share this updated visual with your team members and stakeholders, thus making it a resourceful tool to be incorporated in your business structure. Not only this but also the editable layout of this slide helps you to add your data and statistics at your convenience.
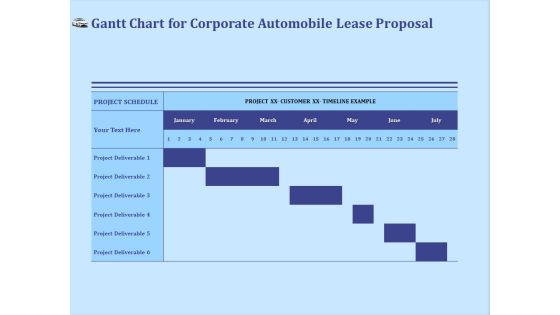
Vehicle Leasing Gantt Chart For Corporate Automobile Lease Proposal Portrait PDF
Manage your complex projects and organize them simultaneously with this detailed Gantt Chart PowerPoint Template. Track your milestones, tasks, phases, activities, subtasks amongst other constituents that will give you an updated visual of your project. Reflect your planning horizon and capture your release plan in one view with this Gantt Chart PowerPoint presentation template. You can plot various dependencies directly on this Timeline PowerPoint Presentation Layout to see which tasks are still in the pipeline and how the delays in them are impacting the schedules and deadlines of the project. Apart from this, you can also share this updated visual with your team members and stakeholders, thus making it a resourceful tool to be incorporated in your business structure. Not only this but also the editable layout of this slide helps you to add your data and statistics at your convenience.

Business Event Planning Gantt Chart For Event Proposal Ppt Ideas Tips PDF
Manage your complex projects and organize them simultaneously with this detailed Gantt Chart PowerPoint Template. Track your milestones, tasks, phases, activities, subtasks amongst other constituents that will give you an updated visual of your project. Reflect your planning horizon and capture your release plan in one view with this Gantt Chart PowerPoint presentation template. You can plot various dependencies directly on this Timeline PowerPoint Presentation Layout to see which tasks are still in the pipeline and how the delays in them are impacting the schedules and deadlines of the project. Apart from this, you can also share this updated visual with your team members and stakeholders, thus making it a resourceful tool to be incorporated in your business structure. Not only this but also the editable layout of this slide helps you to add your data and statistics at your convenience.
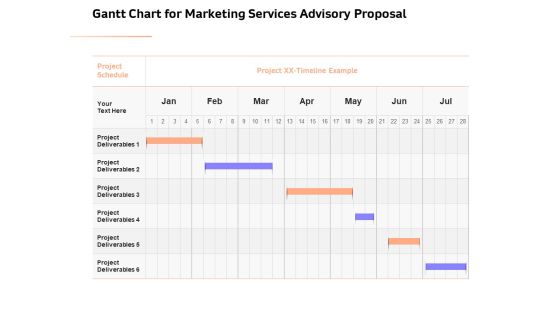
Sales Strategy Consulting Gantt Chart For Marketing Services Advisory Proposal Elements PDF
Manage your complex projects and organize them simultaneously with this detailed Gantt Chart PowerPoint Template. Track your milestones, tasks, phases, activities, subtasks amongst other constituents that will give you an updated visual of your project. Reflect your planning horizon and capture your release plan in one view with this Gantt Chart PowerPoint presentation template. You can plot various dependencies directly on this Timeline PowerPoint Presentation Layout to see which tasks are still in the pipeline and how the delays in them are impacting the schedules and deadlines of the project. Apart from this, you can also share this updated visual with your team members and stakeholders, thus making it a resourceful tool to be incorporated in your business structure. Not only this but also the editable layout of this slide helps you to add your data and statistics at your convenience.

Firm Webpage Builder And Design Gantt Chart For Organization Website Design And Development Proposal Designs PDF
Manage your complex projects and organize them simultaneously with this detailed Gantt Chart PowerPoint Template. Track your milestones, tasks, phases, activities, subtasks amongst other constituents that will give you an updated visual of your project. Reflect your planning horizon and capture your release plan in one view with this Gantt Chart PowerPoint presentation template. You can plot various dependencies directly on this Timeline PowerPoint Presentation Layout to see which tasks are still in the pipeline and how the delays in them are impacting the schedules and deadlines of the project. Apart from this, you can also share this updated visual with your team members and stakeholders, thus making it a resourceful tool to be incorporated in your business structure. Not only this but also the editable layout of this slide helps you to add your data and statistics at your convenience.

Three Dimensional Games Proposal Gantt Chart For Game Development Services Inspiration PDF
Manage your complex projects and organize them simultaneously with this detailed Gantt Chart PowerPoint Template. Track your milestones, tasks, phases, activities, subtasks amongst other constituents that will give you an updated visual of your project. Reflect your planning horizon and capture your release plan in one view with this Gantt Chart PowerPoint presentation template. You can plot various dependencies directly on this Timeline PowerPoint Presentation Layout to see which tasks are still in the pipeline and how the delays in them are impacting the schedules and deadlines of the project. Apart from this, you can also share this updated visual with your team members and stakeholders, thus making it a resourceful tool to be incorporated in your business structure. Not only this but also the editable layout of this slide helps you to add your data and statistics at your convenience.
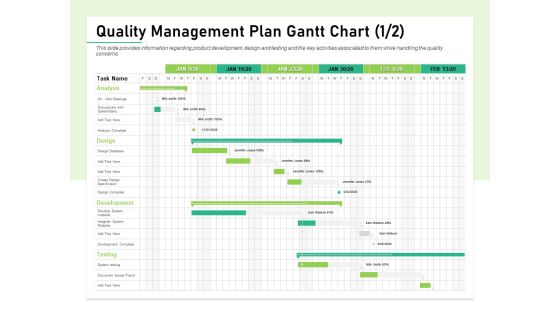
Quality Management Plan QMP Quality Management Plan Gantt Chart Design Clipart PDF
Manage your complex projects and organize them simultaneously with this detailed Gantt Chart PowerPoint Template. Track your milestones, tasks, phases, activities, subtasks amongst other constituents that will give you an updated visual of your project. Reflect your planning horizon and capture your release plan in one view with this Gantt Chart PowerPoint presentation template. You can plot various dependencies directly on this Timeline PowerPoint Presentation Layout to see which tasks are still in the pipeline and how the delays in them are impacting the schedules and deadlines of the project. Apart from this, you can also share this updated visual with your team members and stakeholders, thus making it a resourceful tool to be incorporated in your business structure. Not only this but also the editable layout of this slide helps you to add your data and statistics at your convenience.
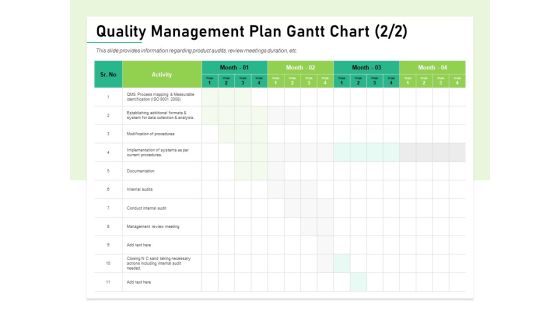
Quality Management Plan QMP Quality Management Plan Gantt Chart Mockup PDF
Manage your complex projects and organize them simultaneously with this detailed Gantt Chart PowerPoint Template. Track your milestones, tasks, phases, activities, subtasks amongst other constituents that will give you an updated visual of your project. Reflect your planning horizon and capture your release plan in one view with this Gantt Chart PowerPoint presentation template. You can plot various dependencies directly on this Timeline PowerPoint Presentation Layout to see which tasks are still in the pipeline and how the delays in them are impacting the schedules and deadlines of the project. Apart from this, you can also share this updated visual with your team members and stakeholders, thus making it a resourceful tool to be incorporated in your business structure. Not only this but also the editable layout of this slide helps you to add your data and statistics at your convenience.
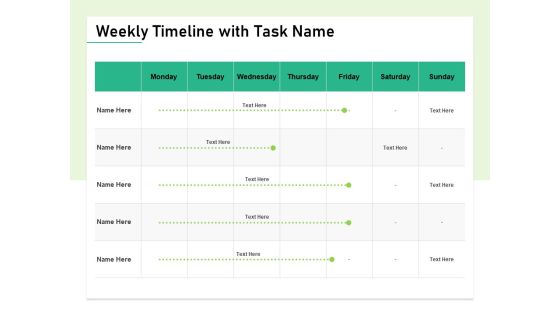
Quality Management Plan QMP Weekly Timeline With Task Name Infographics PDF
Manage your complex projects and organize them simultaneously with this detailed Gantt Chart PowerPoint Template. Track your milestones, tasks, phases, activities, subtasks amongst other constituents that will give you an updated visual of your project. Reflect your planning horizon and capture your release plan in one view with this Gantt Chart PowerPoint presentation template. You can plot various dependencies directly on this Timeline PowerPoint Presentation Layout to see which tasks are still in the pipeline and how the delays in them are impacting the schedules and deadlines of the project. Apart from this, you can also share this updated visual with your team members and stakeholders, thus making it a resourceful tool to be incorporated in your business structure. Not only this but also the editable layout of this slide helps you to add your data and statistics at your convenience.

Corporate Video Gantt Chart For Corporate Video Production Proposal Ppt Gallery Outline PDF
Manage your complex projects and organize them simultaneously with this detailed Gantt Chart PowerPoint Template. Track your milestones, tasks, phases, activities, subtasks amongst other constituents that will give you an updated visual of your project. Reflect your planning horizon and capture your release plan in one view with this Gantt Chart PowerPoint presentation template. You can plot various dependencies directly on this Timeline PowerPoint Presentation Layout to see which tasks are still in the pipeline and how the delays in them are impacting the schedules and deadlines of the project. Apart from this, you can also share this updated visual with your team members and stakeholders, thus making it a resourceful tool to be incorporated in your business structure. Not only this but also the editable layout of this slide helps you to add your data and statistics at your convenience.

Business Marketing Video Making Gantt Chart Video Editing For Company Promotion Proposal Rules PDF
Manage your complex projects and organize them simultaneously with this detailed Gantt Chart PowerPoint Template. Track your milestones, tasks, phases, activities, subtasks amongst other constituents that will give you an updated visual of your project. Reflect your planning horizon and capture your release plan in one view with this Gantt Chart PowerPoint presentation template. You can plot various dependencies directly on this Timeline PowerPoint Presentation Layout to see which tasks are still in the pipeline and how the delays in them are impacting the schedules and deadlines of the project. Apart from this, you can also share this updated visual with your team members and stakeholders, thus making it a resourceful tool to be incorporated in your business structure. Not only this but also the editable layout of this slide helps you to add your data and statistics at your convenience.

Automatically Controlling Process Gantt Chart For Implementing HR Automation In Our Company Mockup PDF
Manage your complex projects and organize them simultaneously with this detailed Gantt Chart PowerPoint Template. Track your milestones, tasks, phases, activities, subtasks amongst other constituents that will give you an updated visual of your project. Reflect your planning horizon and capture your release plan in one view with this Gantt Chart PowerPoint presentation template. You can plot various dependencies directly on this Timeline PowerPoint Presentation Layout to see which tasks are still in the pipeline and how the delays in them are impacting the schedules and deadlines of the project. Apart from this, you can also share this updated visual with your team members and stakeholders, thus making it a resourceful tool to be incorporated in your business structure. Not only this but also the editable layout of this slide helps you to add your data and statistics at your convenience.

Business Plan Gantt Chart With Milestones Ppt PowerPoint Presentation Gallery Samples PDF
Manage your complex projects and organize them simultaneously with this detailed Gantt Chart PowerPoint Template. Track your milestones, tasks, phases, activities, subtasks amongst other constituents that will give you an updated visual of your project. Reflect your planning horizon and capture your release plan in one view with this Gantt Chart PowerPoint presentation template. You can plot various dependencies directly on this Timeline PowerPoint Presentation Layout to see which tasks are still in the pipeline and how the delays in them are impacting the schedules and deadlines of the project. Apart from this, you can also share this updated visual with your team members and stakeholders, thus making it a resourceful tool to be incorporated in your business structure. Not only this but also the editable layout of this slide helps you to add your data and statistics at your convenience.

Employee Safety Health Training Program Gantt Chart For Construction Employee Training Proposal Rules PDF
Manage your complex projects and organize them simultaneously with this detailed Gantt Chart PowerPoint Template. Track your milestones, tasks, phases, activities, subtasks amongst other constituents that will give you an updated visual of your project. Reflect your planning horizon and capture your release plan in one view with this Gantt Chart PowerPoint presentation template. You can plot various dependencies directly on this Timeline PowerPoint Presentation Layout to see which tasks are still in the pipeline and how the delays in them are impacting the schedules and deadlines of the project. Apart from this, you can also share this updated visual with your team members and stakeholders, thus making it a resourceful tool to be incorporated in your business structure. Not only this but also the editable layout of this slide helps you to add your data and statistics at your convenience.
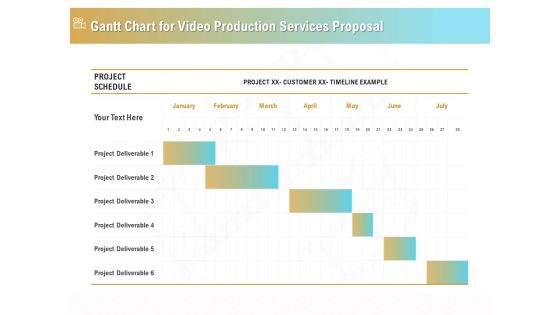
Movie Making Solutions Gantt Chart For Video Production Services Proposal Ideas PDF
Manage your complex projects and organize them simultaneously with this detailed Gantt Chart PowerPoint Template. Track your milestones, tasks, phases, activities, subtasks amongst other constituents that will give you an updated visual of your project. Reflect your planning horizon and capture your release plan in one view with this Gantt Chart PowerPoint presentation template. You can plot various dependencies directly on this Timeline PowerPoint Presentation Layout to see which tasks are still in the pipeline and how the delays in them are impacting the schedules and deadlines of the project. Apart from this, you can also share this updated visual with your team members and stakeholders, thus making it a resourceful tool to be incorporated in your business structure. Not only this but also the editable layout of this slide helps you to add your data and statistics at your convenience.
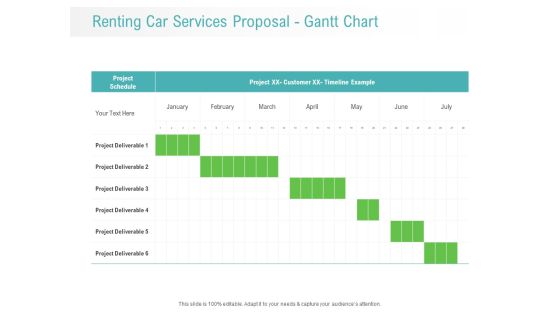
Renting Car Services Proposal Gantt Chart Ppt Outline PDF
Manage your complex projects and organize them simultaneously with this detailed Gantt Chart PowerPoint Template. Track your milestones, tasks, phases, activities, subtasks amongst other constituents that will give you an updated visual of your project. Reflect your planning horizon and capture your release plan in one view with this Gantt Chart PowerPoint presentation template. You can plot various dependencies directly on this Timeline PowerPoint Presentation Layout to see which tasks are still in the pipeline and how the delays in them are impacting the schedules and deadlines of the project. Apart from this, you can also share this updated visual with your team members and stakeholders, thus making it a resourceful tool to be incorporated in your business structure. Not only this but also the editable layout of this slide helps you to add your data and statistics at your convenience.
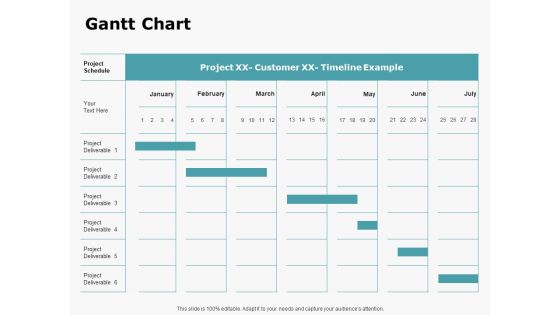
HR Outsourcing Service Proposal Gantt Chart Ppt Infographic Template Visuals PDF
Manage your complex projects and organize them simultaneously with this detailed Gantt Chart PowerPoint Template. Track your milestones, tasks, phases, activities, subtasks amongst other constituents that will give you an updated visual of your project. Reflect your planning horizon and capture your release plan in one view with this Gantt Chart PowerPoint presentation template. You can plot various dependencies directly on this Timeline PowerPoint Presentation Layout to see which tasks are still in the pipeline and how the delays in them are impacting the schedules and deadlines of the project. Apart from this, you can also share this updated visual with your team members and stakeholders, thus making it a resourceful tool to be incorporated in your business structure. Not only this but also the editable layout of this slide helps you to add your data and statistics at your convenience.

Conversion Rate Optimization Gantt Chart For Conversion Rate Enhancement Proposal Ppt Icon Example PDF
Manage your complex projects and organize them simultaneously with this detailed Gantt Chart PowerPoint Template. Track your milestones, tasks, phases, activities, subtasks amongst other constituents that will give you an updated visual of your project. Reflect your planning horizon and capture your release plan in one view with this Gantt Chart PowerPoint presentation template. You can plot various dependencies directly on this Timeline PowerPoint Presentation Layout to see which tasks are still in the pipeline and how the delays in them are impacting the schedules and deadlines of the project. Apart from this, you can also share this updated visual with your team members and stakeholders, thus making it a resourceful tool to be incorporated in your business structure. Not only this but also the editable layout of this slide helps you to add your data and statistics at your convenience.
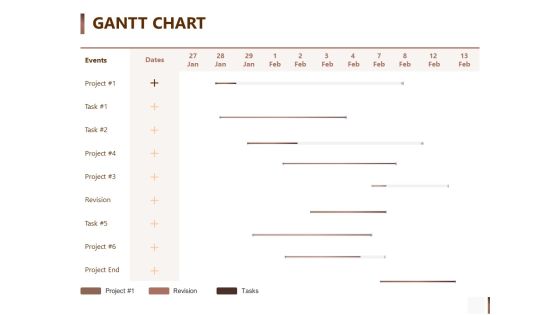
Shipment Proposal For Corporate Occasion Gantt Chart Introduction PDF
Manage your complex projects and organize them simultaneously with this detailed Gantt Chart PowerPoint Template. Track your milestones, tasks, phases, activities, subtasks amongst other constituents that will give you an updated visual of your project. Reflect your planning horizon and capture your release plan in one view with this Gantt Chart PowerPoint presentation template. You can plot various dependencies directly on this Timeline PowerPoint Presentation Layout to see which tasks are still in the pipeline and how the delays in them are impacting the schedules and deadlines of the project. Apart from this, you can also share this updated visual with your team members and stakeholders, thus making it a resourceful tool to be incorporated in your business structure. Not only this but also the editable layout of this slide helps you to add your data and statistics at your convenience.

 Home
Home