Project Budget Dashboard

Financial Kpi Dashboard To Measure Brand Performance Brand Value Estimation Guide Inspiration PDF
Mentioned slide showcases KPI dashboard that can be used to check the financial performance of a brand. Metrics covered in the dashboard are return on assets, working capital ratio, return on equity etc.Are you in need of a template that can accommodate all of your creative concepts This one is crafted professionally and can be altered to fit any style. Use it with Google Slides or PowerPoint. Include striking photographs, symbols, depictions, and other visuals. Fill, move around, or remove text boxes as desired. Test out color palettes and font mixtures. Edit and save your work, or work with colleagues. Download Financial Kpi Dashboard To Measure Brand Performance Brand Value Estimation Guide Inspiration PDF and observe how to make your presentation outstanding. Give an impeccable presentation to your group and make your presentation unforgettable.

Guide To Develop And Estimate Brand Value Financial KPI Dashboard To Measure Brand Performance Formats PDF
Mentioned slide showcases KPI dashboard that can be used to check the financial performance of a brand. Metrics covered in the dashboard are return on assets, working capital ratio, return on equity etc.Coming up with a presentation necessitates that the majority of the effort goes into the content and the message you intend to convey. The visuals of a PowerPoint presentation can only be effective if it supplements and supports the story that is being told. Keeping this in mind our experts created Guide To Develop And Estimate Brand Value Financial KPI Dashboard To Measure Brand Performance Formats PDF to reduce the time that goes into designing the presentation. This way, you can concentrate on the message while our designers take care of providing you with the right template for the situation.

Guide To Develop And Estimate Brand Value Brand Awareness Measuring Kpi Dashboard Infographics PDF
Following slide illustrates KPI dashboard that can be used to track the awareness level of a specific brand. KPIs covered in the slide are traffic, attention, authority, inbound channel performance etc.From laying roadmaps to briefing everything in detail, our templates are perfect for you. You can set the stage with your presentation slides. All you have to do is download these easy-to-edit and customizable templates. Guide To Develop And Estimate Brand Value Brand Awareness Measuring Kpi Dashboard Infographics PDF will help you deliver an outstanding performance that everyone would remember and praise you for. Do download this presentation today.

Virtual Assets Investment Guide Dashboard To Effectively Track Bitcoin Performance Rules PDF
The following dashboard highlights key parameters that can be used by the organization to track the performance of their Bitcoin investment, it enlists major KPIs such as price of Bitcoin, transaction chart and its historical performance. Deliver an awe inspiring pitch with this creative Virtual Assets Investment Guide Dashboard To Effectively Track Bitcoin Performance Rules PDF bundle. Topics like Bitcoin Chart, Transaction Chart, Prediction Meter can be discussed with this completely editable template. It is available for immediate download depending on the needs and requirements of the user.

Virtual Currency Investment Guide For Companies Dashboard To Effectively Track Bitcoin Diagrams PDF
The following dashboard highlights key parameters that can be used by the organization to track the performance of their bitcoin investment, it enlists major KPIs such as price of bitcoin, transaction chart and its historical performance. Deliver an awe inspiring pitch with this creative Virtual Currency Investment Guide For Companies Dashboard To Effectively Track Bitcoin Diagrams PDF bundle. Topics like Prediction Meter, Todays Market Activity, Transaction Chart can be discussed with this completely editable template. It is available for immediate download depending on the needs and requirements of the user.

Product Marketing Performance Assessment Dashboard With Cost Per Conversion Professional PDF
This slide showcases dashboard that can help organization to calculate the return of investment from advertising campaigns. Its key components are top performing advertisement, top performing campaigns, conversion rate, conversion value, click through rate, cost per click and cost per conversion. Showcasing this set of slides titled Product Marketing Performance Assessment Dashboard With Cost Per Conversion Professional PDF. The topics addressed in these templates are Top Performing Advertisement, Top Performing Campaigns, AdWords Conversions. All the content presented in this PPT design is completely editable. Download it and make adjustments in color, background, font etc. as per your unique business setting.
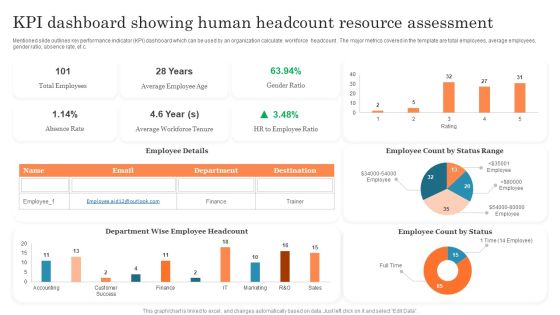
KPI Dashboard Showing Human Headcount Resource Assessment Ppt PowerPoint Presentation Outline PDF
Mentioned slide outlines key performance indicator KPI dashboard which can be used by an organization calculate workforce headcount . The major metrics covered in the template are total employees, average employees, gender ratio, absence rate, etc. Pitch your topic with ease and precision using this KPI Dashboard Showing Human Headcount Resource Assessment Ppt PowerPoint Presentation Outline PDF. This layout presents information on Total Employees, Average Employee, Employee Count. It is also available for immediate download and adjustment. So, changes can be made in the color, design, graphics or any other component to create a unique layout.

Business To Business Account Sales Management Activities Tracking Dashboard Mockup PDF
This slide provides information regarding sales management activities tracking dashboard to measure closed business, sales pipeline, sales activity by sales rep, month over month growth, forecast by month, etc. Deliver and pitch your topic in the best possible manner with this Business To Business Account Sales Management Activities Tracking Dashboard Mockup PDF. Use them to share invaluable insights on Closed Business, Sales Pipeline, Sales Activity By Sales Rep, Forecast By Month, Sales Pipeline By Sales Rep and impress your audience. This template can be altered and modified as per your expectations. So, grab it now.

Business To Business Sales Management Playbook Sales Management Activities Tracking Dashboard Microsoft PDF
This slide provides information regarding sales management activities tracking dashboard to measure closed business, sales pipeline, sales activity by sales rep, month over month growth, forecast by month, etc.Deliver and pitch your topic in the best possible manner with this Business To Business Sales Management Playbook Sales Management Activities Tracking Dashboard Microsoft PDF Use them to share invaluable insights on Forecast Month, Sales Pipeline, Sales Activity and impress your audience. This template can be altered and modified as per your expectations. So, grab it now.

Customer Relationship Management Software CRM Dashboard For Tracking Sales Pipeline Background PDF
This slide covers the CRM KPI dashboard for monitoring lead status in the sales funnel. It includes metrics such as open pipeline value, open pipeline by product package, pipeline value forecast, etc. Deliver and pitch your topic in the best possible manner with this Customer Relationship Management Software CRM Dashboard For Tracking Sales Pipeline Background PDF. Use them to share invaluable insights on Product Package, Pipeline Value, Value Forecast and impress your audience. This template can be altered and modified as per your expectations. So, grab it now.

CRM System Implementation Stages CRM Dashboard For Tracking Sales Pipeline Background PDF
This slide covers the CRM KPI dashboard for monitoring lead status in the sales funnel. It includes metrics such as open pipeline value, open pipeline by product package, pipeline value forecast, etc. Deliver and pitch your topic in the best possible manner with this CRM System Implementation Stages CRM Dashboard For Tracking Sales Pipeline Background PDF. Use them to share invaluable insights on Pipeline Value, Value Forecast, Sales Opportunities and impress your audience. This template can be altered and modified as per your expectations. So, grab it now.

CRM System Deployment Plan CRM Dashboard For Tracking Sales Pipeline Pictures PDF
This slide covers the CRM KPI dashboard for monitoring lead status in the sales funnel. It includes metrics such as open pipeline value, open pipeline by product package, pipeline value forecast, etc. Deliver an awe inspiring pitch with this creative CRM System Deployment Plan CRM Dashboard For Tracking Sales Pipeline Pictures PDF bundle. Topics like Pipeline Value Forecast, Open Pipeline Value, Branding can be discussed with this completely editable template. It is available for immediate download depending on the needs and requirements of the user.

Strategies To Deploy Diversity In Workplace KPI Dashboard To Monitor Workforce Diversity Infographics PDF
This slide illustrates the KPI dashboard for workforce diversity providing details regarding headcount by seniority, gender and gender. It also provides information regarding monthly median age by gender and women at senior level forecast. Crafting an eye-catching presentation has never been more straightforward. Let your presentation shine with this tasteful yet straightforward Strategies To Deploy Diversity In Workplace KPI Dashboard To Monitor Workforce Diversity Infographics PDF template. It offers a minimalistic and classy look that is great for making a statement. The colors have been employed intelligently to add a bit of playfulness while still remaining professional. Construct the ideal Strategies To Deploy Diversity In Workplace KPI Dashboard To Monitor Workforce Diversity Infographics PDF that effortlessly grabs the attention of your audience Begin now and be certain to wow your customers.

Information Technology Company Monthly Sales Forecast Dashboard Ppt Portfolio Images PDF
This slide shows the dashboard representing the data related to monthly sales forecast of an Information Technology Company. It shows information related to the net sales by customer, variance between actual and forecasted sales, total net sales, net sales per customer and total net sales per time for actual and forecasted sales. Pitch your topic with ease and precision using this Information Technology Company Monthly Sales Forecast Dashboard Ppt Portfolio Images PDF. This layout presents information on Total Net Sales, Actual vs Forecast, Net Sales Customer. It is also available for immediate download and adjustment. So, changes can be made in the color, design, graphics or any other component to create a unique layout.

Dashboard To Track Website Visitors On Brand Landing Pages Graphics PDF
This slide showcases dashboard that can help organization to track the visitors on landing pages of different brands. Its key elements are forecast purchasers, customer acquisition cost and visitors count by landing pages. Here you can discover an assortment of the finest PowerPoint and Google Slides templates. With these templates, you can create presentations for a variety of purposes while simultaneously providing your audience with an eye catching visual experience. Download Dashboard To Track Website Visitors On Brand Landing Pages Graphics PDF to deliver an impeccable presentation. These templates will make your job of preparing presentations much quicker, yet still, maintain a high level of quality. Slidegeeks has experienced researchers who prepare these templates and write high quality content for you. Later on, you can personalize the content by editing the Dashboard To Track Website Visitors On Brand Landing Pages Graphics PDF.
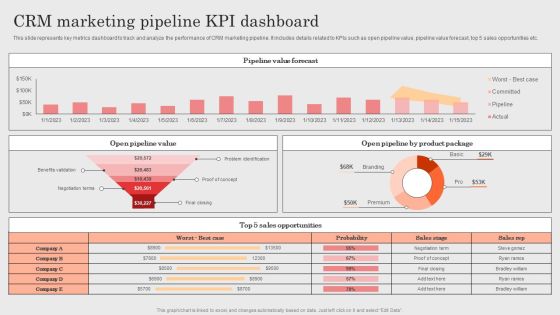
Integrating CRM Solution To Acquire Potential Customers CRM Marketing Pipeline KPI Dashboard Background PDF
This slide represents key metrics dashboard to track and analyze the performance of CRM marketing pipeline. It includes details related to KPIs such as open pipeline value, pipeline value forecast, top 5 sales opportunities etc. Crafting an eye catching presentation has never been more straightforward. Let your presentation shine with this tasteful yet straightforward Integrating CRM Solution To Acquire Potential Customers CRM Marketing Pipeline KPI Dashboard Background PDF template. It offers a minimalistic and classy look that is great for making a statement. The colors have been employed intelligently to add a bit of playfulness while still remaining professional. Construct the ideal Integrating CRM Solution To Acquire Potential Customers CRM Marketing Pipeline KPI Dashboard Background PDF that effortlessly grabs the attention of your audience. Begin now and be certain to wow your customers.

Assessing Debt And Equity Fundraising Alternatives For Business Growth Financial Dashboard To Evaluate Internal Designs PDF
This slide showcases dashboard that can help organization to calculate the internal rate of return on invested capital. Company can use it to communicate the return on investment to investors. Create an editable Assessing Debt And Equity Fundraising Alternatives For Business Growth Financial Dashboard To Evaluate Internal Designs PDF that communicates your idea and engages your audience. Whether you are presenting a business or an educational presentation, pre designed presentation templates help save time.Assessing Debt And Equity Fundraising Alternatives For Business Growth Financial Dashboard To Evaluate Internal Designs PDF is highly customizable and very easy to edit, covering many different styles from creative to business presentations. Slidegeeks has creative team members who have crafted amazing templates. So, go and get them without any delay.
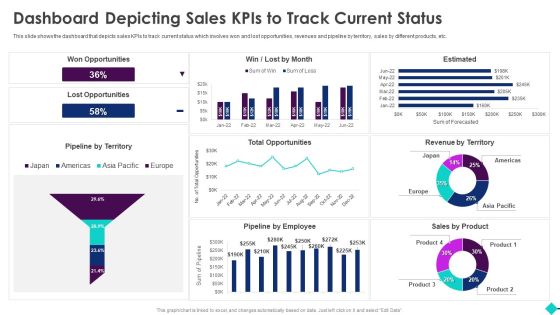
Sales Process Automation For Revenue Growth Dashboard Depicting Sales Kpis To Track Current Status Introduction PDF
This slide shows the dashboard that depicts sales KPIs to track current status which involves won and lost opportunities, revenues and pipeline by territory, sales by different products, etc.Deliver and pitch your topic in the best possible manner with this Sales Process Automation For Revenue Growth Dashboard Depicting Sales Kpis To Track Current Status Introduction PDF. Use them to share invaluable insights on Marketing Effectiveness, Forecast Accuracy, Pipeline Thickness and impress your audience. This template can be altered and modified as per your expectations. So, grab it now.
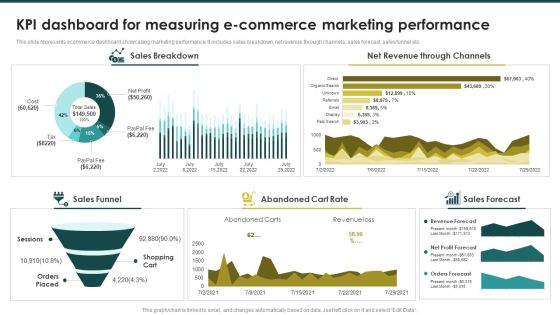
KPI Dashboard For Measuring Ecommerce Marketing Ecommerce Marketing Plan To Enhance Brochure PDF
This slide represents ecommerce dashboard showcasing marketing performance. It includes sales breakdown, net revenue through channels, sales forecast, sales funnel etc.Find highly impressive KPI Dashboard For Measuring Ecommerce Marketing Ecommerce Marketing Plan To Enhance Brochure PDF on Slidegeeks to deliver a meaningful presentation. You can save an ample amount of time using these presentation templates. No need to worry to prepare everything from scratch because Slidegeeks experts have already done a huge research and work for you. You need to download KPI Dashboard For Measuring Ecommerce Marketing Ecommerce Marketing Plan To Enhance Brochure PDF for your upcoming presentation. All the presentation templates are 100precent editable and you can change the color and personalize the content accordingly. Download now.

CRM Software Deployment Journey CRM Dashboard For Tracking Sales Pipeline Demonstration PDF
This slide covers the CRM KPI dashboard for monitoring lead status in the sales funnel. It includes metrics such as open pipeline value, open pipeline by product package, pipeline value forecast, etc. Do you have to make sure that everyone on your team knows about any specific topic I yes, then you should give CRM Software Deployment Journey CRM Dashboard For Tracking Sales Pipeline Demonstration PDF a try. Our experts have put a lot of knowledge and effort into creating this impeccable CRM Software Deployment Journey CRM Dashboard For Tracking Sales Pipeline Demonstration PDF. You can use this template for your upcoming presentations, as the slides are perfect to represent even the tiniest detail. You can download these templates from the Slidegeeks website and these are easy to edit. So grab these today.
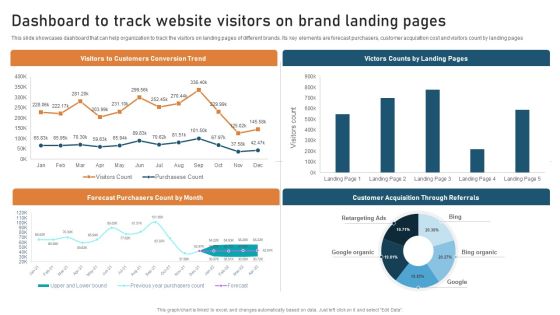
Targeted Market Entry Strategy Dashboard To Track Website Visitors On Brand Landing Guidelines PDF
This slide showcases dashboard that can help organization to track the visitors on landing pages of different brands. Its key elements are forecast purchasers, customer acquisition cost and visitors count by landing pages. From laying roadmaps to briefing everything in detail, our templates are perfect for you. You can set the stage with your presentation slides. All you have to do is download these easy-to-edit and customizable templates. Targeted Market Entry Strategy Dashboard To Track Website Visitors On Brand Landing Guidelines PDF will help you deliver an outstanding performance that everyone would remember and praise you for. Do download this presentation today.

Strategic Partnership Management Plan Customer Relationship Management Dashboard Value Demonstration PDF
This slide covers the customer relationship management dashboard which includes company goals, revenue by deal source, new deals, etc. Deliver and pitch your topic in the best possible manner with this strategic partnership management plan customer relationship management dashboard value demonstration pdf. Use them to share invaluable insights on revenue this quarter, revenue goal attainment this year, revenue by deal source this year, revenue by deal source by owner this year, pipeline coverage this year, forecast this year, new deals by month this year and impress your audience. This template can be altered and modified as per your expectations. So, grab it now.
SFA Dashboard To Track Performance Ppt PowerPoint Presentation Icon Example File PDF
This Slide visually represents sales force automation dashboard to track performance which can be utilized by marketing managers to streamline the process of automated selling. It includes information about sales pipeline, competitors, opportunities, key competitors, etc. Pitch your topic with ease and precision using this sfa dashboard to track performance ppt powerpoint presentation icon example file pdf. This layout presents information on sales pipeline, sales pipeline by sales rep, key competitors, forecast by month, key opportunities. It is also available for immediate download and adjustment. So, changes can be made in the color, design, graphics or any other component to create a unique layout.
Instructions Playbook For B2B Sales Executive Sales Management Activities Tracking Dashboard Pictures PDF
This slide provides information regarding sales management activities tracking dashboard to measure closed business, sales pipeline, sales activity by sales rep, month over month growth, forecast by month, etc. Deliver and pitch your topic in the best possible manner with this Instructions Playbook For B2B Sales Executive Sales Management Activities Tracking Dashboard Pictures PDF. Use them to share invaluable insights on Closed Business, Sales Pipeline, Sales Activity and impress your audience. This template can be altered and modified as per your expectations. So, grab it now.
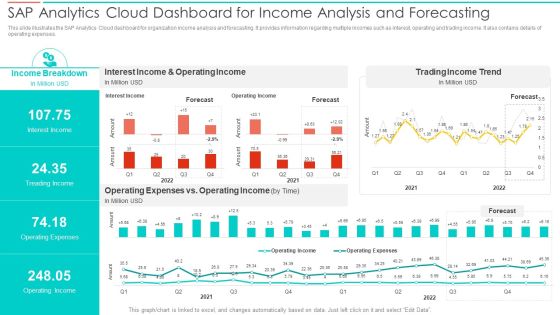
SAC Planning And Implementation SAP Analytics Cloud Dashboard For Income Analysis Summary PDF
This slide illustrates the SAP Analytics Cloud dashboard for organization income analysis and forecasting. It provides information regarding multiple incomes such as interest, operating and trading income. It also contains details of operating expenses. Deliver an awe inspiring pitch with this creative SAC Planning And Implementation SAP Analytics Cloud Dashboard For Income Analysis Summary PDF bundle. Topics like Income Breakdown, Interest Income, Operating Income, Trading Income Trend can be discussed with this completely editable template. It is available for immediate download depending on the needs and requirements of the user.

B2B Sales Techniques Playbook Sales Management Activities Tracking Dashboard Diagrams PDF
This slide provides information regarding sales management activities tracking dashboard to measure closed business, sales pipeline, sales activity by sales rep, month over month growth, forecast by month, etc. Deliver and pitch your topic in the best possible manner with this B2B Sales Techniques Playbook Sales Management Activities Tracking Dashboard Diagrams PDF. Use them to share invaluable insights on Sales Pipeline, Sales Activity, Sales Pipeline and impress your audience. This template can be altered and modified as per your expectations. So, grab it now.

KPI Dashboard To Evaluate Growth In Sales Funnel Reporting Topics PDF
This slide represents the KPI dashboard to measure sales pipeline reporting for increasing customer conversion rate. It includes activity by representative, forecast by month and monthly growth. Pitch your topic with ease and precision using this KPI Dashboard To Evaluate Growth In Sales Funnel Reporting Topics PDF. This layout presents information on Pipeline Requirement, Key Activities, Pipeline Closed Date. It is also available for immediate download and adjustment. So, changes can be made in the color, design, graphics or any other component to create a unique layout.
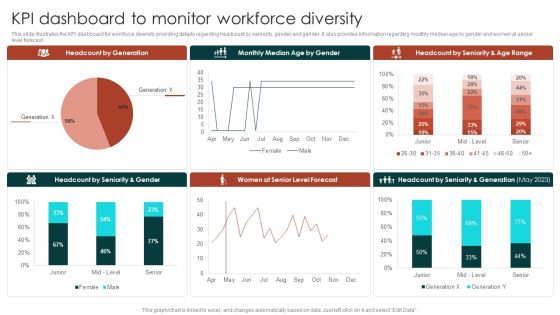
Diversity Management Plan To Improve Workplace Culture KPI Dashboard To Monitor Workforce Microsoft PDF
This slide illustrates the KPI dashboard for workforce diversity providing details regarding headcount by seniority, gender and gender. It also provides information regarding monthly median age by gender and women at senior level forecast.Find a pre-designed and impeccable Diversity Management Plan To Improve Workplace Culture KPI Dashboard To Monitor Workforce Microsoft PDF. The templates can ace your presentation without additional effort. You can download these easy-to-edit presentation templates to make your presentation stand out from others. So, what are you waiting for. Download the template from Slidegeeks today and give a unique touch to your presentation.

Business Unit Valuation And Development Dashboard Ppt Professional Graphic Tips PDF
This slide shows key performance indicators dashboard which represents number of assets along with their stages of development. It also includes estimated development cost and production index comparison. Pitch your topic with ease and precision using this Business Unit Valuation And Development Dashboard Ppt Professional Graphic Tips PDF. This layout presents information on Estimated Development Cost, Production Index, Development Stage. It is also available for immediate download and adjustment. So, changes can be made in the color, design, graphics or any other component to create a unique layout.
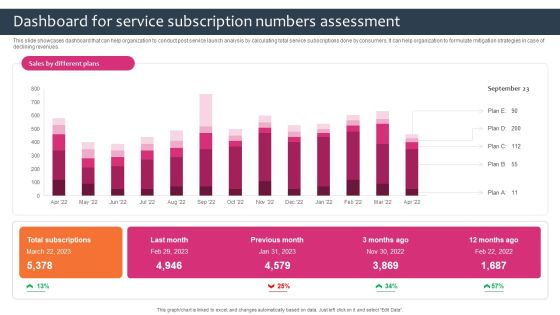
Promotion Sales Techniques For New Service Introduction Dashboard For Service Subscription Pictures PDF
This slide showcases dashboard that can help organization to conduct post service launch analysis by calculating total service subscriptions done by consumers. It can help organization to formulate mitigation strategies in case of declining revenues. Do you have to make sure that everyone on your team knows about any specific topic I yes, then you should give Promotion Sales Techniques For New Service Introduction Dashboard For Service Subscription Pictures PDF a try. Our experts have put a lot of knowledge and effort into creating this impeccable Promotion Sales Techniques For New Service Introduction Dashboard For Service Subscription Pictures PDF. You can use this template for your upcoming presentations, as the slides are perfect to represent even the tiniest detail. You can download these templates from the Slidegeeks website and these are easy to edit. So grab these today.
Influencers Marketing Campaign Performance Tracking Dashboard Ppt PowerPoint Presentation Diagram Lists PDF
This slide covers performance monitoring dashboard of influencer based referral marketing program. It includes elements such as impressions on Instagram, likes, comments, clicks, sales generated along with value calculators and campaign breakdown based on gender and age. Formulating a presentation can take up a lot of effort and time, so the content and message should always be the primary focus. The visuals of the PowerPoint can enhance the presenters message, so our Influencers Marketing Campaign Performance Tracking Dashboard Ppt PowerPoint Presentation Diagram Lists PDF was created to help save time. Instead of worrying about the design, the presenter can concentrate on the message while our designers work on creating the ideal templates for whatever situation is needed. Slidegeeks has experts for everything from amazing designs to valuable content, we have put everything into Influencers Marketing Campaign Performance Tracking Dashboard Ppt PowerPoint Presentation Diagram Lists PDF

Customer Lifetime Value Based Success KPIS Dashboard Ppt PowerPoint Presentation Layouts Gridlines PDF
This slide covers dashboard for estimation of customer lifetime value as success metrics. It includes KPIs such as customer lifetime value, customer lifetime period, customer risk, customer contact rate, customer retention costs, average lifetime value, customer churn rate, average revenue per account, etc. Pitch your topic with ease and precision using this Customer Lifetime Value Based Success KPIS Dashboard Ppt PowerPoint Presentation Layouts Gridlines PDF. This layout presents information on Average Revenue, Customer Lifetime, Customer Risk. It is also available for immediate download and adjustment. So, changes can be made in the color, design, graphics or any other component to create a unique layout.
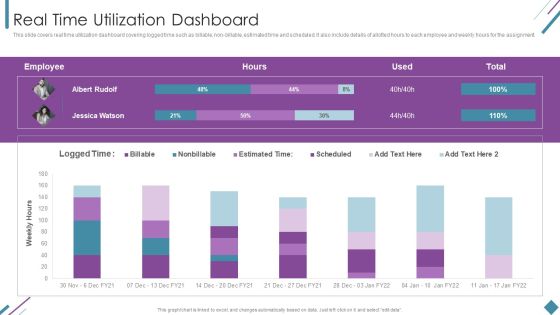
Metrics To Measure Business Performance Real Time Utilization Dashboard Topics PDF
This slide covers real time utilization dashboard covering logged time such as billable, non-billable, estimated time and scheduled. It also include details of allotted hours to each employee and weekly hours for the assignment. Deliver an awe inspiring pitch with this creative Metrics To Measure Business Performance Real Time Utilization Dashboard Topics PDF bundle. Topics like Weekly Hours, Employee, Estimated Time can be discussed with this completely editable template. It is available for immediate download depending on the needs and requirements of the user.
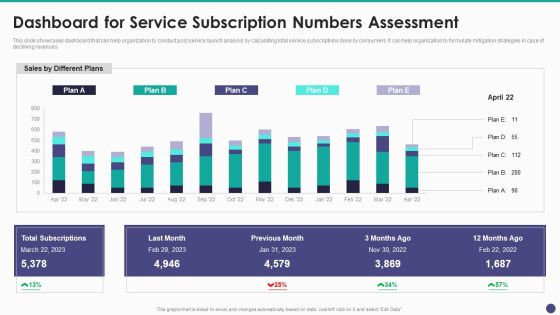
New Service Launch And Development Strategy To Gain Market Share Dashboard For Service Subscription Summary PDF
This slide showcases dashboard that can help organization to conduct post service launch analysis by calculating total service subscriptions done by consumers. It can help organization to formulate mitigation strategies in case of declining revenues.Deliver and pitch your topic in the best possible manner with this New Service Launch And Development Strategy To Gain Market Share Dashboard For Service Subscription Summary PDF Use them to share invaluable insights on Total Subscriptions, Previous Month, Different Plans and impress your audience. This template can be altered and modified as per your expectations. So, grab it now.

Customer Retention Based Success KPIS Dashboard Ppt PowerPoint Presentation Slides Graphics Pictures PDF
This slide covers dashboard for estimation of customer retention based success metrics. It includes KPIs such as net retention rates including expansion, contractions, net MRR, cancelled accounts, etc. Showcasing this set of slides titled Customer Retention Based Success KPIS Dashboard Ppt PowerPoint Presentation Slides Graphics Pictures PDF. The topics addressed in these templates are Account Retention, Cancelled Accounts, Retention Components. All the content presented in this PPT design is completely editable. Download it and make adjustments in color, background, font etc. as per your unique business setting.
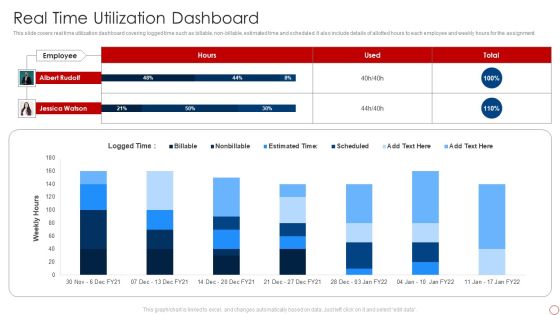
Kpis For Evaluating Business Sustainability Real Time Utilization Dashboard Portrait PDF
This slide covers real time utilization dashboard covering logged time such as billable, non-billable, estimated time and scheduled. It also include details of allotted hours to each employee and weekly hours for the assignment. Deliver an awe inspiring pitch with this creative Kpis For Evaluating Business Sustainability Real Time Utilization Dashboard Portrait PDF bundle. Topics like Logged Time, Employee, Albert Rudolf can be discussed with this completely editable template. It is available for immediate download depending on the needs and requirements of the user.
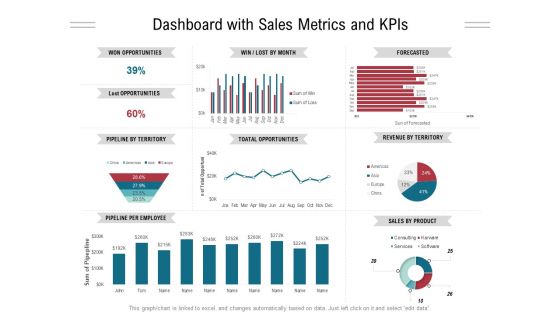
Dashboard With Sales Metrics And Kpis Ppt PowerPoint Presentation Gallery Styles PDF
Presenting this set of slides with name dashboard with sales metrics and kpis ppt powerpoint presentation gallery styles pdf. The topics discussed in these slides are won opportunities, lost opportunities, pipeline by territory, pipeline per employee, forecasted, revenue territory, sales product. This is a completely editable PowerPoint presentation and is available for immediate download. Download now and impress your audience.
Predictive Analytics Methods Predictive Analytics Model Performance Tracking Dashboard Structure PDF
This slide represents the predictive analytics model performance tracking dashboard, and it covers the details of total visitors, total buyers, total products added to the cart, filters by date and category, visitors to clients conversion rate, and so on. Want to ace your presentation in front of a live audience Our Predictive Analytics Methods Predictive Analytics Model Performance Tracking Dashboard Structure PDF can help you do that by engaging all the users towards you. Slidegeeks experts have put their efforts and expertise into creating these impeccable powerpoint presentations so that you can communicate your ideas clearly. Moreover, all the templates are customizable, and easy to edit and downloadable. Use these for both personal and commercial use.

Customer Relationship Strategy For Building Loyalty Business Revenue Dashboard Icons PDF
This slide highlights business dashboard with multiple statistics to estimate the revenue and profitability of company as a result of new customer intimacy strategy. Deliver an awe inspiring pitch with this creative customer relationship strategy for building loyalty business revenue dashboard icons pdf bundle. Topics like average revenue per customer, compared to previous year, customer acquisition cost, cac vs customer lifetime value, revenue can be discussed with this completely editable template. It is available for immediate download depending on the needs and requirements of the user.

Tactical Procedure For Increasing Customer Intimacy Business Revenue Dashboard Diagrams PDF
This slide highlights business dashboard with multiple statistics to estimate the revenue and profitability of company as a result of new customer intimacy strategy. Deliver an awe inspiring pitch with this creative tactical procedure for increasing customer intimacy business revenue dashboard diagrams pdf bundle. Topics like average revenue per customer, compared to previous year, customer acquisition cost, cac vs customer lifetime value, revenue can be discussed with this completely editable template. It is available for immediate download depending on the needs and requirements of the user.
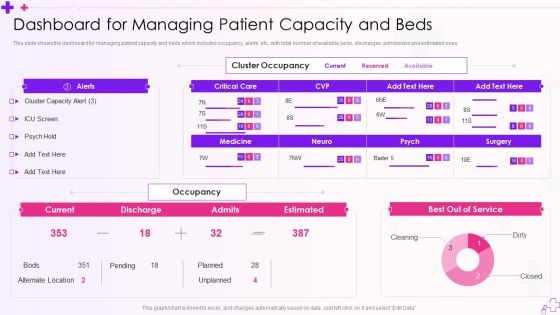
Integration Of Healthcare Center Administration System Dashboard For Managing Patient Capacity And Beds Template PDF
This slide shows the dashboard for managing patient capacity and beds which includes occupancy, alerts, etc, with total number of available beds, discharges, admissions and estimated ones.Deliver and pitch your topic in the best possible manner with this Integration Of Healthcare Center Administration System Dashboard For Managing Patient Capacity And Beds Template PDF Use them to share invaluable insights on Cluster Occupancy, Cluster Capacity, Alternate Location and impress your audience. This template can be altered and modified as per your expectations. So, grab it now.

Operating Profit Margin Dashboard With Income Statement And Expenses Brochure PDF
This slide showcases dashboard that can help organization to estimate the profit generated by organization from its core operations and expenses incurred for different activities. Its key components are operating profit margin, net profit margin, income statement and EBIT. Showcasing this set of slides titled Operating Profit Margin Dashboard With Income Statement And Expenses Brochure PDF. The topics addressed in these templates are Operating Expenses, Income Statement, Gross Profit. All the content presented in this PPT design is completely editable. Download it and make adjustments in color, background, font etc. as per your unique business setting.

Market Intelligence Sales Dashboard Ppt PowerPoint Presentation Model Background Image PDF
Presenting this set of slides with name market intelligence sales dashboard ppt powerpoint presentation model background image pdf. The topics discussed in these slides are forecast product sale, opportunity. This is a completely editable PowerPoint presentation and is available for immediate download. Download now and impress your audience.

Customer Relationship Management Dashboard Digital Marketing Integration In CRM Diagrams PDF
Deliver and pitch your topic in the best possible manner with this customer relationship management dashboard digital marketing integration in crm diagrams pdf. Use them to share invaluable insights on personalized and predictive recommendations, guided selling, customer and product data and impress your audience. This template can be altered and modified as per your expectations. So, grab it now.
Predictive Analytics Model Performance Tracking Dashboard Forward Looking Analysis IT Introduction PDF
This slide represents the predictive analytics model performance tracking dashboard, and it covers the details of total visitors, total buyers, total products added to the cart, filters by date and category, visitors to clients conversion rate, and so on.The Predictive Analytics Model Performance Tracking Dashboard Forward Looking Analysis IT Introduction PDF is a compilation of the most recent design trends as a series of slides. It is suitable for any subject or industry presentation, containing attractive visuals and photo spots for businesses to clearly express their messages. This template contains a variety of slides for the user to input data, such as structures to contrast two elements, bullet points, and slides for written information. Slidegeeks is prepared to create an impression.
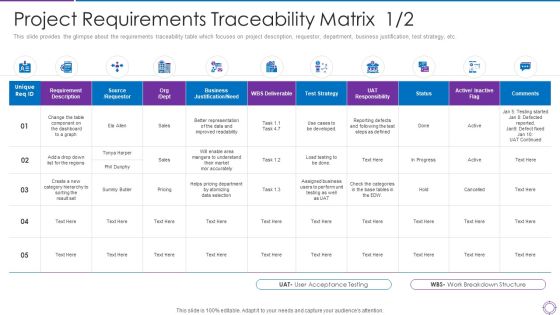
Project Administration Planning Project Requirements Traceability Matrix Business Ppt PowerPoint Presentation File Example PDF
This slide provides the glimpse about the requirements traceability table which focuses on project description, requestor, department, business justification, test strategy, etc. Deliver and pitch your topic in the best possible manner with this project administration planning project requirements traceability matrix business ppt powerpoint presentation file example pdf. Use them to share invaluable insights on dashboard, responsibility, strategy, business, source and impress your audience. This template can be altered and modified as per your expectations. So, grab it now.

Sample Business Asset Valuation Dashboard Guide To Asset Cost Estimation Professional PDF
Following slide displays KPI dashboard for business asset valuation. KPIs covered are number of assets across production line, expected development cost and productivity index.Are you in need of a template that can accommodate all of your creative concepts This one is crafted professionally and can be altered to fit any style. Use it with Google Slides or PowerPoint. Include striking photographs, symbols, depictions, and other visuals. Fill, move around, or remove text boxes as desired. Test out color palettes and font mixtures. Edit and save your work, or work with colleagues. Download Sample Business Asset Valuation Dashboard Guide To Asset Cost Estimation Professional PDF and observe how to make your presentation outstanding. Give an impeccable presentation to your group and make your presentation unforgettable.

Business Dashboard Showing Income And Expenditure Ppt PowerPoint Presentation Pictures Good PDF
Presenting this set of slides with name business dashboard showing income and expenditure ppt powerpoint presentation pictures good pdf. The topics discussed in these slides are actual income, business spending by category, estimated taxes, business income, taxes and licenses, assets, car and truck. This is a completely editable PowerPoint presentation and is available for immediate download. Download now and impress your audience.

Deploying Ai To Enhance Predictive Analytics Dashboard To Track Manufacturing Guidelines PDF
This slide depicts the predictive analytics dashboard to track manufacturing operations, including production volume, order volume, active machines, sales revenue, top five products, downtime causes, production volume by top five machines, and so on. This modern and well-arranged Deploying Ai To Enhance Predictive Analytics Dashboard To Track Manufacturing Guidelines PDF provides lots of creative possibilities. It is very simple to customize and edit with the Powerpoint Software. Just drag and drop your pictures into the shapes. All facets of this template can be edited with Powerpoint, no extra software is necessary. Add your own material, put your images in the places assigned for them, adjust the colors, and then you can show your slides to the world, with an animated slide included.
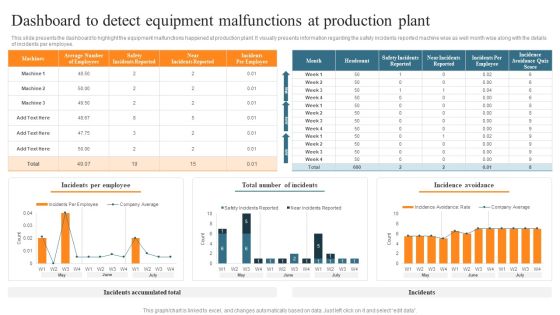
Leveraging Predictive Maintenance To Enhance Production Process Dashboard To Detect Equipment Malfunctions At Production Slides PDF
This slide presents the dashboard to highlight the equipment malfunctions happened at production plant. It visually presents information regarding the safety incidents reported machine wise as well month wise along with the details of incidents per employee. Want to ace your presentation in front of a live audience Our Leveraging Predictive Maintenance To Enhance Production Process Dashboard To Detect Equipment Malfunctions At Production Slides PDF can help you do that by engaging all the users towards you.. Slidegeeks experts have put their efforts and expertise into creating these impeccable powerpoint presentations so that you can communicate your ideas clearly. Moreover, all the templates are customizable, and easy-to-edit and downloadable. Use these for both personal and commercial use.
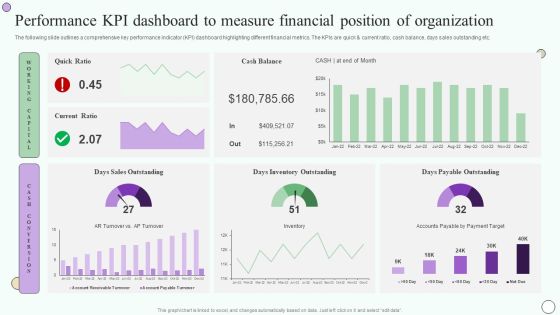
Estimating Business Overall Performance Kpi Dashboard To Measure Financial Position Inspiration PDF
The following slide outlines a comprehensive key performance indicator KPI dashboard highlighting different financial metrics. The KPIs are quick and current ratio, cash balance, days sales outstanding etc. Welcome to our selection of the Estimating Business Overall Performance Kpi Dashboard To Measure Financial Position Inspiration PDF. These are designed to help you showcase your creativity and bring your sphere to life. Planning and Innovation are essential for any business that is just starting out. This collection contains the designs that you need for your everyday presentations. All of our PowerPoints are 100 percent editable, so you can customize them to suit your needs. This multi-purpose template can be used in various situations. Grab these presentation templates today.

Project Estimate Your Investment For Project Quote Proposal Ppt Portfolio Files PDF
Presenting this set of slides with name project estimate your investment for project quote proposal ppt portfolio files pdf. The topics discussed in these slides are data mining, analysis, report compilation, research, price. This is a completely editable PowerPoint presentation and is available for immediate download. Download now and impress your audience.

Dashboard Showing Sales Gap Analysis Ppt PowerPoint Presentation Infographic Template Graphics Pictures PDF
Presenting this set of slides with name dashboard showing sales gap analysis ppt powerpoint presentation infographic template graphics pictures pdf. The topics discussed in these slides are bookings month, total forecast month open opportumities, forecasted value closing number deals month, sales cycle, bookings this quarter, goal. This is a completely editable PowerPoint presentation and is available for immediate download. Download now and impress your audience.

CRM System Competitive Dashboard With Sales Pipeline Ppt PowerPoint Presentation Icon Outfit PDF
Showcasing this set of slides titled crm system competitive dashboard with sales pipeline ppt powerpoint presentation icon outfit pdf. The topics addressed in these templates are sales forecast by competitor, win loss report, open opportunity revenue by competitor, sales pipeline by sales rep, competitor. All the content presented in this PPT design is completely editable. Download it and make adjustments in color, background, font etc. as per your unique business setting.

Sales Process Management To Boost Dashboard Showing Sales Pipeline Opportunities Topics PDF
This slide shows the process steps followed by the company for the recruitment of new employees. It stars from Identifying the hiring needs and ends with employment offer.Deliver an awe inspiring pitch with this creative Sales Process Management To Boost Dashboard Showing Sales Pipeline Opportunities Topics PDF bundle. Topics like Sales Funnel, Forecast Summary, Opportunities can be discussed with this completely editable template. It is available for immediate download depending on the needs and requirements of the user.
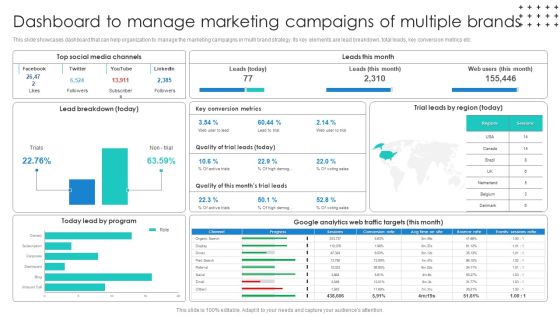
Promotional Techniques To Market Several Brands Among Target Groups Dashboard To Manage Background PDF
This slide showcases dashboard that can help organization to track the visitors on landing pages of different brands. Its key elements are forecast purchasers, customer acquisition cost and visitors count by landing pages. Slidegeeks is one of the best resources for PowerPoint templates. You can download easily and regulate Promotional Techniques To Market Several Brands Among Target Groups Dashboard To Manage Background PDF for your personal presentations from our wonderful collection. A few clicks is all it takes to discover and get the most relevant and appropriate templates. Use our Templates to add a unique zing and appeal to your presentation and meetings. All the slides are easy to edit and you can use them even for advertisement purposes.
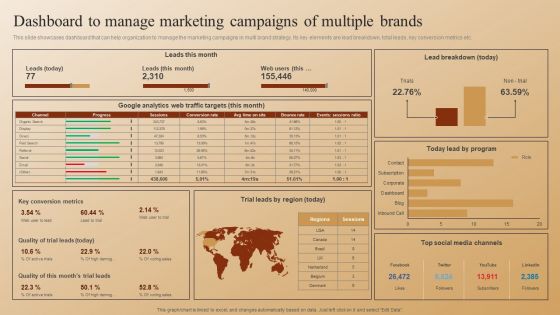
Establishing A Brand Identity For Organizations With Several Brands Dashboard To Manage Marketing Campaigns Sample PDF
This slide showcases dashboard that can help organization to manage the marketing campaigns in multi brand strategy. Its key elements are lead breakdown, total leads, key conversion metrics etc. Its key elements are forecast purchasers, customer acquisition cost and visitors count by landing pages. Want to ace your presentation in front of a live audience Our Establishing A Brand Identity For Organizations With Several Brands Dashboard To Manage Marketing Campaigns Sample PDFcan help you do that by engaging all the users towards you. Slidegeeks experts have put their efforts and expertise into creating these impeccable powerpoint presentations so that you can communicate your ideas clearly. Moreover, all the templates are customizable, and easy-to-edit and downloadable. Use these for both personal and commercial use.
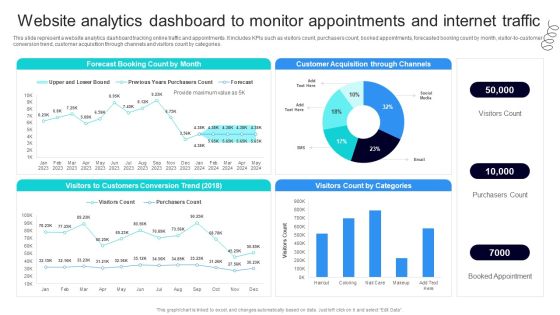
Strategic Marketing For Hair And Beauty Salon To Increase Website Analytics Dashboard Ideas PDF
This slide represent a website analytics dashboard tracking online traffic and appointments. It includes KPIs such as visitors count, purchasers count, booked appointments, forecasted booking count by month, visitor-to-customer conversion trend, customer acquisition through channels and visitors count by categories. Slidegeeks has constructed Strategic Marketing For Hair And Beauty Salon To Increase Website Analytics Dashboard Ideas PDF after conducting extensive research and examination. These presentation templates are constantly being generated and modified based on user preferences and critiques from editors. Here, you will find the most attractive templates for a range of purposes while taking into account ratings and remarks from users regarding the content. This is an excellent jumping off point to explore our content and will give new users an insight into our top notch PowerPoint Templates.

Dashboard To Track Website Visitors On Brand Landing Pages Mockup PDF
This slide showcases dashboard that can help organization to track the visitors on landing pages of different brands. Its key elements are forecast purchasers, customer acquisition cost and visitors count by landing pages.Are you in need of a template that can accommodate all of your creative concepts This one is crafted professionally and can be altered to fit any style. Use it with Google Slides or PowerPoint. Include striking photographs, symbols, depictions, and other visuals. Fill, move around, or remove text boxes as desired. Test out color palettes and font mixtures. Edit and save your work, or work with colleagues. Download Dashboard To Track Website Visitors On Brand Landing Pages Mockup PDF and observe how to make your presentation outstanding. Give an impeccable presentation to your group and make your presentation unforgettable.

Dashboard To Track Website Visitors On Brand Landing Pages Ppt PowerPoint Presentation File Files PDF
This slide showcases dashboard that can help organization to track the visitors on landing pages of different brands. Its key elements are forecast purchasers, customer acquisition cost and visitors count by landing pages. This modern and well arranged Dashboard To Track Website Visitors On Brand Landing Pages Ppt PowerPoint Presentation File Files PDF provides lots of creative possibilities. It is very simple to customize and edit with the Powerpoint Software. Just drag and drop your pictures into the shapes. All facets of this template can be edited with Powerpoint no extra software is necessary. Add your own material, put your images in the places assigned for them, adjust the colors, and then you can show your slides to the world, with an animated slide included.

 Home
Home