Progress Infographic
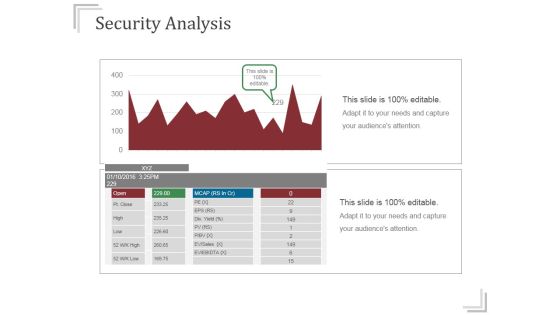
Security Analysis Ppt PowerPoint Presentation Infographics
This is a security analysis ppt powerpoint presentation infographics. This is a two stage process. The stages in this process are business, finance, growth, analysis, success.
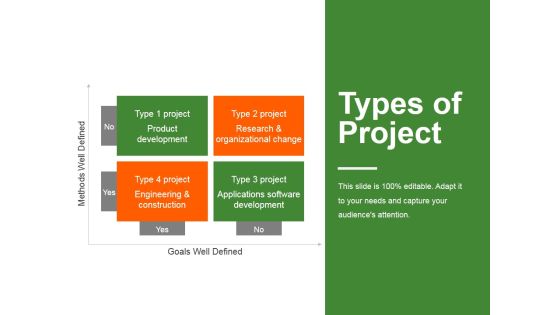
Types Of Project Ppt PowerPoint Presentation Infographics
This is a types of project ppt powerpoint presentation infographics. This is a four stage process. The stages in this process are product development, research and organizational change, engineering and construction, applications software development.

Tqm Principles Ppt PowerPoint Presentation Model Infographics
This is a tqm principles ppt powerpoint presentation model infographics. This is a eight stage process. The stages in this process are supplier relationship, decision making, continual improvement, strategic approach, process approach.
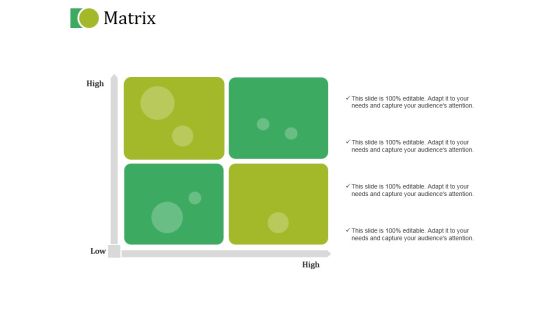
Matrix Ppt PowerPoint Presentation Show Infographics
This is a matrix ppt powerpoint presentation show infographics. This is a four stage process. The stages in this process are high, low, matrix, strategy, planning.
Marketing Launch Plan Ppt PowerPoint Presentation Infographics
This is a marketing launch plan ppt powerpoint presentation infographics. This is a one stage process. The stages in this process are business, marketing, management, launching, planning.
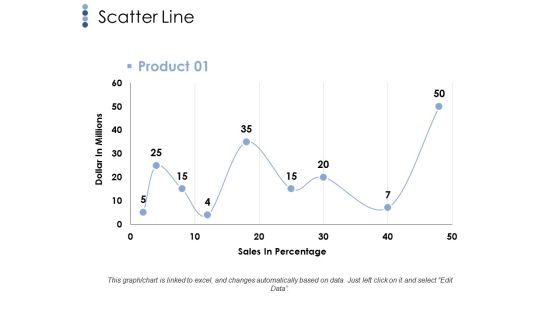
Scatter Line Ppt PowerPoint Presentation File Infographics
This is a scatter line ppt powerpoint presentation file infographics. This is a one stage process. The stages in this process are scatter line, dollar in millions, sales in percentage, business.
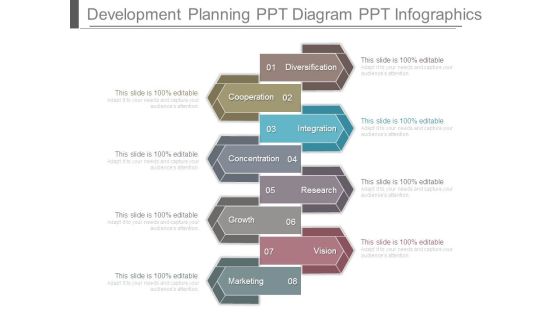
Development Planning Ppt Diagram Ppt Infographics
This is a development planning ppt diagram ppt infographics. This is a eight stage process. The stages in this process are diversification, cooperation, integration, concentration, research, growth, vision, marketing.
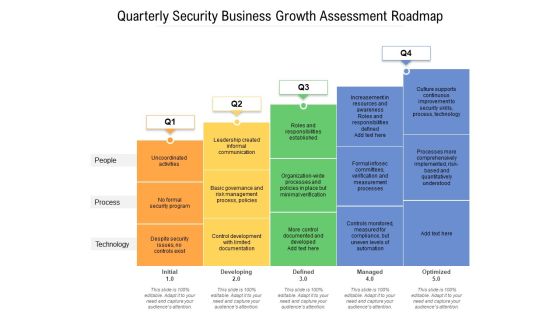
Quarterly Security Business Growth Assessment Roadmap Infographics
Presenting our jaw-dropping quarterly security business growth assessment roadmap infographics. You can alternate the color, font size, font type, and shapes of this PPT layout according to your strategic process. This PPT presentation is compatible with Google Slides and is available in both standard screen and widescreen aspect ratios. You can also download this well-researched PowerPoint template design in different formats like PDF, JPG, and PNG. So utilize this visually-appealing design by clicking the download button given below.

Combo Chart Ppt PowerPoint Presentation Portfolio Infographics
This is a combo chart ppt powerpoint presentation portfolio infographics. This is a eight stage process. The stages in this process are market size, growth, years, finance, business.

Area Chart Ppt PowerPoint Presentation Professional Infographics
This is a area chart ppt powerpoint presentation professional infographics. This is a two stage process. The stages in this process are business, strategy, analysis, planning, area chart.

Successful Ecommerce Business Models Ppt Infographics
This is a successful ecommerce business models ppt infographics. This is a five stage process. The stages in this process are decide, register, open, obtain, launch.
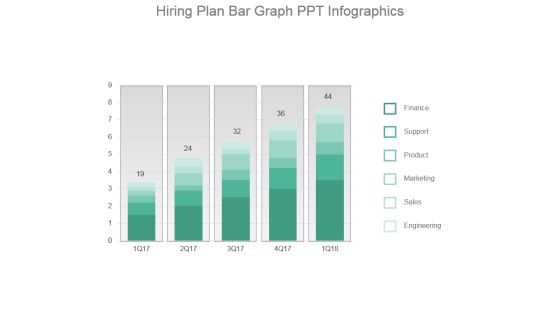
Hiring Plan Bar Graph Ppt Infographics
This is a hiring plan bar graph ppt infographics. This is a five stage process. The stages in this process are finance, support, product, marketing, sales, engineering.
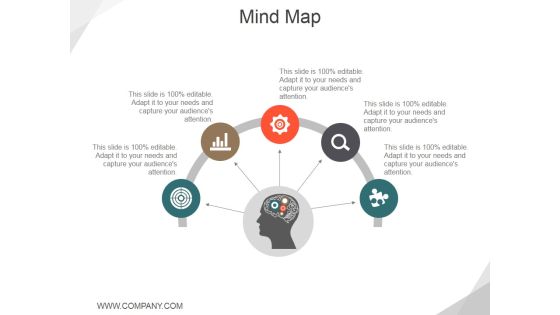
Mind Map Ppt PowerPoint Presentation File Infographics
This is a mind map ppt powerpoint presentation file infographics. This is a five stage process. The stages in this process are semi, icons, management, strategy.

Risk Tolerance Ppt PowerPoint Presentation Summary Infographics
This is a risk tolerance ppt powerpoint presentation summary infographics. This is a three stage process. The stages in this process are high, medium, low.

Combo Chart Ppt PowerPoint Presentation Professional Infographics
This is a combo chart ppt powerpoint presentation professional infographics. This is a three stage process. The stages in this process are combo chart, market size, product.
Our Mission Ppt PowerPoint Presentation Show Infographics
This is a our mission ppt powerpoint presentation show infographics. This is a two stage process. The stages in this process are vision, mission.

Exit Strategy Ppt PowerPoint Presentation Outline Infographics
This is a exit strategy ppt powerpoint presentation outline infographics. This is a one stage process. The stages in this process are acquisition, financial buyer, ipo.
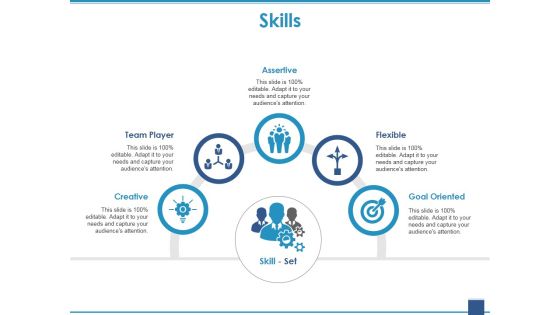
Skills Ppt PowerPoint Presentation Model Infographics
This is a skills ppt powerpoint presentation model infographics. This is a five stage process. The stages in this process are assertive, team player, creative, flexible, goal oriented.
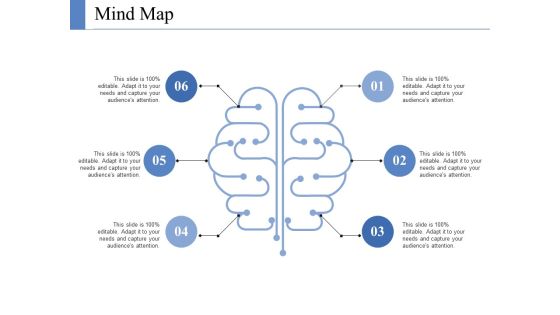
Mind Map Ppt PowerPoint Presentation Layouts Infographics
This is a mind map ppt powerpoint presentation layouts infographics. This is a six stage process. The stages in this process are mind map, marketing, strategy, planning, technology.

Training Evaluation Ppt PowerPoint Presentation File Infographics
This is a training evaluation ppt powerpoint presentation file infographics. This is a four stage process. The stages in this process are results, behavior, learning, reaction, business.
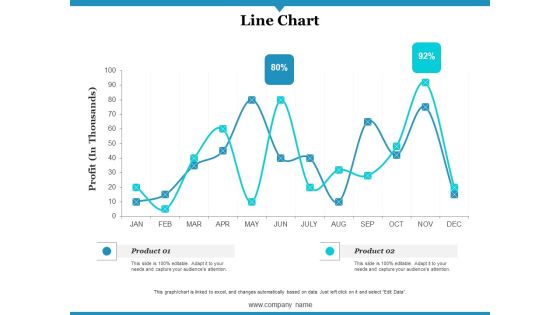
Line Chart Ppt PowerPoint Presentation Gallery Infographics
This is a line chart ppt powerpoint presentation gallery infographics. This is a two stage process. The stages in this process are profit, product, line chart.

Secondary Activities Ppt PowerPoint Presentation File Infographics
This is a secondary activities ppt powerpoint presentation file infographics. This is a four stage process. The stages in this process are procurement, human resource management, technology development, infrastructure, business.
Our Mission Ppt PowerPoint Presentation Gallery Infographics
This is a our mission ppt powerpoint presentation gallery infographics. This is a four stage process. The stages in this process are business, success, management, strategy, development.
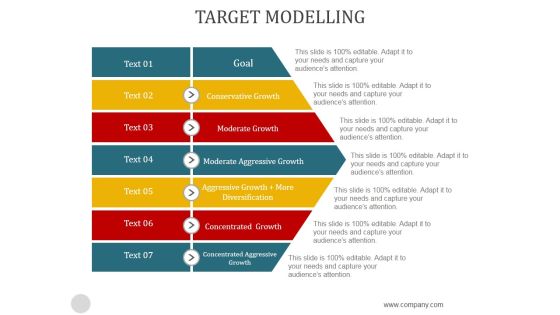
Target Modelling Ppt PowerPoint Presentation Infographics
This is a target modelling ppt powerpoint presentation infographics. This is a seven stage process. The stages in this process are conservative growth, moderate growth, moderate aggressive growth, aggressive growth more diversification, concentrated growth, concentrated aggressive, growth, goal.

Project Planning Process Ppt PowerPoint Presentation Infographics
This is a project planning process ppt powerpoint presentation infographics. This is a seven stage process. The stages in this process are project charter scope, project resource, project quality, project communication, project schedule, project budget and cost, project risk.

About Us Ppt PowerPoint Presentation Infographics
This is a about us ppt powerpoint presentation infographics. This is a one stage process. The stages in this process are business, strategy, analysis, about us, icons.

Sales Breakdown Ppt PowerPoint Presentation Summary Infographics
This is a sales breakdown ppt powerpoint presentation summary infographics. This is a four stage process. The stages in this process are per channel, per region.
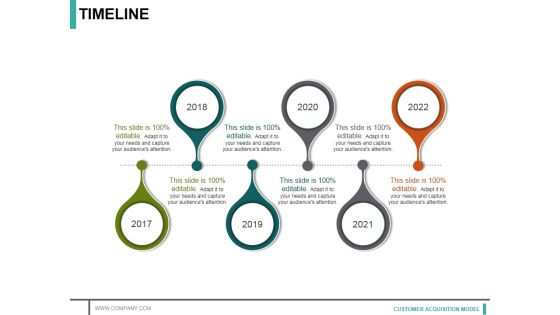
Timeline Ppt PowerPoint Presentation Model Infographics
This is a timeline ppt powerpoint presentation model infographics. This is a six stage process. The stages in this process are year, growth, success, time planning, business.
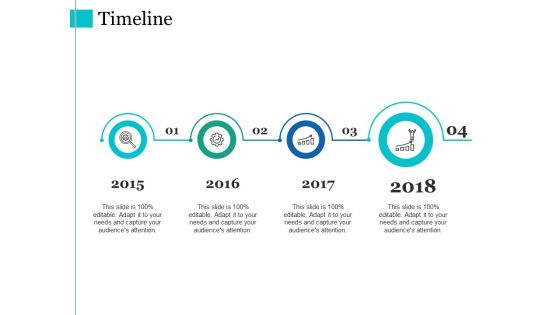
Timeline Ppt PowerPoint Presentation Styles Infographics
This is a timeline ppt powerpoint presentation styles infographics. This is a four stage process. The stages in this process are year, growth, success, time planning, business.

Basic Enhancement Template Diagram Ppt Infographics
This is a basic enhancement template diagram ppt infographics. This is a four stage process. The stages in this process are creative, problem, insight, solution.

Corporate Innovation Performance Diagram Ppt Infographics
This is a corporate innovation performance diagram ppt infographics. This is a six stage process. The stages in this process are value partners, operational innovation, customer experience, strategic resources, business strategy, product innovation.

Campaign Performance Ppt Powerpoint Presentation Summary Infographics
This is a campaign performance ppt powerpoint presentation summary infographics. This is a four stage process. The stages in this process are delivery rate, open rate, click rate, conversion rate.

Financial Measures Ppt PowerPoint Presentation Model Infographics
This is a financial measures ppt powerpoint presentation model infographics. This is a seven stage process. The stages in this process are cost of raw material, revenue from goods sold, inventory holding cost, transportation cost, cost of expired perishable goods.

Brand Pricing Ppt PowerPoint Presentation Icon Infographics
This is a brand pricing ppt powerpoint presentation icon infographics. This is a four stage process. The stages in this process are superior quality, brand, value for money, economical.

Timeline Template 1 Ppt PowerPoint Presentation Infographics
This is a timeline template 1 ppt powerpoint presentation infographics. This is a three stage process. The stages in this process are year, time planning, growth, success.
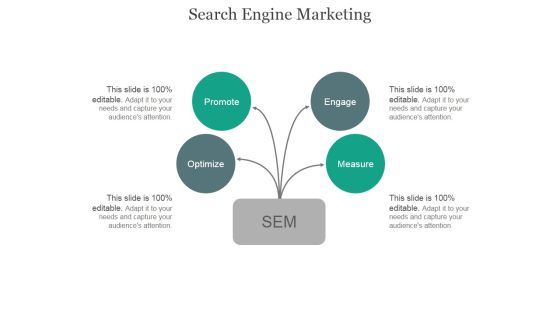
Search Engine Marketing Ppt PowerPoint Presentation Infographics
This is a search engine marketing ppt powerpoint presentation infographics. This is a four stage process. The stages in this process are optimize, promote, engage, measure.

Bar Chart Ppt PowerPoint Presentation Outline Infographics
This is a bar chart ppt powerpoint presentation outline infographics. This is a two stage process. The stages in this process are bar chart, finance, marketing, strategy, analysis, business.
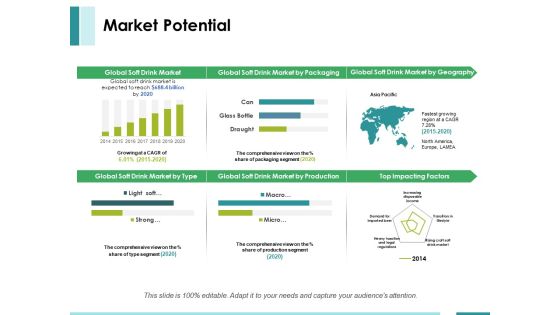
Market Potential Ppt PowerPoint Presentation Pictures Infographics
This is a market potential ppt powerpoint presentation pictures infographics. This is a two stage process. The stages in this process are top impacting factors, asia pacific, global soft drink market by type, global soft drink market.

Modern Business Infographics Design PowerPoint Templates
Use our above slide displays modern business Infographics. This template has been designed with text boxes and icons. Blend your views with this professional image.
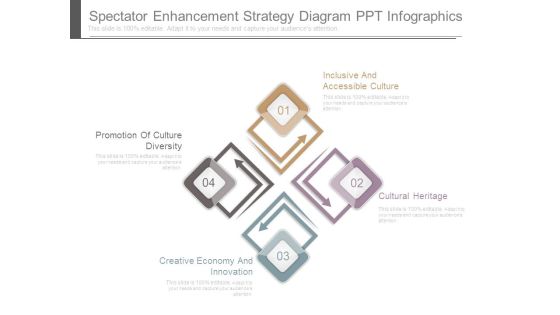
Spectator Enhancement Strategy Diagram Ppt Infographics
This is a spectator enhancement strategy diagram ppt infographics. This is a four stage process. The stages in this process are promotion of culture diversity, creative economy and innovation, cultural heritage, inclusive and accessible culture.
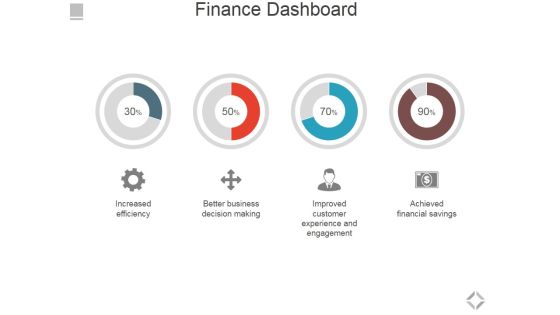
Finance Dashboard Ppt PowerPoint Presentation Layouts Infographics
This is a finance dashboard ppt powerpoint presentation layouts infographics. This is a four stage process. The stages in this process are increased efficiency, better business decision making, improved customer experience and engagement, achieved financial savings.

Magnifying Glass Ppt PowerPoint Presentation Infographics
This is a magnifying glass ppt powerpoint presentation infographics. This is a five stage process. The stages in this process are business, marketing, management, process, magnifier glass.
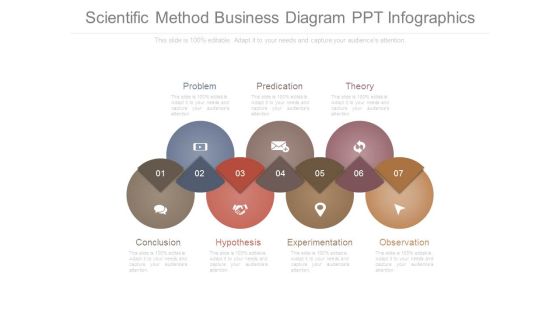
Scientific Method Business Diagram Ppt Infographics
This is a scientific method business diagram ppt infographics. This is a seven stage process. The stages in this process are conclusion, problem, hypothesis, predication, experimentation, theory, observation.
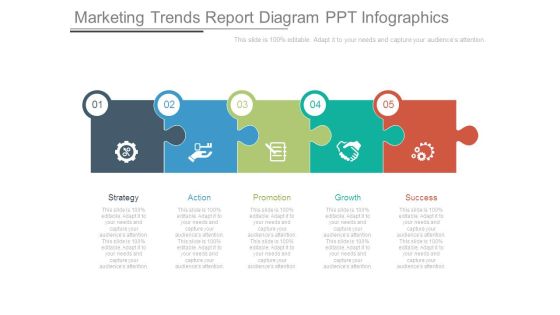
Marketing Trends Report Diagram Ppt Infographics
This is a marketing trends report diagram ppt infographics. This is a five stage process. The stages in this process are strategy, action, promotion, growth, success.

Departments And Team Ppt PowerPoint Presentation Infographics
This is a departments and team ppt powerpoint presentation infographics. This is a three stage process. The stages in this process are product manager, graphic designer, web designer, marketing, ceo.

Market Budget Ppt PowerPoint Presentation Infographics
This is a market budget ppt powerpoint presentation infographics. This is a five stage process. The stages in this process are marketing objectives, target marketing, business opportunities, competition, product and services.
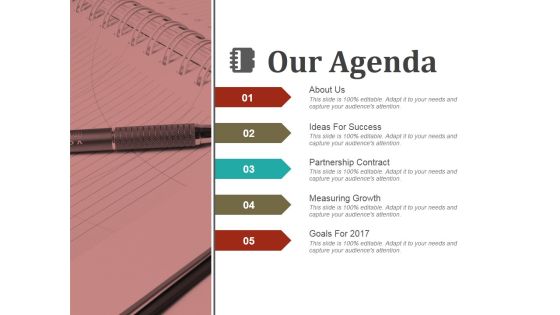
Our Agenda Ppt PowerPoint Presentation Infographics
This is a our agenda ppt powerpoint presentation infographics. This is a five stage process. The stages in this process are about us, ideas for success, partnership contract, measuring growth.

Company Name Template3 Ppt PowerPoint Presentation Infographics
This is a company name template3 ppt powerpoint presentation infographics. This is a three stage process. The stages in this process are vision, mission, goal.
Funnel Ppt PowerPoint Presentation Icon Infographics
This is a funnel ppt powerpoint presentation icon infographics. This is a four stage process. The stages in this process are business, marketing, funnel, process, planning.

Infographics For Business Level Strategies PowerPoint Templates
This PowerPoint template contains four level Infographics. This diagram has been designed with four tags with icons to depict business level strategies. Use this diagram to set targets and to measure performance in your presentations.
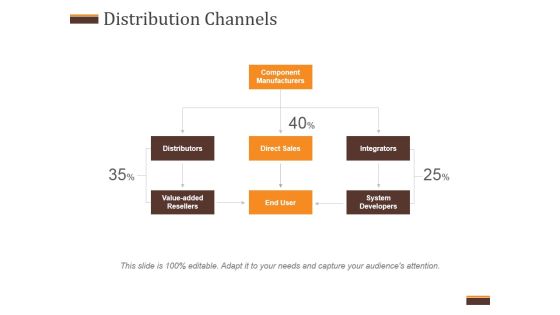
Distribution Channels Ppt PowerPoint Presentation Infographics
This is a distribution channels ppt powerpoint presentation infographics. This is a three stage process. The stages in this process are component manufacturers, distributors, direct sales, integrators, value added resellers, end user, system developers.

Biotech Industry Report Diagram Ppt Infographics
This is a biotech industry report diagram ppt infographics. This is a four stage process. The stages in this process are agriculture, chemicals, phar maceuticals, information technology.

Channel Management Decisions Diagram Ppt Infographics
This is a channel management decisions diagram ppt infographics. This is a four stage process. The stages in this process are decide, observe, act, selecting.

Business Inventory Accounting Diagram Ppt Infographics
This is a business inventory accounting diagram ppt infographics. This is a three stage process. The stages in this process are beginning inventory, purchases, goods available for sale, cost goods sold, ending inventory.

Radar Chart Ppt PowerPoint Presentation Styles Infographics
This is a radar chart ppt powerpoint presentation styles infographics. This is a six stage process. The stages in this process are business, marketing, product, radar chart, strategy.
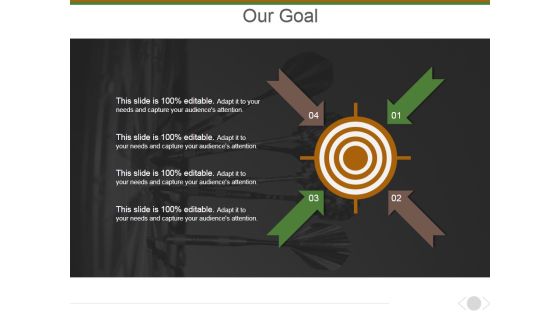
Our Goal Ppt PowerPoint Presentation Model Infographics
This is a our goal ppt powerpoint presentation model infographics. This is a four stage process. The stages in this process are goal, arrows, planning, process, business.

Generate Idea Ppt PowerPoint Presentation Layouts Infographics
This is a generate idea ppt powerpoint presentation layouts infographics. This is a one stage process. The stages in this process are business, marketing, analysis, strategy, idea bulb.

Milestones Achieved Ppt PowerPoint Presentation Infographics
This is a milestones achieved ppt powerpoint presentation infographics. This is a five stage process. The stages in this process are business, strategy, marketing, analysis, success, time line.

Mind Map Ppt PowerPoint Presentation Infographics
This is a mind map ppt powerpoint presentation infographics. This is a one stage process. The stages in this process are mind map, icons, memory, analysis, success, management.
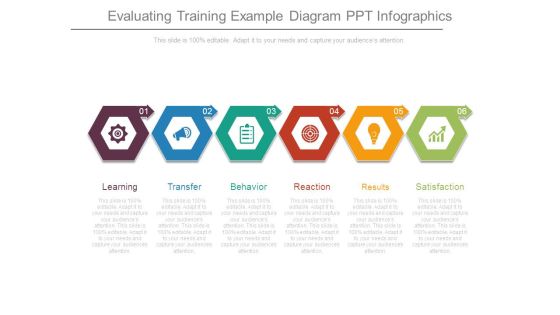
Evaluating Training Example Diagram Ppt Infographics
This is a evaluating training example diagram ppt infographics. This is a six stage process. The stages in this process are learning, transfer, behavior, reaction, results, satisfaction.
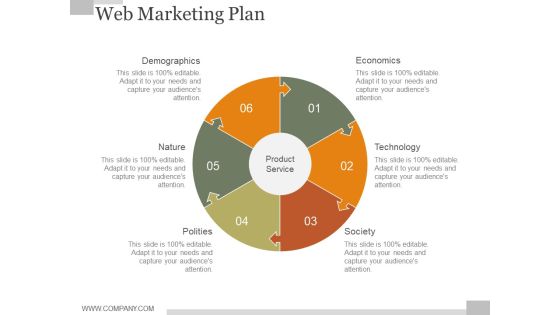
Web Marketing Plan Ppt PowerPoint Presentation Infographics
This is a web marketing plan ppt powerpoint presentation infographics. This is a six stage process. The stages in this process are demographics, nature, polities, economics, technology, society.
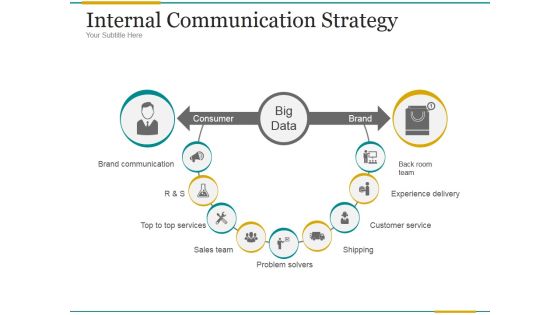
Internal Communication Strategy Ppt PowerPoint Presentation Infographics
This is a internal communication strategy ppt powerpoint presentation infographics. This is a nine stage process. The stages in this process are consumer brand, backroom team, experience delivery, customer service, shipping, problem solvers, sales team, top to top services, brand communication.
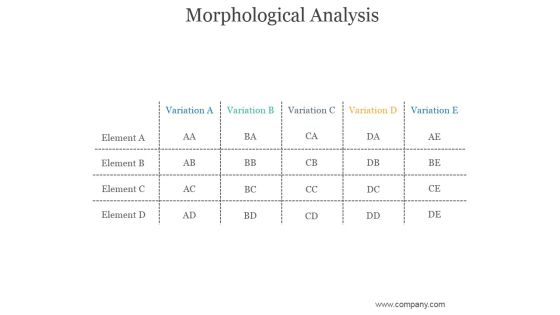
Morphological Analysis Ppt PowerPoint Presentation Infographics
This is a morphological analysis ppt powerpoint presentation infographics. This is a five stage process. The stages in this process are variation, element, business, marketing, success.
Timeline Ppt PowerPoint Presentation Icon Infographics
This is a timeline ppt powerpoint presentation icon infographics. This is a five stage process. The stages in this process are timeline, business, marketing, success, planning.
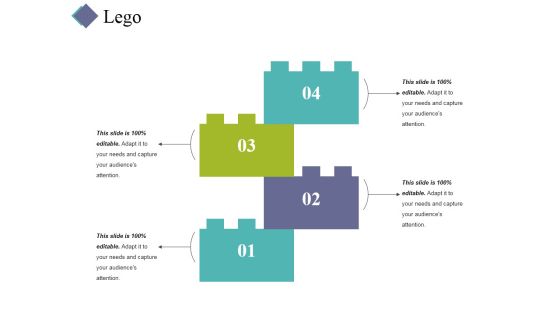
Lego Ppt PowerPoint Presentation Outline Infographics
This is a lego ppt powerpoint presentation outline infographics. This is a four stage process. The stages in this process are lego, sports, management, business, success.

Customer Segmentation Layout Ppt PowerPoint Presentation Infographics
This is a customer segmentation layout ppt powerpoint presentation infographics. This is a four stage process. The stages in this process are target market, unaware, aware, negative opinion, neutral, favorable, opinion, rejecter.
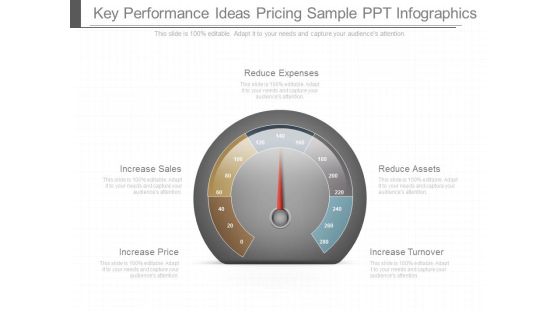
Key Performance Ideas Pricing Sample Ppt Infographics
This is a key performance ideas pricing sample ppt infographics. This is a five stage process. The stages in this process are increase price, increase sales, reduce expenses, reduce assets, increase turnover.
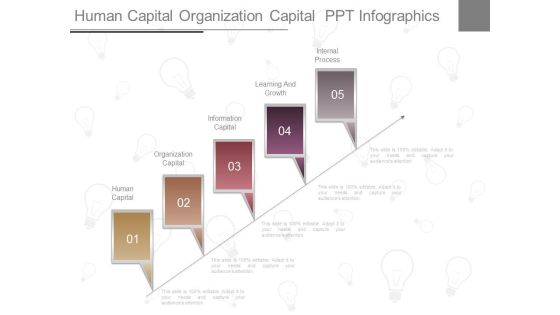
Human Capital Organization Capital Ppt Infographics
This is a human capital organization capital ppt infographics. This is a five stage process. The stages in this process are human capital, organization capital, information capital, learning and growth, internal process.

Quality Management System Essentials Ppt Infographics
This is a quality management system essentials ppt infographics. This is a four stage process. The stages in this process are continual improvement, ethics, quality policy and strategy, quality assurance, training, management support, quality control, standard operating procedures.

Exit Strategy Ppt PowerPoint Presentation Infographics
This is a exit strategy ppt powerpoint presentation infographics. This is a two stage process. The stages in this process are failure, success.

Objectives Of Organizational Change Diagram Ppt Infographics
This is a objectives of organizational change diagram ppt infographics. This is a five stage process. The stages in this process are organizational structure, limited resources, incompatible, implement intervention, evaluate performance and learning.
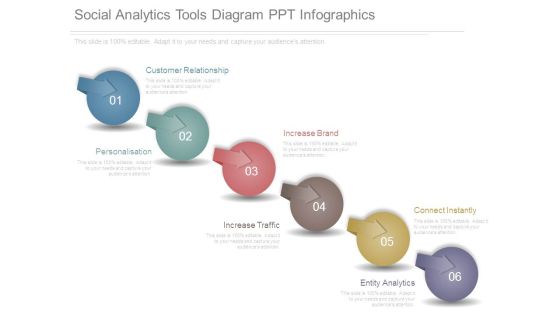
Social Analytics Tools Diagram Ppt Infographics
This is a social analytics tools diagram ppt infographics. This is a six stage process. The stages in this process are customer relationship, personalisation, increase brand, increase traffic, connect instantly, entity analytics.

Corporate Workflow Solutions Template Ppt Infographics
This is a corporate workflow solutions template ppt infographics. This is a five stage process. The stages in this process are reliable research management, electronic document management, automated work paper management, paperless tax management, streamlined fixed assets management.

Target With Arrow Ppt PowerPoint Presentation Infographics
This is a target with arrow ppt powerpoint presentation infographics. This is a five stage process. The stages in this process are situation analysis, digital media, online partner analysis, objective setting, mission and vision.

Why Six Sigma Ppt PowerPoint Presentation Infographics
This is a why six sigma ppt powerpoint presentation infographics. This is a five stage process. The stages in this process are bottom line, trained individuals, engagement, project by project, customer focused.

Principles Of Change Ppt PowerPoint Presentation Infographics
This is a principles of change ppt powerpoint presentation infographics. This is a seven stage process. The stages in this process are resistance and comfort, authority for change, value systems, incremental vs radical change, the right answer is not enough, change is a process, senders and receivers.

Quarterly Training Development And Implementation Roadmap Infographics
Presenting our jaw-dropping quarterly training development and implementation roadmap infographics. You can alternate the color, font size, font type, and shapes of this PPT layout according to your strategic process. This PPT presentation is compatible with Google Slides and is available in both standard screen and widescreen aspect ratios. You can also download this well-researched PowerPoint template design in different formats like PDF, JPG, and PNG. So utilize this visually-appealing design by clicking the download button given below.
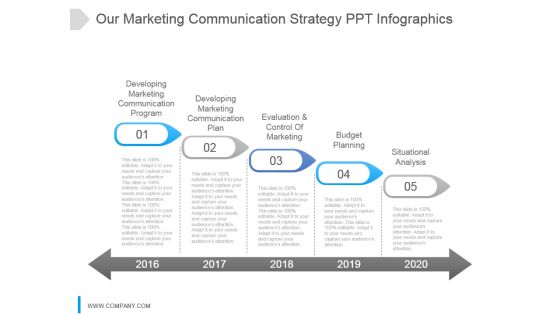
Our Marketing Communication Strategy Ppt Infographics
This is a our marketing communication strategy ppt infographics. This is a five stage process. The stages in this process are developing marketing communication program, developing marketing communication plan, evaluation and control of marketing, budget planning, situational analysis.

Action Plan For Objectives Ppt Infographics
This is a action plan for objectives ppt infographics. This is a four stage process. The stages in this process are objectives, tasks, success criteria, time frame, resources, room, time period.

Technical Department Strategic Development Quarterly Roadmap Infographics
Presenting the technical department strategic development quarterly roadmap infographics. The template includes a roadmap that can be used to initiate a strategic plan. Not only this, the PowerPoint slideshow is completely editable and you can effortlessly modify the font size, font type, and shapes according to your needs. This PPT slide can be easily reached in standard screen and widescreen aspect ratios. The set is also available in various formats like PDF, PNG, and JPG. So download and use it multiple times as per your knowledge.
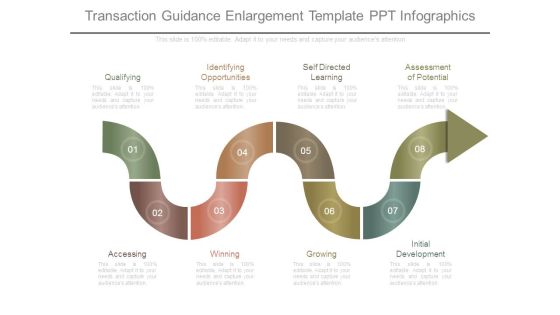
Transaction Guidance Enlargement Template Ppt Infographics
This is a transaction guidance enlargement template ppt infographics. This is a eight stage process. The stages in this process are qualifying, accessing, identifying opportunities, winning, self directed learning, growing, assessment of potential, initial development.

Organizational Design For Innovation Ppt Infographics
This is a organizational design for innovation ppt infographics. This is a five stage process. The stages in this process are projects, r and d, market development, business plans, long term marketing.

Work Breakdown Structure Ppt PowerPoint Presentation Infographics
This is a work breakdown structure ppt powerpoint presentation infographics. This is a five stage process. The stages in this process are fulfilment customer data protection, project management, regulations impact analysis, help desk process, system development, communication, scope narrative.

Geographical Footprint Ppt PowerPoint Presentation Professional Infographics
This is a geographical footprint ppt powerpoint presentation professional infographics. This is a four stage process. The stages in this process are engineering facilities, business development and customer support facilities, offshore facility proposed, company xx facilities.
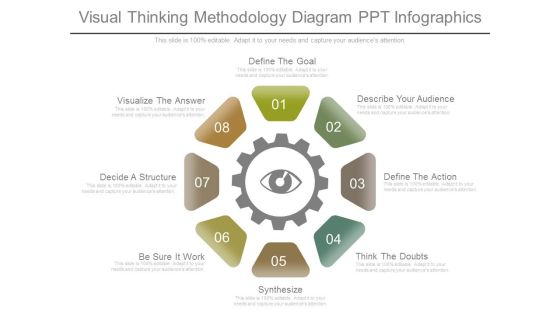
Visual Thinking Methodology Diagram Ppt Infographics
This is a visual thinking methodology diagram ppt infographics. This is a eight stage process. The stages in this process are define the goal, describe your audience, define the action, think the doubts, synthesize, be sure it work, decide a structure, visualize the answer.

Content Fundamentals Ppt PowerPoint Presentation Infographics
Presenting this set of slides with name content fundamentals ppt powerpoint presentation infographics. This is a seven stage process. The stages in this process are fundamentals, business, viable product, measuring, success. This is a completely editable PowerPoint presentation and is available for immediate download. Download now and impress your audience.
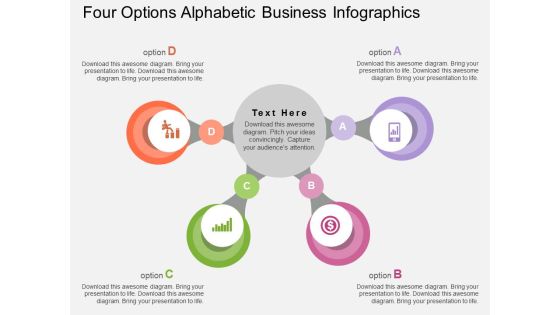
Four Options Alphabetic Business Infographics Powerpoint Template
The above PPT template displays layout of four options alphabetic steps. This diagram helps to exhibit steps to perform business action. Adjust the above diagram in your business presentations to visually support your content.

Business Goal Strategy Infographics Layout Powerpoint Template
Visually support your presentation with our above template containing graphic of zigzag path towards goal. This diagram slide helps to portray goal achievement process. Etch your views in the brains of your audience with this diagram slide.

Colorful Infographics For Business Process Powerpoint Templates
Our professionally designed business diagram is as an effective tool for communicating ideas and planning. It contains circular graphics for project task and resources. Convey your views with this diagram slide. It will amplify the strength of your logic.
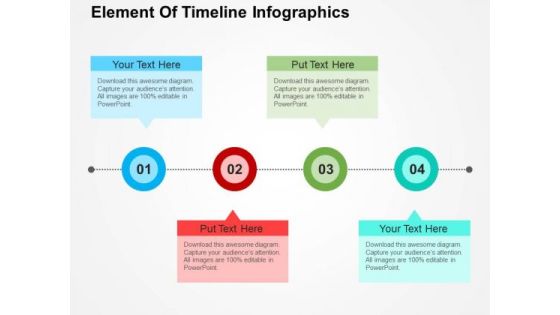
Element Of Timeline Infographics PowerPoint Templates
This pre-designed and appealing graphics offer an optimized possibility to illustrate your business strategy. This slide displays steps of business timeline. You can present your opinions using this impressive slide related to solution, strategy etc.

Balloons Infographics For Communication Process PowerPoint Templates
This business slide has been designed with graphics of balloons with icons. Download this diagram to portray concepts like growth, finance, marketing, and communication. This slide is innovatively designed to highlight your worthy view.
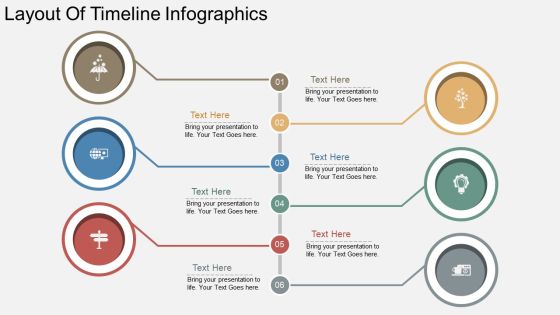
Layout Of Timeline Infographics PowerPoint Template
This PowerPoint slide is one of our formal slides used by corporate sector and business houses. The slide can be effectively used to describe various steps of a process occurring in a systematic manner. Icons can be modified according to particular processes and enough space has been left to add text to describe the steps and their effects in details. The slide can also be the perfect option to explain various departments in an organization or to explain the roles of each department. This can effectively explain the hierarchy in an organization and the flow of communication and orders that are to be followed in an organization or a company. The template is customizable and icons can and font can be edited to add appropriate ones.

Step By Step Planning Infographics PowerPoint Templates
The above slide displays five text boxes with icons. This template has been designed to present market plan and analysis. Imprint your concepts with this PPT slide in your presentations.

Four Arrows Tags Infographics Powerpoint Template
The above PowerPoint slide displays four arrows design with icons. This PowerPoint diagram helps to summarize complex business data. Adjust the above diagram in your business presentations to visually support your content.

Circle Infographics For Visual Representation Powerpoint Template
This business slide provides background for four option display. Display the options, business steps or workflow using this diagram as a tool. You can present your opinions using this impressive slide.
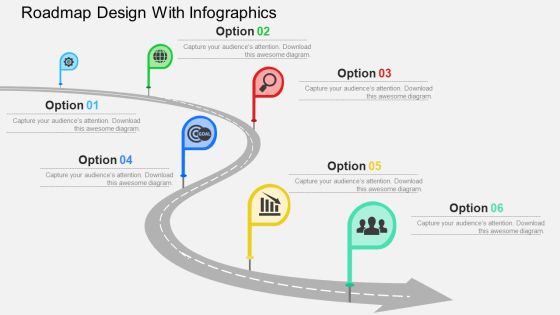
Roadmap Design With Infographics Powerpoint Templates
Create dynamic presentations with our professional template containing roadmap design with icons. This diagram is useful to display business steps and workflow. Download this template to leave permanent impression on your audience.

Zigzag Business Roadmap Infographics Powerpoint Slides
This timeline slide design can be used to display yearly business growth. It contains zigzag business roadmap with icons. This timeline template can be used in presentations where you need to display a roadmap or it may be used for business target analysis.

Colorful Puzzles Business Infographics Diagram Powerpoint Template
Develop competitive advantage with our above template which contains a diagram colorful puzzle pieces with icons. This diagram provides an effective way of displaying business information. You can edit text, color, shade and style as per you need.

Project Capabilities Employee Responsibilities Chart Ppt Infographics File Formats PDF
Presenting this set of slides with name project capabilities employee responsibilities chart ppt infographics file formats pdf. The topics discussed in these slides are progress reports, track progress, develop project plan, weekly meetings, project management, final report. This is a completely editable PowerPoint presentation and is available for immediate download. Download now and impress your audience.

Growth Arrow On Bar Graph Infographics Powerpoint Template
This PowerPoint template has been designed with growth arrow on bar graph. You may download this diagram slide to display growth and progress concepts. Illustrate your plans to your listeners with this impressive template.

Scrum Techniques Deployed Agile Members It Addressing Scrum Task Board For User Story Presentation Infographics PDF
This slide provides information regarding scrum task board as scrum tool for user story presentation in different sections such as story, to do, work in progress, to verify and done. Deliver an awe inspiring pitch with this creative scrum techniques deployed agile members it addressing scrum task board for user story presentation infographics pdf bundle. Topics like essential elements, progress, scrum team can be discussed with this completely editable template. It is available for immediate download depending on the needs and requirements of the user.
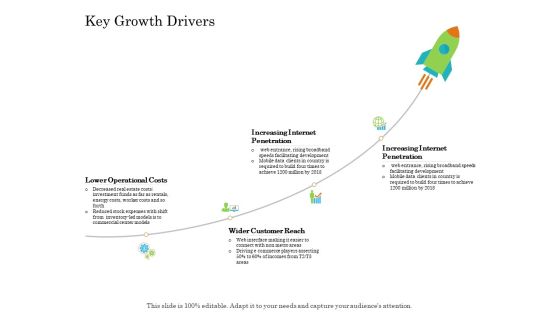
Online Trade Management System Key Growth Drivers Ppt Infographics Infographics PDF
Presenting online trade management system key growth drivers ppt infographics infographics pdf to provide visual cues and insights. Share and navigate important information on four stages that need your due attention. This template can be used to pitch topics like lower operational costs, wider customer reach, increasing internet penetration, rise in demand for global products. In addtion, this PPT design contains high resolution images, graphics, etc, that are easily editable and available for immediate download.

Board Of Dreams Infographics For Personal Growth Goals Ppt PowerPoint Presentation File Infographics PDF
Persuade your audience using this board of dreams infographics for personal growth goals ppt powerpoint presentation file infographics pdf. This PPT design covers four stages, thus making it a great tool to use. It also caters to a variety of topics including board of dreams infographics for personal growth goals. Download this PPT design now to present a convincing pitch that not only emphasizes the topic but also showcases your presentation skills.

Seven Problems Facing Start Up Business Ppt PowerPoint Presentation Infographics Infographics
Presenting this set of slides with name seven problems facing start up business ppt powerpoint presentation infographics infographics. This is a seven stage process. The stages in this process are 7 challenges, increasing profits, 7 Dares. This is a completely editable PowerPoint presentation and is available for immediate download. Download now and impress your audience.

Growth Trends In Online Business Industry Ppt PowerPoint Presentation Infographics Infographics PDF
Presenting this set of slides with name growth trends in online business industry ppt powerpoint presentation infographics infographics pdf. This is a three stage process. The stages in this process are growth trends in online business industry. This is a completely editable PowerPoint presentation and is available for immediate download. Download now and impress your audience.
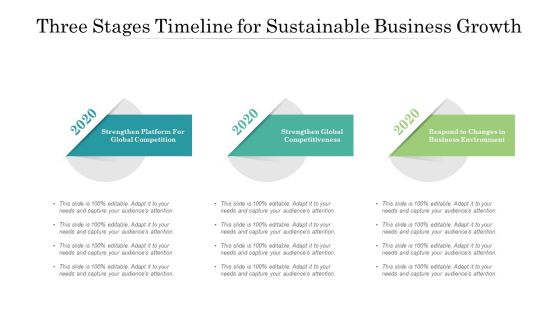
Three Stages Timeline For Sustainable Business Growth Ppt PowerPoint Presentation Infographics Infographics
Presenting this set of slides with name three stages timeline for sustainable business growth ppt powerpoint presentation infographics infographics. This is a three stage process. The stages in this process are strengthen platform global competition, strengthen global competitiveness, respond changes business environment, 2019 to 2021. This is a completely editable PowerPoint presentation and is available for immediate download. Download now and impress your audience.
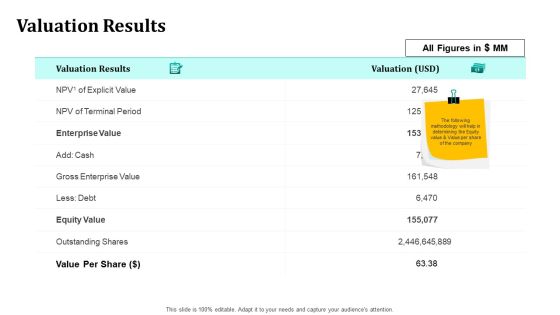
Merger And Acquisition Strategy For Inorganic Growth Valuation Results Ppt Infographics Infographics PDF
Deliver an awe inspiring pitch with this creative merger and acquisition strategy for inorganic growth valuation results ppt infographics infographics pdf bundle. Topics like gross enterprise value, equity value, terminal period, valuation results can be discussed with this completely editable template. It is available for immediate download depending on the needs and requirements of the user.

7 Circle Infographics For Business Intelligence Teams Ppt PowerPoint Presentation Infographics Brochure PDF
Persuade your audience using this 7 circle infographics for business intelligence teams ppt powerpoint presentation infographics brochure pdf. This PPT design covers seven stages, thus making it a great tool to use. It also caters to a variety of topics including 7 circle infographics for business intelligence teams. Download this PPT design now to present a convincing pitch that not only emphasizes the topic but also showcases your presentation skills.

Target Market Strategy Developing Pricing Strategies And Programs Basic Ppt Infographics Infographics PDF
This is a target market strategy developing pricing strategies and programs basic ppt infographics infographics pdf template with various stages. Focus and dispense information on five stages using this creative set, that comes with editable features. It contains large content boxes to add your information on topics like advanced, platinum, business, basic, pro. You can also showcase facts, figures, and other relevant content using this PPT layout. Grab it now.
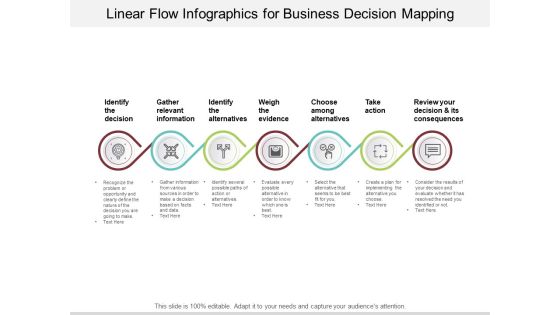
Linear Flow Infographics For Business Decision Mapping Ppt PowerPoint Presentation Infographics Graphics Example
Presenting this set of slides with name linear flow infographics for business decision mapping ppt powerpoint presentation infographics graphics example. This is a seven stage process. The stages in this process are decision making slides, strategic decision, business decision. This is a completely editable PowerPoint presentation and is available for immediate download. Download now and impress your audience.

BI Sectional Two Interconnected Circles Ppt PowerPoint Presentation Infographics Infographics PDF
Presenting this set of slides with name bi sectional two interconnected circles ppt powerpoint presentation infographics infographics pdf. This is a two stage process. The stages in this process are bi sectional two interconnected circles. This is a completely editable PowerPoint presentation and is available for immediate download. Download now and impress your audience.

Connecting Data Points Vector Icon Ppt PowerPoint Presentation Infographics Infographics PDF
Presenting this set of slides with name connecting data points vector icon ppt powerpoint presentation infographics infographics pdf. This is a three stage process. The stages in this process are connecting data points vector icon. This is a completely editable PowerPoint presentation and is available for immediate download. Download now and impress your audience.
Interactive Voice Response For Customer Care Vector Icon Ppt PowerPoint Presentation Infographics Infographics PDF
Presenting this set of slides with name interactive voice response for customer care vector icon ppt powerpoint presentation infographics infographics pdf. This is a five stage process. The stages in this process are interactive voice response for customer care vector icon. This is a completely editable PowerPoint presentation and is available for immediate download. Download now and impress your audience.

Brand Loyalty Through Public Relation Tactics Ppt PowerPoint Presentation Infographics Infographics PDF
Presenting brand loyalty through public relation tactics ppt powerpoint presentation infographics infographics pdf to dispense important information. This template comprises three stages. It also presents valuable insights into the topics including brand loyalty through public relation tactics. This is a completely customizable PowerPoint theme that can be put to use immediately. So, download it and address the topic impactfully.
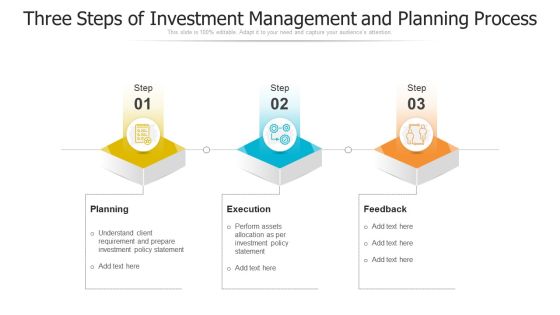
Three Steps Of Investment Management And Planning Process Ppt PowerPoint Presentation Infographics Infographics PDF
Presenting Three Steps Of Investment Management And Planning Process Ppt PowerPoint Presentation Infographics Infographics PDF to dispense important information. This template comprises three stages. It also presents valuable insights into the topics including planning, execution, feedback. This is a completely customizable PowerPoint theme that can be put to use immediately. So, download it and address the topic impactfully.

Venture Capital Financing Growth Startup Ppt PowerPoint Presentation Infographics Infographics Cpb
Presenting this set of slides with name venture capital financing growth startup ppt powerpoint presentation infographics infographics cpb. This is an editable Powerpoint three stages graphic that deals with topics like venture capital financing growth startup to help convey your message better graphically. This product is a premium product available for immediate download and is 100 percent editable in Powerpoint. Download this now and use it in your presentations to impress your audience.

Label Identity Design Market Competitiveness Product Quality Ppt Infographics Infographics PDF
Deliver and pitch your topic in the best possible manner with this label identity design market competitiveness product quality ppt infographics infographics pdf. Use them to share invaluable insights on competitor, weighted score, product range, price competition, geographical expansion, distribution, customer loyalty and impress your audience. This template can be altered and modified as per your expectations. So, grab it now.

Timeline Infographics For Launching New Product Ppt PowerPoint Presentation Ideas Infographics
Presenting this set of slides with name timeline infographics for launching new product ppt powerpoint presentation ideas infographics. This is a five stage process. The stages in this process are gross sales revenue, launched new product, research and development team launched. This is a completely editable PowerPoint presentation and is available for immediate download. Download now and impress your audience.

Business Records And Information Management Vector Icon Ppt Infographics Infographics PDF
Persuade your audience using this business records and information management vector icon ppt infographics infographics pdf. This PPT design covers three stages, thus making it a great tool to use. It also caters to a variety of topics including business records and information management vector icon. Download this PPT design now to present a convincing pitch that not only emphasizes the topic but also showcases your presentation skills.

Four Petals Showing Design Thinking Approach Ppt PowerPoint Presentation Infographics Infographics PDF
Persuade your audience using this four petals showing design thinking approach ppt powerpoint presentation infographics infographics pdf. This PPT design covers four stages, thus making it a great tool to use. It also caters to a variety of topics including use swot analysis, design thinking approach, input from your team and mentors, market research and customer outreach. Download this PPT design now to present a convincing pitch that not only emphasizes the topic but also showcases your presentation skills.

About Us For Web Maintenance And Support Proposal Ppt PowerPoint Presentation Infographics Infographics
Presenting this set of slides with name about us for web maintenance and support proposal ppt powerpoint presentation infographics infographics. This is a two stage process. The stages in this process are core values, mission, vision, hard work, pursuit better, think big, act integrity, growth customer. This is a completely editable PowerPoint presentation and is available for immediate download. Download now and impress your audience.
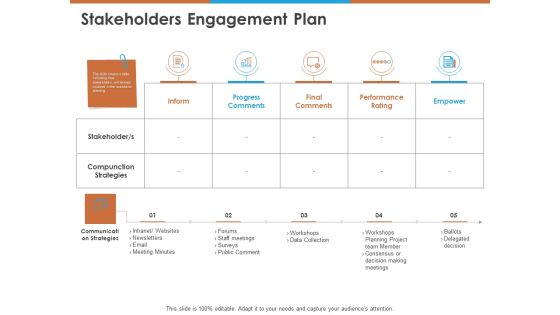
Stakeholders Engagement Plan Ppt PowerPoint Presentation Infographics Gridlines PDF
Presenting this set of slides with name stakeholders engagement plan ppt powerpoint presentation infographics gridlines pdf. The topics discussed in these slides are inform, progress comments, final comments, performance rating, empower, compunction strategies. This is a completely editable PowerPoint presentation and is available for immediate download. Download now and impress your audience.

Competitive Assessment To Analyze Growth Across Several Competitors Infographics PDF
This slide provides information regarding comparative assessment of firms progress to its competitors. The firm progress is compared on different parameters such as employees, revenues, perceived quality, growth pattern, growth strategies utilized, new product launched, etc. If you are looking for a format to display your unique thoughts, then the professionally designed Competitive Assessment To Analyze Growth Across Several Competitors Infographics PDF is the one for you. You can use it as a Google Slides template or a PowerPoint template. Incorporate impressive visuals, symbols, images, and other charts. Modify or reorganize the text boxes as you desire. Experiment with shade schemes and font pairings. Alter, share or cooperate with other people on your work. Download Competitive Assessment To Analyze Growth Across Several Competitors Infographics PDF and find out how to give a successful presentation. Present a perfect display to your team and make your presentation unforgettable.
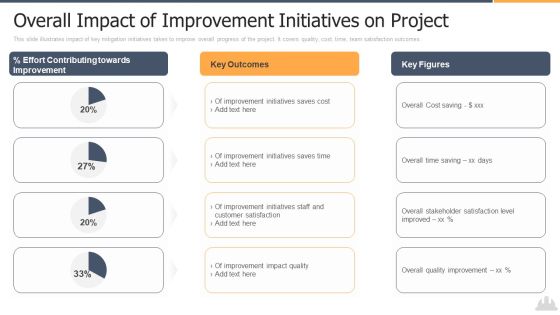
Overall Impact Of Improvement Initiatives On Project Infographics PDF
This slide illustrates impact of key mitigation initiatives taken to improve overall progress of the project. It covers quality, cost, time, team satisfaction outcomes. Deliver and pitch your topic in the best possible manner with this overall impact of improvement initiatives on project infographics pdf. Use them to share invaluable insights on improvement, initiatives, cost and impress your audience. This template can be altered and modified as per your expectations. So, grab it now.

Six Months JIT Manufacturing Roadmap For Performance Improvement Infographics
Presenting our innovatively-structured six months jit manufacturing roadmap for performance improvement infographics Template. Showcase your roadmap process in different formats like PDF, PNG, and JPG by clicking the download button below. This PPT design is available in both Standard Screen and Widescreen aspect ratios. It can also be easily personalized and presented with modified font size, font type, color, and shapes to measure your progress in a clear way.
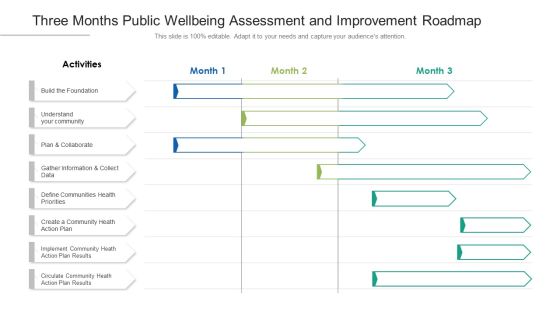
Three Months Public Wellbeing Assessment And Improvement Roadmap Infographics
Presenting our innovatively structured three months public wellbeing assessment and improvement roadmap infographics Template. Showcase your roadmap process in different formats like PDF, PNG, and JPG by clicking the download button below. This PPT design is available in both Standard Screen and Widescreen aspect ratios. It can also be easily personalized and presented with modified font size, font type, color, and shapes to measure your progress in a clear way.
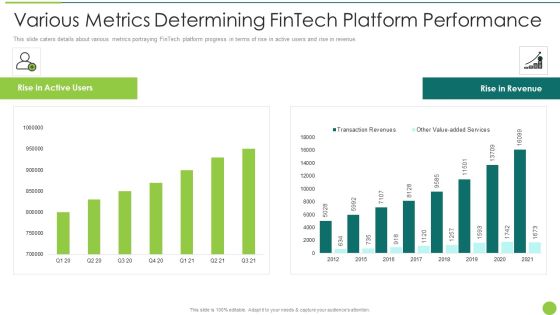
Various Metrics Determining Fintech Platform Performance Infographics PDF
This slide caters details about various metrics portraying FinTech platform progress in terms of rise in active users and rise in revenue. Deliver and pitch your topic in the best possible manner with this various metrics determining fintech platform performance infographics pdf. Use them to share invaluable insights on various metrics determining fintech platform performance and impress your audience. This template can be altered and modified as per your expectations. So, grab it now.
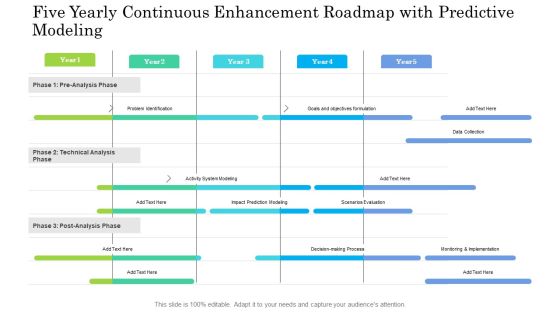
Five Yearly Continuous Enhancement Roadmap With Predictive Modeling Infographics
Presenting our innovatively structured five yearly continuous enhancement roadmap with predictive modeling infographics Template. Showcase your roadmap process in different formats like PDF, PNG, and JPG by clicking the download button below. This PPT design is available in both Standard Screen and Widescreen aspect ratios. It can also be easily personalized and presented with modified font size, font type, color, and shapes to measure your progress in a clear way.
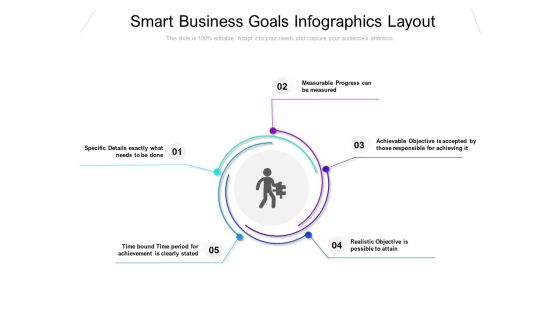
Smart Business Goals Infographics Layout Ppt PowerPoint Presentation Portfolio Microsoft
Presenting this set of slides with name smart business goals infographics layout ppt powerpoint presentation portfolio microsoft. This is a five stage process. The stages in this process are measurable progress measured, specific details exactly, time bound time period for achievement clearly stated, achievable objective accepted, realistic objective possible to attain. This is a completely editable PowerPoint presentation and is available for immediate download. Download now and impress your audience.

Six Months Scrum Software Development Roadmap With Construction Iterations Infographics
Presenting our innovatively-structured six months scrum software development roadmap with construction iterations infographics Template. Showcase your roadmap process in different formats like PDF, PNG, and JPG by clicking the download button below. This PPT design is available in both Standard Screen and Widescreen aspect ratios. It can also be easily personalized and presented with modified font size, font type, color, and shapes to measure your progress in a clear way.

5 Year Training Module Development Flow Roadmap Infographics
Presenting our innovatively-structured 5 year training module development flow roadmap infographics Template. Showcase your roadmap process in different formats like PDF, PNG, and JPG by clicking the download button below. This PPT design is available in both Standard Screen and Widescreen aspect ratios. It can also be easily personalized and presented with modified font size, font type, color, and shapes to measure your progress in a clear way.
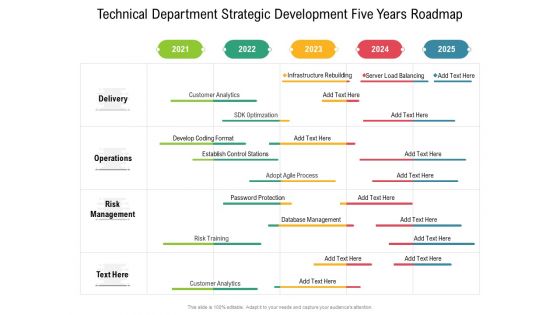
Technical Department Strategic Development Five Years Roadmap Infographics
Presenting our innovatively structured technical department strategic development five years roadmap infographics Template. Showcase your roadmap process in different formats like PDF, PNG, and JPG by clicking the download button below. This PPT design is available in both Standard Screen and Widescreen aspect ratios. It can also be easily personalized and presented with modified font size, font type, color, and shapes to measure your progress in a clear way.
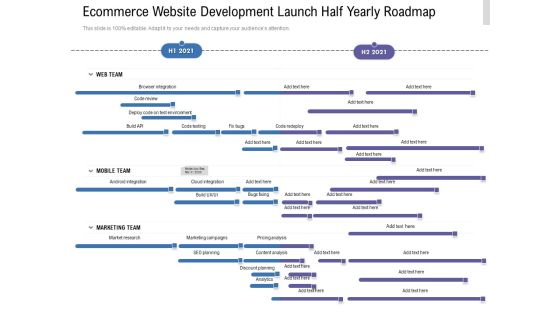
Ecommerce Website Development Launch Half Yearly Roadmap Infographics
Presenting our innovatively-structured ecommerce website development launch half yearly roadmap infographics Template. Showcase your roadmap process in different formats like PDF, PNG, and JPG by clicking the download button below. This PPT design is available in both Standard Screen and Widescreen aspect ratios. It can also be easily personalized and presented with modified font size, font type, color, and shapes to measure your progress in a clear way.
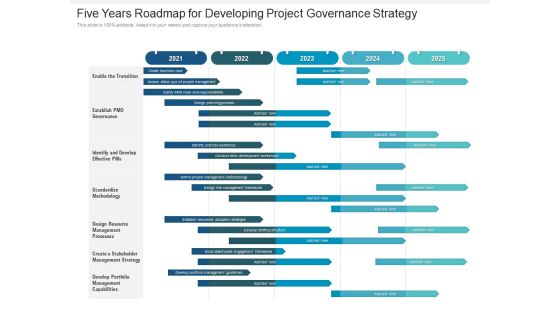
Five Years Roadmap For Developing Project Governance Strategy Infographics
Presenting our innovatively structured five years roadmap for developing project governance strategy infographics Template. Showcase your roadmap process in different formats like PDF, PNG, and JPG by clicking the download button below. This PPT design is available in both Standard Screen and Widescreen aspect ratios. It can also be easily personalized and presented with modified font size, font type, color, and shapes to measure your progress in a clear way.
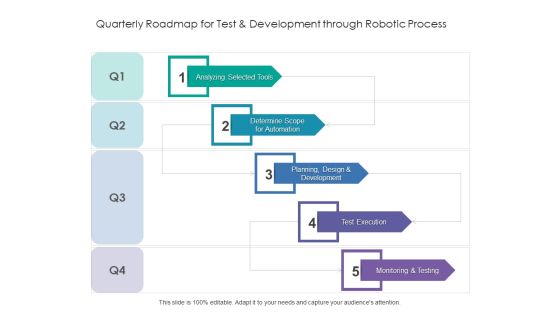
Quarterly Roadmap For Test And Development Through Robotic Process Infographics
Presenting our innovatively structured quarterly roadmap for test and development through robotic process infographics Template. Showcase your roadmap process in different formats like PDF, PNG, and JPG by clicking the download button below. This PPT design is available in both Standard Screen and Widescreen aspect ratios. It can also be easily personalized and presented with modified font size, font type, color, and shapes to measure your progress in a clear way.

Addressing Financial Projections Of Consumer Electronics Firm Infographics PDF
This slide caters details about financial projections of consumer electronics firm progress for next 5 years with operating profit, total revenue and Opex. Deliver an awe inspiring pitch with this creative addressing financial projections of consumer electronics firm infographics pdf bundle. Topics like revenue growth rate, gross profit, advertising, equipment, growth assumption can be discussed with this completely editable template. It is available for immediate download depending on the needs and requirements of the user.
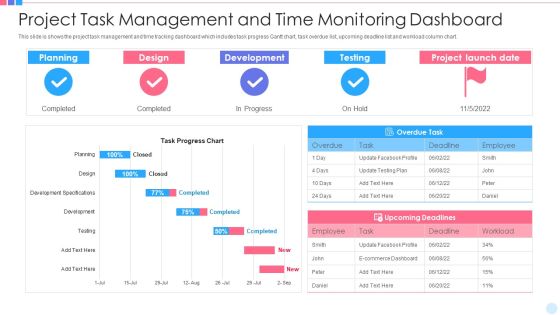
Project Task Management And Time Monitoring Dashboard Infographics PDF
This slide is shows the project task management and time tracking dashboard which includes task progress Gantt chart, task overdue list, upcoming deadline list and workload column chart. Pitch your topic with ease and precision using this project task management and time monitoring dashboard infographics pdf. This layout presents information on planning, design, development. It is also available for immediate download and adjustment. So, changes can be made in the color, design, graphics or any other component to create a unique layout.

5 Year Commodity Research And Analysis Roadmap Infographics
Presenting our innovatively-structured 5 year commodity research and analysis roadmap infographics Template. Showcase your roadmap process in different formats like PDF, PNG, and JPG by clicking the download button below. This PPT design is available in both Standard Screen and Widescreen aspect ratios. It can also be easily personalized and presented with modified font size, font type, color, and shapes to measure your progress in a clear way.

University Traditional Studies Four Quarter Roadmap Sue Infographics
Presenting our innovatively-structured university traditional studies four quarter roadmap sue infographics Template. Showcase your roadmap process in different formats like PDF, PNG, and JPG by clicking the download button below. This PPT design is available in both Standard Screen and Widescreen aspect ratios. It can also be easily personalized and presented with modified font size, font type, color, and shapes to measure your progress in a clear way.

6 Months Roadmap For Business Trademarking Timeline Infographics
Presenting our innovatively-structured 6 months roadmap for business trademarking timeline infographics Template. Showcase your roadmap process in different formats like PDF, PNG, and JPG by clicking the download button below. This PPT design is available in both Standard Screen and Widescreen aspect ratios. It can also be easily personalized and presented with modified font size, font type, color, and shapes to measure your progress in a clear way.

Half Yearly Quality Digital Ledger Verification And Control Roadmap Infographics
Presenting our innovatively-structured half yearly quality digital ledger verification and control roadmap infographics Template. Showcase your roadmap process in different formats like PDF, PNG, and JPG by clicking the download button below. This PPT design is available in both Standard Screen and Widescreen aspect ratios. It can also be easily personalized and presented with modified font size, font type, color, and shapes to measure your progress in a clear way.

Five Years Go Commodity Roadmap With Application Versions Infographics
Presenting our innovatively-structured five years go commodity roadmap with application versions infographics Template. Showcase your roadmap process in different formats like PDF, PNG, and JPG by clicking the download button below. This PPT design is available in both Standard Screen and Widescreen aspect ratios. It can also be easily personalized and presented with modified font size, font type, color, and shapes to measure your progress in a clear way.
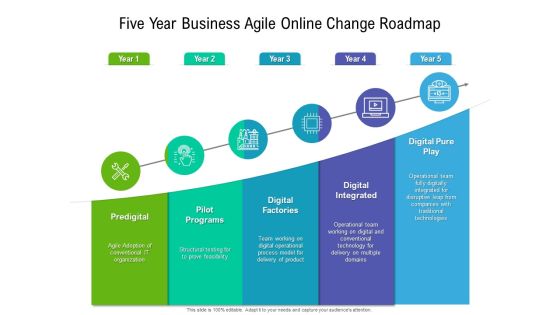
Five Year Business Agile Online Change Roadmap Infographics
Presenting our innovatively structured five year business agile online change roadmap infographics Template. Showcase your roadmap process in different formats like PDF, PNG, and JPG by clicking the download button below. This PPT design is available in both Standard Screen and Widescreen aspect ratios. It can also be easily personalized and presented with modified font size, font type, color, and shapes to measure your progress in a clear way.
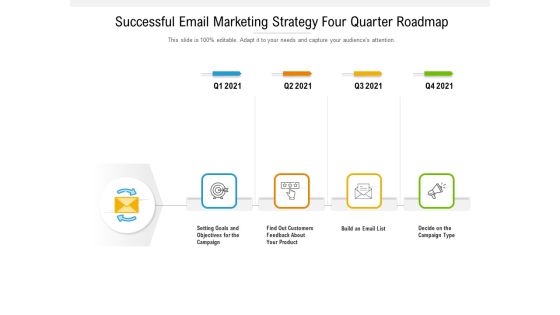
Successful Email Marketing Strategy Four Quarter Roadmap Infographics
Presenting our innovatively structured successful email marketing strategy four quarter roadmap infographics Template. Showcase your roadmap process in different formats like PDF, PNG, and JPG by clicking the download button below. This PPT design is available in both Standard Screen and Widescreen aspect ratios. It can also be easily personalized and presented with modified font size, font type, color, and shapes to measure your progress in a clear way.

Five Years Startup Promotion Roadmap Example With Organic Search Infographics
Presenting our innovatively-structured five years startup promotion roadmap example with organic search infographics Template. Showcase your roadmap process in different formats like PDF, PNG, and JPG by clicking the download button below. This PPT design is available in both Standard Screen and Widescreen aspect ratios. It can also be easily personalized and presented with modified font size, font type, color, and shapes to measure your progress in a clear way.
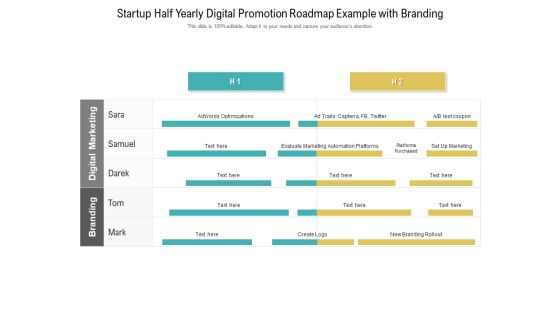
Startup Half Yearly Digital Promotion Roadmap Example With Branding Infographics
Presenting our innovatively-structured startup half yearly digital promotion roadmap example with branding infographics Template. Showcase your roadmap process in different formats like PDF, PNG, and JPG by clicking the download button below. This PPT design is available in both Standard Screen and Widescreen aspect ratios. It can also be easily personalized and presented with modified font size, font type, color, and shapes to measure your progress in a clear way.
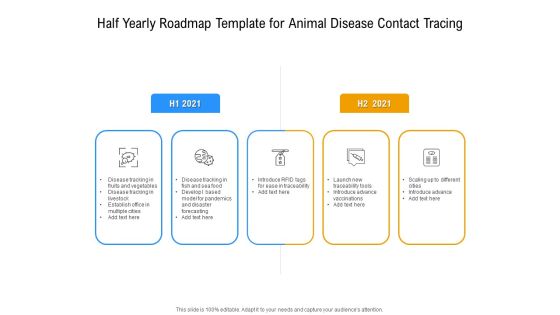
Half Yearly Roadmap Template For Animal Disease Contact Tracing Infographics
Presenting our innovatively structured half yearly roadmap template for animal disease contact tracing infographics Template. Showcase your roadmap process in different formats like PDF, PNG, and JPG by clicking the download button below. This PPT design is available in both Standard Screen and Widescreen aspect ratios. It can also be easily personalized and presented with modified font size, font type, color, and shapes to measure your progress in a clear way.
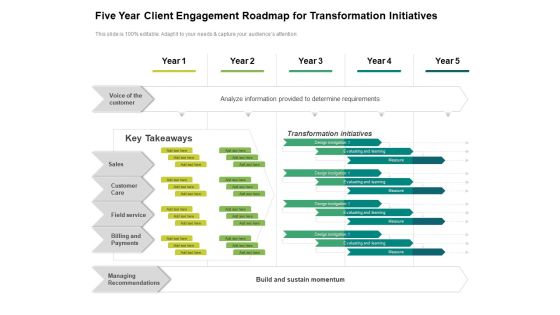
Five Year Client Engagement Roadmap For Transformation Initiatives Infographics
Presenting our innovatively structured five year client engagement roadmap for transformation initiatives infographics Template. Showcase your roadmap process in different formats like PDF, PNG, and JPG by clicking the download button below. This PPT design is available in both Standard Screen and Widescreen aspect ratios. It can also be easily personalized and presented with modified font size, font type, color, and shapes to measure your progress in a clear way.
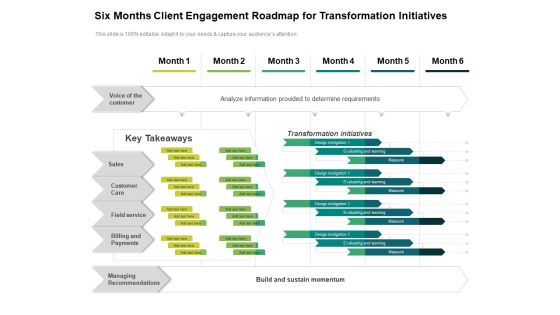
Six Months Client Engagement Roadmap For Transformation Initiatives Infographics
Presenting our innovatively structured six months client engagement roadmap for transformation initiatives infographics Template. Showcase your roadmap process in different formats like PDF, PNG, and JPG by clicking the download button below. This PPT design is available in both Standard Screen and Widescreen aspect ratios. It can also be easily personalized and presented with modified font size, font type, color, and shapes to measure your progress in a clear way.
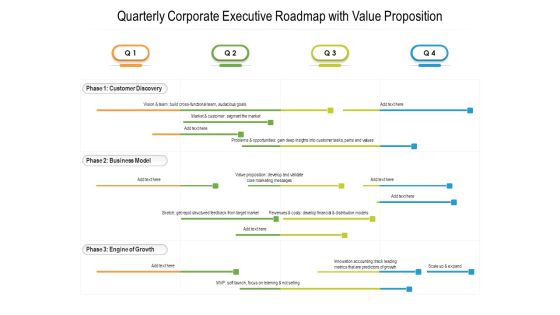
Quarterly Corporate Executive Roadmap With Value Proposition Infographics
Presenting our innovatively structured quarterly corporate executive roadmap with value proposition infographics Template. Showcase your roadmap process in different formats like PDF, PNG, and JPG by clicking the download button below. This PPT design is available in both Standard Screen and Widescreen aspect ratios. It can also be easily personalized and presented with modified font size, font type, color, and shapes to measure your progress in a clear way.

Half Yearly Product Performance Optimization Roadmap For Companies Infographics
Presenting our innovatively structured half yearly product performance optimization roadmap for companies infographics Template. Showcase your roadmap process in different formats like PDF, PNG, and JPG by clicking the download button below. This PPT design is available in both Standard Screen and Widescreen aspect ratios. It can also be easily personalized and presented with modified font size, font type, color, and shapes to measure your progress in a clear way.

Six Months Product Strategy Roadmap With New Features Infographics
Presenting our innovatively-structured six months product strategy roadmap with new features infographics Template. Showcase your roadmap process in different formats like PDF, PNG, and JPG by clicking the download button below. This PPT design is available in both Standard Screen and Widescreen aspect ratios. It can also be easily personalized and presented with modified font size, font type, color, and shapes to measure your progress in a clear way.
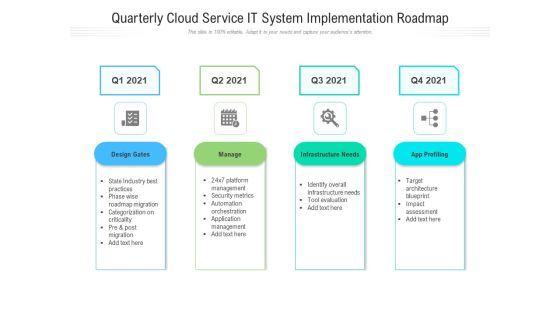
Quarterly Cloud Service IT System Implementation Roadmap Infographics
Presenting our innovatively-structured quarterly cloud service it system implementation roadmap infographics Template. Showcase your roadmap process in different formats like PDF, PNG, and JPG by clicking the download button below. This PPT design is available in both Standard Screen and Widescreen aspect ratios. It can also be easily personalized and presented with modified font size, font type, color, and shapes to measure your progress in a clear way.

6 Months Roadmap To Plan And Release Software Product Infographics
Presenting our innovatively structured 6 months roadmap to plan and release software product infographics Template. Showcase your roadmap process in different formats like PDF, PNG, and JPG by clicking the download button below. This PPT design is available in both Standard Screen and Widescreen aspect ratios. It can also be easily personalized and presented with modified font size, font type, color, and shapes to measure your progress in a clear way.
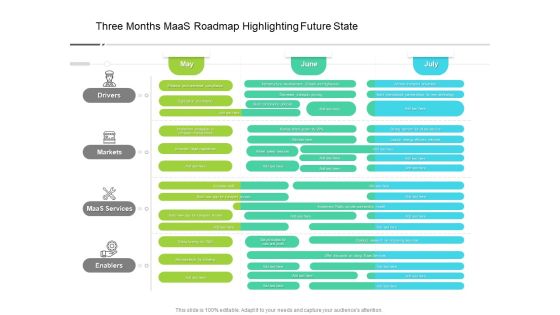
Three Months Maas Roadmap Highlighting Future State Infographics
Presenting our innovatively-structured three months maas roadmap highlighting future state infographics Template. Showcase your roadmap process in different formats like PDF, PNG, and JPG by clicking the download button below. This PPT design is available in both Standard Screen and Widescreen aspect ratios. It can also be easily personalized and presented with modified font size, font type, color, and shapes to measure your progress in a clear way.

Five Years HR Transformation Trimonthly By Trimonthly Process Roadmap Infographics
Presenting our innovatively structured five years hr transformation trimonthly by trimonthly process roadmap infographics Template. Showcase your roadmap process in different formats like PDF, PNG, and JPG by clicking the download button below. This PPT design is available in both Standard Screen and Widescreen aspect ratios. It can also be easily personalized and presented with modified font size, font type, color, and shapes to measure your progress in a clear way.
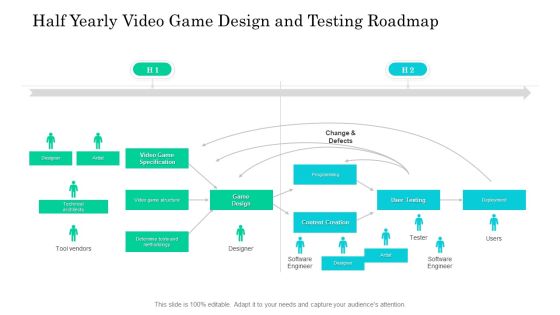
Half Yearly Video Game Design And Testing Roadmap Infographics
Presenting our innovatively structured half yearly video game design and testing roadmap infographics Template. Showcase your roadmap process in different formats like PDF, PNG, and JPG by clicking the download button below. This PPT design is available in both Standard Screen and Widescreen aspect ratios. It can also be easily personalized and presented with modified font size, font type, color, and shapes to measure your progress in a clear way.

Five Years Mesh Roadmap With Promotional Analysis Infographics
Presenting our innovatively structured five years mesh roadmap with promotional analysis infographics Template. Showcase your roadmap process in different formats like PDF, PNG, and JPG by clicking the download button below. This PPT design is available in both Standard Screen and Widescreen aspect ratios. It can also be easily personalized and presented with modified font size, font type, color, and shapes to measure your progress in a clear way.
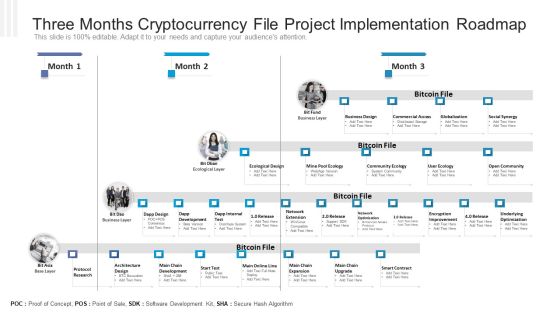
Three Months Cryptocurrency File Project Implementation Roadmap Infographics PDF
Presenting our innovatively-structured three months cryptocurrency file project implementation roadmap infographics pdf Template. Showcase your roadmap process in different formats like PDF, PNG, and JPG by clicking the download button below. This PPT design is available in both Standard Screen and Widescreen aspect ratios. It can also be easily personalized and presented with modified font size, font type, color, and shapes to measure your progress in a clear way.

6 Months Roadmap For Corporate ITIL Execution Process Infographics
Presenting our innovatively structured 6 months roadmap for corporate itil execution process infographics Template. Showcase your roadmap process in different formats like PDF, PNG, and JPG by clicking the download button below. This PPT design is available in both Standard Screen and Widescreen aspect ratios. It can also be easily personalized and presented with modified font size, font type, color, and shapes to measure your progress in a clear way.

Business Overview Investor Deck Four Quarter Roadmap Template Infographics
Presenting our innovatively structured business overview investor deck four quarter roadmap template infographics Template. Showcase your roadmap process in different formats like PDF, PNG, and JPG by clicking the download button below. This PPT design is available in both Standard Screen and Widescreen aspect ratios. It can also be easily personalized and presented with modified font size, font type, color, and shapes to measure your progress in a clear way.

5 Year Financing Procurement Process Roadmap For New Project Infographics
Presenting our innovatively structured 5 year financing procurement process roadmap for new project infographics Template. Showcase your roadmap process in different formats like PDF, PNG, and JPG by clicking the download button below. This PPT design is available in both Standard Screen and Widescreen aspect ratios. It can also be easily personalized and presented with modified font size, font type, color, and shapes to measure your progress in a clear way.
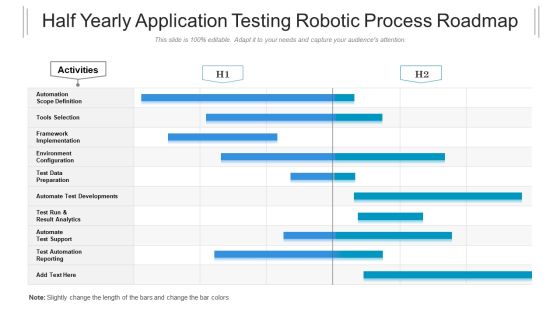
Half Yearly Application Testing Robotic Process Roadmap Infographics
Presenting our innovatively structured half yearly application testing robotic process roadmap infographics Template. Showcase your roadmap process in different formats like PDF, PNG, and JPG by clicking the download button below. This PPT design is available in both Standard Screen and Widescreen aspect ratios. It can also be easily personalized and presented with modified font size, font type, color, and shapes to measure your progress in a clear way.

Quarterly Business Roadmap With IT Capability Support Infographics
Presenting our innovatively structured quarterly business roadmap with it capability support infographics Template. Showcase your roadmap process in different formats like PDF, PNG, and JPG by clicking the download button below. This PPT design is available in both Standard Screen and Widescreen aspect ratios. It can also be easily personalized and presented with modified font size, font type, color, and shapes to measure your progress in a clear way.
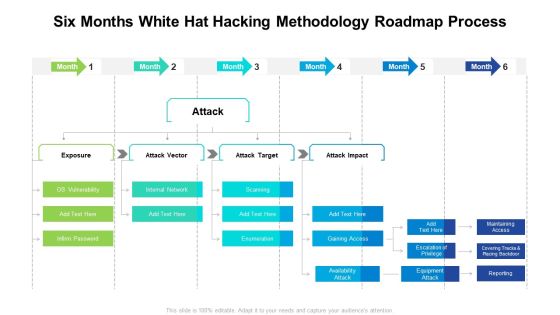
Six Months White Hat Hacking Methodology Roadmap Process Infographics
Presenting our innovatively structured six months white hat hacking methodology roadmap process infographics Template. Showcase your roadmap process in different formats like PDF, PNG, and JPG by clicking the download button below. This PPT design is available in both Standard Screen and Widescreen aspect ratios. It can also be easily personalized and presented with modified font size, font type, color, and shapes to measure your progress in a clear way.
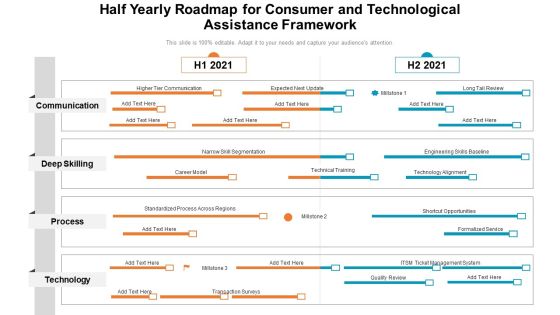
Half Yearly Roadmap For Consumer And Technological Assistance Framework Infographics
Presenting our innovatively-structured half yearly roadmap for consumer and technological assistance framework infographics Template. Showcase your roadmap process in different formats like PDF, PNG, and JPG by clicking the download button below. This PPT design is available in both Standard Screen and Widescreen aspect ratios. It can also be easily personalized and presented with modified font size, font type, color, and shapes to measure your progress in a clear way.
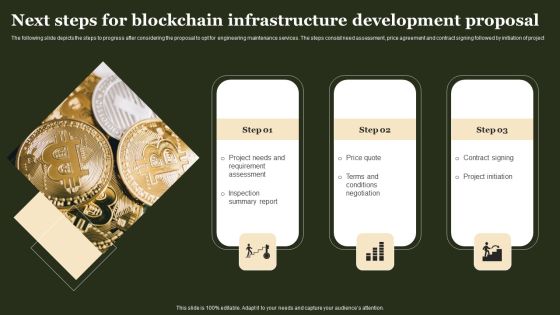
Next Steps For Blockchain Infrastructure Development Proposal Infographics PDF
The following slide depicts the steps to progress after considering the proposal to opt for engineering maintenance services. The steps consist need assessment, price agreement and contract signing followed by initiation of project Take your presentations to the next level with our Next Steps For Blockchain Infrastructure Development Proposal Infographics PDF template. With its sleek design and seamless editing features, this single-slide PPT template is a game-changer for professionals who want to make an impact. Impress your audience with stunning visuals and engaging content that will capture their attention from start to finish. Get your hands on our template and elevate your presentations to new heights.
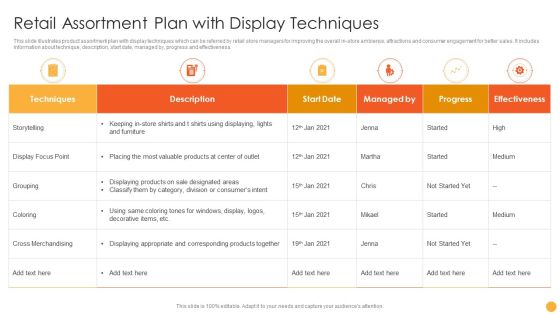
Retail Assortment Plan With Display Techniques Ppt Infographics Visuals PDF
This slide illustrates product assortment plan with display techniques which can be referred by retail store managers for improving the overall in-store ambience, attractions and consumer engagement for better sales. It includes information about technique, description, start date, managed by, progress and effectiveness. Showcasing this set of slides titled Retail Assortment Plan With Display Techniques Ppt Infographics Visuals PDF. The topics addressed in these templates are Techniques, Storytelling, Cross Merchandising. All the content presented in this PPT design is completely editable. Download it and make adjustments in color, background, font etc. as per your unique business setting.

Software Application Concept Phase Milestone Create User Stories Infographics PDF
This template covers depicts that company must create user stories to gather business requirements for development and track progress for each story. It also including target release, document status, document owner, designer, developers and QA names, with requirements such as user story title, user story description, priority and, notes.Deliver and pitch your topic in the best possible manner with this Software Application Concept Phase Milestone Create User Stories Infographics PDF. Use them to share invaluable insights on Software Integration, Smart Embedding, Customer Interview and impress your audience. This template can be altered and modified as per your expectations. So, grab it now.

Dashboard Showing Monitoring Campaign Of Marketing Ppt Infographics PDF
This slide represents dashboard showcasing campaign report. It includes recipients, email clients, open rate, spam complaints etc that enable organization in analyzing progress of marketing campaign to develop more effective strategies. Showcasing this set of slides titled Dashboard Showing Monitoring Campaign Of Marketing Ppt Infographics PDF. The topics addressed in these templates are Recipients, Open Rate, Spam Complaints, Shares. All the content presented in this PPT design is completely editable. Download it and make adjustments in color, background, font etc. as per your unique business setting.

Business Milestones Budget Guide Plan Ppt Infographics Pictures PDF
The slide communicated a guide plan of business milestones to measure the progress toward the ultimate goal. It shows tasks, start and end date, cost, manager and department. Pitch your topic with ease and precision using this Business Milestones Budget Guide Plan Ppt Infographics Pictures PDF. This layout presents information on Corporate Identity, Seminar Implementation, Business Plan Review. It is also available for immediate download and adjustment. So, changes can be made in the color, design, graphics or any other component to create a unique layout.

Next Steps For Professional Maintenance Services Proposal Infographics PDF
The following slide depicts the steps to progress after considering the proposal to opt for engineering maintenance services. The steps consists inspection, price agreement and contract signing followed by initiation of project. Power up your presentations with our Next Steps For Professional Maintenance Services Proposal Infographics PDF single-slide PPT template. Our visually-stunning template will help you deliver your message with confidence. With easy-to-use editing options and fully customizable features, you can create polished and captivating presentations in no time. Say goodbye to boring slides and hello to impactful presentations with our top-quality template. Download now and get ready to wow your audience. singles
Employee Training Status Report With Activities Infographics PDF
This slide presents the training progress report that records the time involved in completing specific training activities that enables the manager to analyze reasons for the delay. It includes elements such as training activities, employee name, responsible, status, etc. Pitch your topic with ease and precision using this Employee Training Status Report With Activities Infographics PDF. This layout presents information on Team Building Exercise, Customer Experience Optimization, Product Management. It is also available for immediate download and adjustment. So, changes can be made in the color, design, graphics or any other component to create a unique layout.

Steps Of Customer Onboarding Process Schedule Infographics PDF
This slide showcases steps involved in user onboarding and their status. The steps covered are brand awareness, initial contact, welcome email, first login, feature promotion, product walkthrough, regular updates and progress tracking. Get a simple yet stunning designed Steps Of Customer Onboarding Process Schedule Infographics PDF. It is the best one to establish the tone in your meetings. It is an excellent way to make your presentations highly effective. So, download this PPT today from Slidegeeks and see the positive impacts. Our easy to edit Steps Of Customer Onboarding Process Schedule Infographics PDF can be your go to option for all upcoming conferences and meetings. So, what are you waiting for Grab this template today.

Effect Of Efficient Advertising Campaign Implementation Infographics PDF
This slide provides an overview of the progress made by firms after a successful advertising campaign. It includes statistics that are new leads generated, improvement in ROI, reduction in customer acquisition cost, increase in conversion rate, etc. Slidegeeks has constructed Effect Of Efficient Advertising Campaign Implementation Infographics PDF after conducting extensive research and examination. These presentation templates are constantly being generated and modified based on user preferences and critiques from editors. Here, you will find the most attractive templates for a range of purposes while taking into account ratings and remarks from users regarding the content. This is an excellent jumping-off point to explore our content and will give new users an insight into our top-notch PowerPoint Templates.
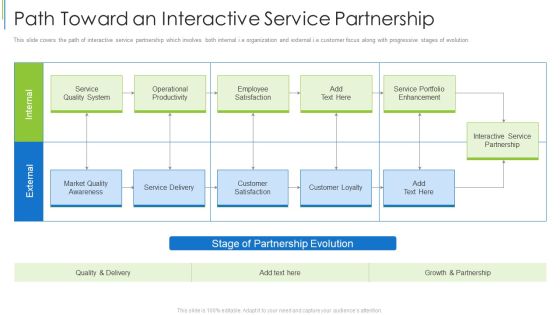
Path Toward An Interactive Service Partnership Ppt Infographics Clipart PDF
This slide covers the path of interactive service partnership which involves both internal i.e organization and external i.e customer focus along with progressive stages of evolution. Deliver an awe inspiring pitch with this creative path toward an interactive service partnership ppt infographics clipart pdf bundle. Topics like partnership evolution, portfolio enhancement, service quality system can be discussed with this completely editable template. It is available for immediate download depending on the needs and requirements of the user.

Benefits Of Workforce Management System Solutions Infographics PDF
The slide showcases benefits with talent management systems, integrated software solutions to manage HR operations like recruitment, employee progression etc. It includes improved recruiting techniques, employee development, accuracy of data, employee engagement and retains talent. Presenting Benefits Of Workforce Management System Solutions Infographics PDF to dispense important information. This template comprises six stages. It also presents valuable insights into the topics including Improved Recruiting Techniques, Employee Engagement, Retains Talent. This is a completely customizable PowerPoint theme that can be put to use immediately. So, download it and address the topic impactfully.
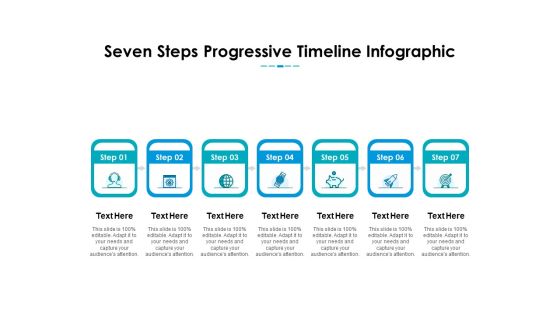
Seven Linear Steps For Project Management Plan Ppt PowerPoint Presentation Outline Maker
Presenting this set of slides with name seven linear steps for project management plan ppt powerpoint presentation outline maker. This is a seven stage process. The stages in this process are seven steps, progressive timeline, infographic. This is a completely editable PowerPoint presentation and is available for immediate download. Download now and impress your audience.

Six Months Software Development Change Planning Roadmap Of Company Infographics
Utilize our pre build six months software development change planning roadmap of company infographics to present your plan of action in the most effective way. Reduce the paperwork and showcase how different activities are linked to each other by incorporating this attention grabbing PowerPoint theme. This completely editable roadmap PPT layout is suitable to fit all your needs and to have a structured outline of the entire process flow using color coding. Provide guidelines to your teammates about the progression process by employing our PPT theme. Team members can easily be designated into teams by accessing the work milestones to be accomplished within the timeframe. You can easily modify the PowerPoint slide according to real time situations. Download our stunning six months software development change planning roadmap of company infographics, and you are good to go to prove your expertise in strategic planning.

Digital Promotional And Social Media Four Quarter Transformation Roadmap Infographics
Utilize our pre build digital promotional and social media four quarter transformation roadmap infographics to present your plan of action in the most effective way. Reduce the paperwork and showcase how different activities are linked to each other by incorporating this attention grabbing PowerPoint theme. This completely editable roadmap PPT layout is suitable to fit all your needs and to have a structured outline of the entire process flow using color coding. Provide guidelines to your teammates about the progression process by employing our PPT theme. Team members can easily be designated into teams by accessing the work milestones to be accomplished within the timeframe. You can easily modify the PowerPoint slide according to real time situations. Download our stunning digital promotional and social media four quarter transformation roadmap infographics, and you are good to go to prove your expertise in strategic planning.
 Home
Home