Progress Infographic

Five Strategic Human Resource Priorities Infographics PDF
The following slide outlines human resource priorities to significantly impact organisation by developing a positive culture and employee experience. It covers leader effectiveness, change management, employee experience and recruiting. Presenting Five Strategic Human Resource Priorities Infographics PDF to dispense important information. This template comprises five stages. It also presents valuable insights into the topics including Recruiting, Change Management, Employee Experience. This is a completely customizable PowerPoint theme that can be put to use immediately. So, download it and address the topic impactfully.

Dynamic Systems Development Method Dsdmframework Infographics PDF
This slide covers agile dynamic systems development method framework including pre project and post project situations along with functional model iteration, implementation, design and build iteration etc. Make sure to capture your audiences attention in your business displays with our gratis customizable Dynamic Systems Development Method Dsdmframework Infographics PDF. These are great for business strategies, office conferences, capital raising or task suggestions. If you desire to acquire more customers for your tech business and ensure they stay satisfied, create your own sales presentation with these plain slides.

Feature Development Imputation Techniques Analysis Infographics PDF
Following slide represents feature engineering imputation methods. Purpose of this slide is to use technical tools to deal with missing data that can be used for obtaining useful information. It include elements such as methods, assumptions, advantages and observations. Pitch your topic with ease and precision using this Feature Development Imputation Techniques Analysis Infographics PDF. This layout presents information on Imputation Methods, Assumptions, Usability . It is also available for immediate download and adjustment. So, changes can be made in the color, design, graphics or any other component to create a unique layout.

Total Quality Management Elements System Infographics PDF
This slide shows components of total quality management that should be considered for better quality of output. It include elements such as commitment and understanding, quality improvement culture, continuous improving areas etc. Persuade your audience using this Total Quality Management Elements System Infographics PDF. This PPT design covers five stages, thus making it a great tool to use. It also caters to a variety of topics including Continuous Improving Areas, Customer Satisfaction Advantages, Effective Control Measures. Download this PPT design now to present a convincing pitch that not only emphasizes the topic but also showcases your presentation skills.
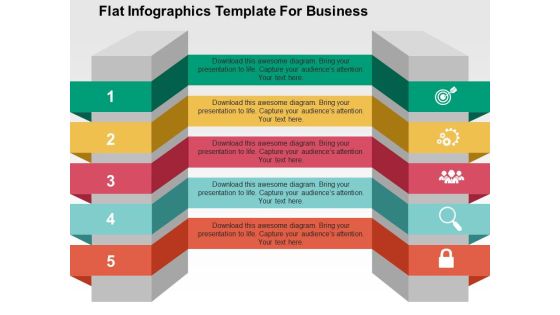
Flat Infographics Template For Business Powerpoint Templates
This PowerPoint slide contains tags infographic. This professional slide may be used for text representation. Use this template to highlight the key issues of your presentation.

Companys Merger And Acquisition Process Infographics PDF
This slide shows the companys merger and acquisition process which includes Definition of strategic goals, definition of investment framework, carrying out of target screening, etc.This is a companys merger and acquisition process infographics pdf template with various stages. Focus and dispense information on six stages using this creative set, that comes with editable features. It contains large content boxes to add your information on topics like carrying out of target screening, definition of investment framework, definition of strategic goal. You can also showcase facts, figures, and other relevant content using this PPT layout. Grab it now.

Consequences Of Construction Mismanagement Infographics PDF
This slide shows the consequences that any construction company must incur in case of poor and improper construction management such as overbudget, project delays, equipment breakdown, communication issues, reduced productivity and efficiency etc. This is a consequences of construction mismanagement infographics pdf template with various stages. Focus and dispense information on six stages using this creative set, that comes with editable features. It contains large content boxes to add your information on topics like equipment breakdown, reduced productivity and efficiency, construction project delays. You can also showcase facts, figures, and other relevant content using this PPT layout. Grab it now.

Project Management Application Sales Strategy Infographics PDF
This following slide displays the project management application sales plan. It displays tactics and strategies that organisation can adopt to grow the sales of their product. Persuade your audience using this project management application sales strategy infographics pdf. This PPT design covers six stages, thus making it a great tool to use. It also caters to a variety of topics including goal, target, strategies, calendar, result. Download this PPT design now to present a convincing pitch that not only emphasizes the topic but also showcases your presentation skills.

Catastrophe Recovery Application Plan Introduction Infographics PDF
This slide represents the disaster recovery plan and various steps of an effective DR plan, such as assemble a plan, identify the scope, appoint emergency contacts, designate a disaster recovery team, assign roles and responsibilities, and so on. Presenting catastrophe recovery application plan introduction infographics pdf to provide visual cues and insights. Share and navigate important information on eight stages that need your due attention. This template can be used to pitch topics like identify scope, assemble plan, testing and maintenance, restore technology functionality, disaster recovery plan. In addtion, this PPT design contains high resolution images, graphics, etc, that are easily editable and available for immediate download.

New Product Launch Approach Steps Infographics PDF
This slide showcases the process of launching a new product in the market. Key steps include decision making, selecting right team, proper timing, taking feedbacks, ensuring security, planning a campaign and communicating.Persuade your audience using this New Product Launch Approach Steps Infographics PDF This PPT design covers seven stages, thus making it a great tool to use. It also caters to a variety of topics including Launch Decision, Picking Right Team, Ensure Security Download this PPT design now to present a convincing pitch that not only emphasizes the topic but also showcases your presentation skills.

Process Model Of Functional Benchmarking Infographics PDF
This slide focuses on the ten step model of functional benchmarking process which includes identification of competitive companies, determination of data collection techniques, assessing current performance levels, communicating findings, establishing functional goals, etc.Presenting Process Model Of Functional Benchmarking Infographics PDF to dispense important information. This template comprises ten stages. It also presents valuable insights into the topics including Identifying, Competitive Firms, Determining Data, Gathering Methods This is a completely customizable PowerPoint theme that can be put to use immediately. So, download it and address the topic impactfully.

4 Stages Of Data Mining Infographics PDF
Mentioned slide delineates multiple stages of data mining that can be used by business organization. Data gathering, data preparation, data mining and data analysis and interpretation are the key stages that can assist organization in decision-making by interpreting raw data into useful information. Presenting 4 Stages Of Data Mining Infographics PDF to dispense important information. This template comprises four stages. It also presents valuable insights into the topics including Data Gathering, Data Preparation, Mining The Data This is a completely customizable PowerPoint theme that can be put to use immediately. So, download it and address the topic impactfully.

Typical Service Provider Training Curriculum Infographics PDF
This slide covers the various training that must be included in the curriculum of channel partner training. It includes trainings on brand, product and service, compliance, customer support skills, etc. Presenting Typical Service Provider Training Curriculum Infographics PDF to dispense important information. This template comprises three stages. It also presents valuable insights into the topics including Brand Training, Product And Service Training, Compliance Training. This is a completely customizable PowerPoint theme that can be put to use immediately. So, download it and address the topic impactfully.

Service Provider Training Certification Benefits Infographics PDF
This slide contains the benefits of channel partner training certification that allows a partner programme to focus on more than just sales and marketing . It includes ensuring status validity, bringing creditability, building partner loyalty, etc. Persuade your audience using this Service Provider Training Certification Benefits Infographics PDF. This PPT design covers three stages, thus making it a great tool to use. It also caters to a variety of topics including Ensure Partner Status Validity, Bring Program Creditability, Builds Partner Loyalty. Download this PPT design now to present a convincing pitch that not only emphasizes the topic but also showcases your presentation skills.

Various Ways For Managing Pipeline Infographics PDF
This slide provides information regarding various through which sales pipeline is managed such as tactical outbound messaging, automating email marketing, etc. This is a Various Ways For Managing Pipeline Infographics PDF template with various stages. Focus and dispense information on three stages using this creative set, that comes with editable features. It contains large content boxes to add your information on topics like Automating Email Marketing, Qualified Lead Delivery, Tactical Outbound Messaging. You can also showcase facts, figures, and other relevant content using this PPT layout. Grab it now.

Inventory Sales Order Management Flow Infographics PDF
This slide showcases inventory sales order process and procedure. It includes steps such as quotation summation, vendors response, acceptance of quote, confirmation, invoicing and payment. Persuade your audience using this Inventory Sales Order Management Flow Infographics PDF. This PPT design covers nine stages, thus making it a great tool to use. It also caters to a variety of topics including Vendor Responds, Receiving Request, Based Purchase. Download this PPT design now to present a convincing pitch that not only emphasizes the topic but also showcases your presentation skills.

LAER Framework Model Execution Roadmap Infographics PDF
This slide showcases step by step approach to ensure seamless implementation of LAER framework in organization. It further includes details about phases such as land, adopt, expand and renew. Persuade your audience using this LAER Framework Model Execution Roadmap Infographics PDF. This PPT design covers four stages, thus making it a great tool to use. It also caters to a variety of topics including Land Phase, Adopt Phase, Expand Phase, Renew Phase. Download this PPT design now to present a convincing pitch that not only emphasizes the topic but also showcases your presentation skills.

Knowledge Management Process Innovation Lifecycle Infographics PDF
The slide showcases knowledge management innovation cycle it illustrates the transformation of unstructured knowledge into more structured, reproducible information that is included into processes or products. It covers key processes like create, codify, embed and diffuse. Persuade your audience using this Knowledge Management Process Innovation Lifecycle Infographics PDF. This PPT design covers four stages, thus making it a great tool to use. It also caters to a variety of topics including Create, Codify, Embed. Download this PPT design now to present a convincing pitch that not only emphasizes the topic but also showcases your presentation skills.

Post Merger Integration Planning Model Infographics PDF
This slide illustrates how to do quality assurance and quality control in construction. It includes measures like hiring skilled labor, technology adaption, use of right material, compliance etc. Presenting Post Merger Integration Planning Model Infographics PDF to dispense important information. This template comprises five stages. It also presents valuable insights into the topics including Synergy Realization, Functional Planning And Execution, Organizational Structure, Program Management, Change Management. This is a completely customizable PowerPoint theme that can be put to use immediately. So, download it and address the topic impactfully.

Supply Chain Security Management Model Infographics PDF
This slide represents the framework showing the management of supply chain security. It includes details related to supply chain security goals such as facility, cargo, human resource, information and ABC companys management system along with their respective security measures. Presenting Supply Chain Security Management Model Infographics PDF to dispense important information. This template comprises five stages. It also presents valuable insights into the topics including Human Resources Management, Cargo Management, Facility Management. This is a completely customizable PowerPoint theme that can be put to use immediately. So, download it and address the topic impactfully.
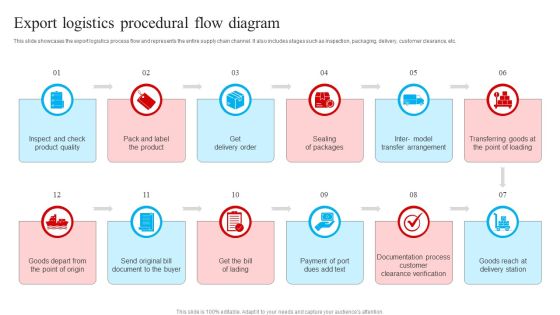
Export Logistics Procedural Flow Diagram Infographics PDF
This slide showcases the export logistics process flow and represents the entire supply chain channel. It also includes stages such as inspection, packaging, delivery, customer clearance, etc. Presenting Export Logistics Procedural Flow Diagram Infographics PDF to dispense important information. This template comprises tewlve stages. It also presents valuable insights into the topics including Inspect And Check, Pack Label Product, Get Delivery Order. This is a completely customizable PowerPoint theme that can be put to use immediately. So, download it and address the topic impactfully.

Data Science Process Lifecycle Model Infographics PDF
The following slide presents a framework showing key steps of data science lifecycle to analyze and visualize larger amount of data. It incudes key steps such as obtain, scrub, explore, model and interpret. Persuade your audience using this Data Science Process Lifecycle Model Infographics PDF. This PPT design covers five stages, thus making it a great tool to use. It also caters to a variety of topics including Scrub, Explore, Model, Interpret. Download this PPT design now to present a convincing pitch that not only emphasizes the topic but also showcases your presentation skills.

Highly Ranked Ethical Investing Stocks Infographics PDF
This slide represents the ten best stocks for ethical investments. It includes details related to the overall , growth, valuation, efficiency, financial strength, dividends and momentum rating scores. Pitch your topic with ease and precision using this Highly Ranked Ethical Investing Stocks Infographics PDF. This layout presents information on Valuation Ratings Score, Growth Ratings Score, Financial Strength Ratings Score. It is also available for immediate download and adjustment. So, changes can be made in the color, design, graphics or any other component to create a unique layout.

Cyberbacker Company Summary Company Values Infographics PDF
The following slide highlights the core values of Cyberbacker company to describe the work culture inside the organization. The principle values included are relationship, growth, fun, and wealth. This is a Cyberbacker Company Summary Company Values Infographics PDF template with various stages. Focus and dispense information on four stages using this creative set, that comes with editable features. It contains large content boxes to add your information on topics like Growth, Wealth, Relationship. You can also showcase facts, figures, and other relevant content using this PPT layout. Grab it now.

Banner Set Infographics Template Powerpoint Template
This business slide displays banner set Infographic. Download this diagram to represent concept of finance, management and success. Enlighten your audience with your breathtaking ideas.

Brief History And Key Events Infographics PDF
This slide Provides the key historical events of the company including its founding, expansion, number of clients landmark, new launches etc. This is a brief history and key events infographics pdf. template with various stages. Focus and dispense information on one stages using this creative set, that comes with editable features. It contains large content boxes to add your information on topics like brief history and key events. You can also showcase facts, figures, and other relevant content using this PPT layout. Grab it now.

Challenges In Master Data Management Infographics PDF
Our portfolio of master data management mdm solutions covers advisory, implementation and operation. Working from a business-driven perspective, we address the three distinct business challenges of mdm to provide.This is a Challenges In Master Data Management Infographics PDF template with various stages. Focus and dispense information on three stages using this creative set, that comes with editable features. It contains large content boxes to add your information on topics like Enterprise Centric, Organizational Efficiency, Revenues And Improve. You can also showcase facts, figures, and other relevant content using this PPT layout. Grab it now.

Product Based Market Entry Tactics Infographics PDF
This slide provides insight about various product based market entry strategy which can be implemented by business to improve customer engagement rate. It includes key elements such as product positioning, marketing strategy, product features, pricing strategy, promotion and distribution. Showcasing this set of slides titled Product Based Market Entry Tactics Infographics PDF. The topics addressed in these templates are Product Positioning, Marketing Strategy, Product Features, Pricing, Promotion, Distribution. All the content presented in this PPT design is completely editable. Download it and make adjustments in color, background, font etc. as per your unique business setting.

Corporate Communication Abilities Employee Assessment Infographics PDF
The slide carries an assessment of employees possessing various communication skills and whether they required a training or not. Various elements included are employee name, ratings, area of improvement, official training required and notes section. Showcasing this set of slides titled Corporate Communication Abilities Employee Assessment Infographics PDF. The topics addressed in these templates are Abilities Employee Assessment, Corporate Communication. All the content presented in this PPT design is completely editable. Download it and make adjustments in color, background, font etc. as per your unique business setting.

Monthly Product Sales Analysis Dashboard Infographics PDF
This slide illustrates a dashboard for product sales review to measure to help business monitor and improve productivity, employee engagement and meet revenue targets. It covers product names with sales reps, lead conversion, response time and outbound calls. Showcasing this set of slides titled Monthly Product Sales Analysis Dashboard Infographics PDF. The topics addressed in these templates are Lead Conversion Rate, Outbound Calls, Sales Analysis Dashboard. All the content presented in this PPT design is completely editable. Download it and make adjustments in color, background, font etc. as per your unique business setting.

Benefits Of Conversational Marketing Infographics PDF
Purpose of the following slide is to display benefits of conversational marketing. These benefits can be increase in customer satisfaction rate, better insight into customer behavior, reduction in cost, short sales cycle, increase in lead quality etc. This is a Benefits Of Conversational Marketing Infographics PDF template with various stages. Focus and dispense information on eight stages using this creative set, that comes with editable features. It contains large content boxes to add your information on topics like Customer Satisfaction Rate, Quality, Sales Cycle. You can also showcase facts, figures, and other relevant content using this PPT layout. Grab it now.

Roadmap To Implement 5G Architecture Infographics PDF
This slide represents the roadmap for implementing 5G architecture, including the steps to be performed, such as massive MIMO selection, coverage enhancement, synchronization configuration, NSA and SA strategy, and 5G network deployment strategy in initial stage.Presenting Roadmap To Implement 5G Architecture Infographics PDF to provide visual cues and insights. Share and navigate important information on five stages that need your due attention. This template can be used to pitch topics like Deployment Strategy, Synchronisation, Coverage Enhancement. In addtion, this PPT design contains high resolution images, graphics, etc, that are easily editable and available for immediate download.

Sales Outreach Program Gantt Chart Infographics PDF
This slide includes Gantt chart showcases sales outreach activity to seek customers attention and increase engagement rate. The activities are sent attractive email, sales calls to prospective, social selling, personalized video, live chat and personal meeting. Pitch your topic with ease and precision using this Sales Outreach Program Gantt Chart Infographics PDF. This layout presents information on Attractive Email, Personalized Video, Person Meetings. It is also available for immediate download and adjustment. So, changes can be made in the color, design, graphics or any other component to create a unique layout.

Volume Testing Overview And Objectives Infographics PDF
This slide depicts the volume testing overview and objectives, including the ability to detect issues while handling a large amount of data, an increase of data volume, etc. Slidegeeks has constructed Volume Testing Overview And Objectives Infographics PDF after conducting extensive research and examination. These presentation templates are constantly being generated and modified based on user preferences and critiques from editors. Here, you will find the most attractive templates for a range of purposes while taking into account ratings and remarks from users regarding the content. This is an excellent jumping-off point to explore our content and will give new users an insight into our top-notch PowerPoint Templates.

Employee Financial Challenges With Solutions Infographics PDF
Following slide provides insight about various financial challenges faced by employee which can be used by managers to increase employee engagement rate. It includes elements such as pain points, impact on employees, solutions and results. Pitch your topic with ease and precision using this Employee Financial Challenges With Solutions Infographics PDF. This layout presents information on Error In Salary Payment, Compensation And Bonus, Low Financial Knowledge, Difficulty In Bill Payment. It is also available for immediate download and adjustment. So, changes can be made in the color, design, graphics or any other component to create a unique layout.
Shareholders Engagement Communication Plan Target Infographics PDF
The mentioned slide delineates the communication plan of shareholders which assists to address their concerns . It also includes elements like campaign name, communication type, priority, start date , end date etc. Pitch your topic with ease and precision using this Shareholders Engagement Communication Plan Target Infographics PDF. This layout presents information on Communication Success, Investment Community, Awareness. It is also available for immediate download and adjustment. So, changes can be made in the color, design, graphics or any other component to create a unique layout.

Website Purchasing Experience Evaluation Questionnaire Infographics PDF
The slide shows a questionnaire for evaluating customer purchasing experience to formulate strategic plan enhancing store experience. It includes key components like rating scale, questions, target audience, responses received, etc. Showcasing this set of slides titled Website Purchasing Experience Evaluation Questionnaire Infographics PDF. The topics addressed in these templates are Easy To Explore Items, Product Description Was Appropriate, Prices Were Reasonable. All the content presented in this PPT design is completely editable. Download it and make adjustments in color, background, font etc. as per your unique business setting.

Stacked Line Ppt PowerPoint Presentation Infographics
This is a stacked line ppt powerpoint presentation infographics. This is a two stage process. The stages in this process are business, marketing, growth, success, line.

Key Performance Indicators Ppt Infographics Mockup PDF
The slide shows the key Performance Indicator KPI s which will help the company to track the success rate of implemented strategies. Major KPIs include number of sims sold, number of subscribers, number of towers, 5G technology users, ARPU, customer satisfaction level etc. This is a key performance indicators ppt infographics mockup pdf template with various stages. Focus and dispense information on one stage using this creative set, that comes with editable features. It contains large content boxes to add your information on topics like key performance indicator, technology, customer satisfaction level, target, 2019 to 2022. You can also showcase facts, figures, and other relevant content using this PPT layout. Grab it now.
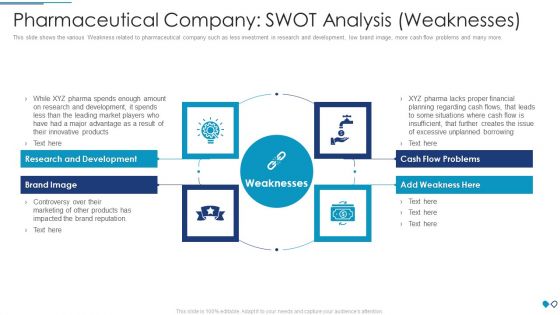
Pharmaceutical Company SWOT Analysis Weaknesses Infographics PDF
This slide shows the various Weakness related to pharmaceutical company such as less investment in research and development, low brand image, more cash flow problems and many more.This is a pharmaceutical company swot analysis weaknesses infographics pdf template with various stages. Focus and dispense information on four stages using this creative set, that comes with editable features. It contains large content boxes to add your information on topics like research and development, cash flow problems, brand image You can also showcase facts, figures, and other relevant content using this PPT layout. Grab it now.

Resource Requirement Management Plan Infographics PDF
This slide covers the resource requirement management plan communicating with the other primary interrelated software development methodologies workflow to achieve the goals. Also covers the requirement analysis workflow with the other software development workflows. Deliver and pitch your topic in the best possible manner with this Resource Requirement Management Plan Infographics PDF. Use them to share invaluable insights on System Design, Implementation Plan, System Documentation, Requirements and impress your audience. This template can be altered and modified as per your expectations. So, grab it now.

Manufacturing Planning And Control Attributes Infographics PDF
This slide showcases various elements of production planning and controlling. It includes product design and development, demand forecasting, capacity planning, equipment selection and maintenance, tools selection and material selection and management. Presenting Manufacturing Planning And Control Attributes Infographics PDF to dispense important information. This template comprises Six stage. It also presents valuable insights into the topics including Product Design Development, Demand Forecasting, Capacity Planning. This is a completely customizable PowerPoint theme that can be put to use immediately. So, download it and address the topic impactfully.

Business Behavioral Learning Framework Infographics PDF
The slide highlights a matrix presenting double loop learning matrix for business to effectively assess and resolve major issues. It includes key elements like vision, mental models, structures, patterns, events, implement, develop, assess and observe. Showcasing this set of slides titled Business Behavioral Learning Framework Infographics PDF. The topics addressed in these templates are Key Insights, Corrections, Implement. All the content presented in this PPT design is completely editable. Download it and make adjustments in color, background, font etc. as per your unique business setting.

Business Pyramid Six Options Infographics Powerpoint Template
This professional diagram slide has been designed with graphics of pyramid six options infographic. You may use this diagram to display success strategy. Download this slide to build impressive presentations.
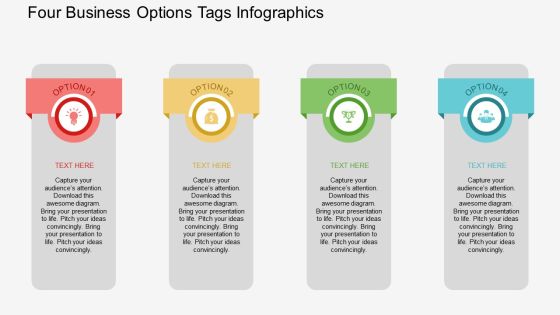
Four Business Options Tags Infographics Powerpoint Template
The above PowerPoint slide displays four options tags infographic. This PowerPoint diagram helps to summarize complex business data. Adjust the above diagram in your business presentations to visually support your content.
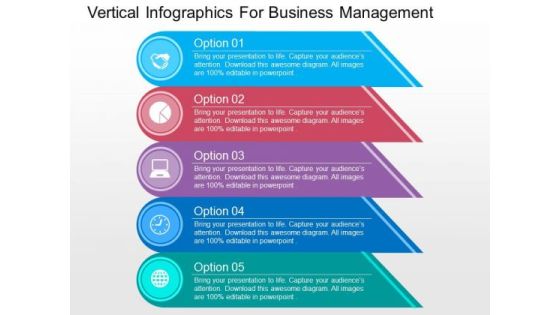
Vertical Infographics For Business Management PowerPoint Templates
Our above PPT slide displays vertical infographic. This diagram slide may use to represent concepts related to business management. Download this template to leave permanent impression on your audience.
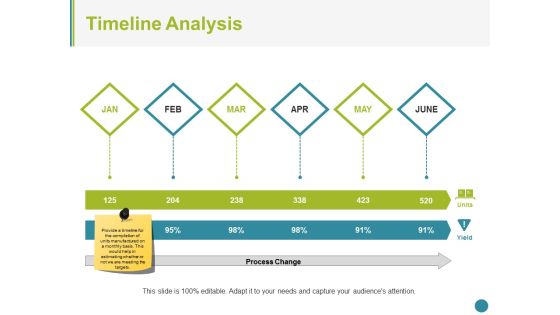
Timeline Analysis Ppt PowerPoint Presentation Ideas Infographics
This is a timeline analysis ppt powerpoint presentation ideas infographics. This is a six stage process. The stages in this process are timeline, analysis, process, strategy, planning, success.

Four Directional Arrows Road Infographics Powerpoint Template
Download this exclusive business diagram to present four steps of financial reporting. This slide contains the four directional arrows road infographic. This PPT diagram slide is useful for business presentations.

Five Cubes Text Tag Infographics Powerpoint Template
This business slide has been designed with cubes text tag infographic. You may download this PowerPoint template to display chain of business steps. This PPT diagram slide will help you to sequence your thoughts.
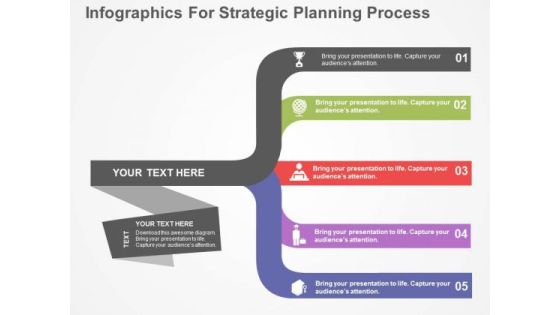
Infographics For Strategic Planning Process PowerPoint Template
Our professionally designed business diagram is as an effective tool for communicating ideas and planning. It contains banner infographic. Convey your strategic planning process with this diagram slide. It will amplify the strength of your logic.
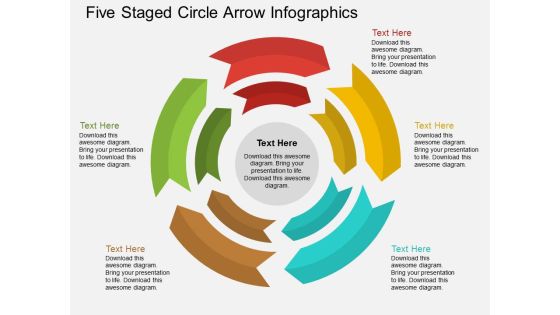
Five Staged Circle Arrow Infographics Powerpoint Template
This pre-designed and appealing graphics offer an optimized possibility to illustrate your business strategy. This PowerPoint slide displays five staged circle arrow infographic. You can present your opinions using this impressive slide.

Four Circular Steps Process Infographics Powerpoint Template
This PowerPoint slide contains circular steps process infographic. This professional slide may be used for visual explanation of data. Adjust the above diagram in your business presentations to give professional impact.
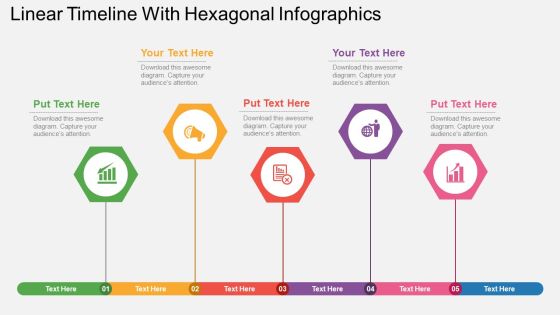
Linear Timeline With Hexagonal Infographics Powerpoint Template
Adjust the above diagram into your presentations to visually support your content. This PPT slide has been professionally designed with linear timeline with hexagonal infographic. This template offers an excellent background to display timeline and planning.
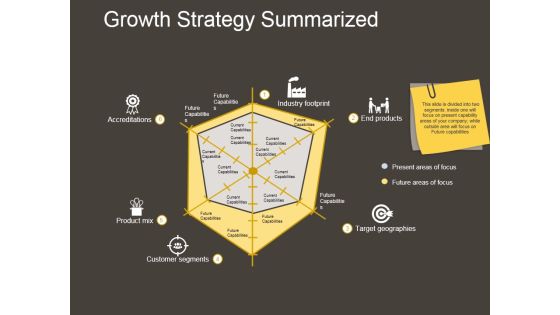
Growth Strategy Summarized Ppt PowerPoint Presentation Infographics
This is a growth strategy summarized ppt powerpoint presentation infographics. This is a six stage process. The stages in this process are accreditations, product mix, customer segments, target geographies, end products, industry footprint.

Analyzing Workplace Flexibility Survey Results Infographics PDF
The following slide outlines result of the remote working survey in the form of statistical data. Using this data the organizations can improve flexible work culture and boost workers morale in the organization. Slidegeeks is here to make your presentations a breeze with Analyzing Workplace Flexibility Survey Results Infographics PDF With our easy to use and customizable templates, you can focus on delivering your ideas rather than worrying about formatting. With a variety of designs to choose from, you are sure to find one that suits your needs. And with animations and unique photos, illustrations, and fonts, you can make your presentation pop. So whether you are giving a sales pitch or presenting to the board, make sure to check out Slidegeeks first.

Service Improvement Plan Pie Chart Ppt Infographics
This is a service improvement plan pie chart ppt infographics. This is a four stage process. The stages in this process are service improvement plan, business, strategy, marketing, management.

Ansoff Matrix For Product Development Ppt Infographics
This is a ansoff matrix for product development ppt infographics. This is a four stage process. The stages in this process are current, market penetration strategy, product development strategy, market development strategy, diversification strategy, growth strategies.

Bar Graph Ppt PowerPoint Presentation Infographics
This is a bar graph ppt powerpoint presentation infographics. This is a five stage process. The stages in this process are business, management, marketing, bar graph, analysis.

Line Chart Ppt PowerPoint Presentation Infographics
This is a line chart ppt powerpoint presentation infographics. This is a two stage process. The stages in this process are line chart, product, business, marketing, management.

Area Chart Ppt PowerPoint Presentation Infographics
This is a area chart ppt powerpoint presentation infographics. This is a one stage process. The stages in this process are sales in percentage, jan, feb, mar, apr.
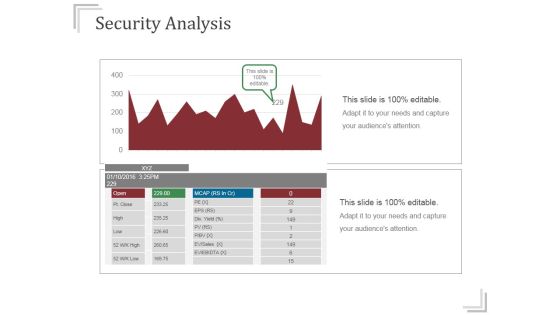
Security Analysis Ppt PowerPoint Presentation Infographics
This is a security analysis ppt powerpoint presentation infographics. This is a two stage process. The stages in this process are business, finance, growth, analysis, success.
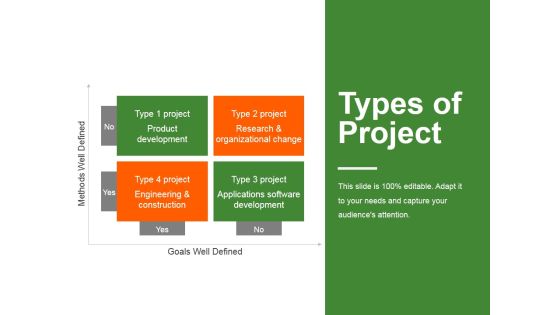
Types Of Project Ppt PowerPoint Presentation Infographics
This is a types of project ppt powerpoint presentation infographics. This is a four stage process. The stages in this process are product development, research and organizational change, engineering and construction, applications software development.

Tqm Principles Ppt PowerPoint Presentation Model Infographics
This is a tqm principles ppt powerpoint presentation model infographics. This is a eight stage process. The stages in this process are supplier relationship, decision making, continual improvement, strategic approach, process approach.
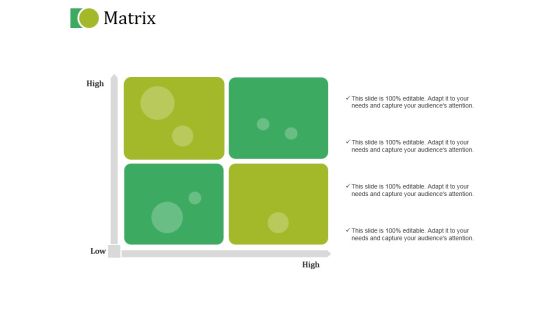
Matrix Ppt PowerPoint Presentation Show Infographics
This is a matrix ppt powerpoint presentation show infographics. This is a four stage process. The stages in this process are high, low, matrix, strategy, planning.
Marketing Launch Plan Ppt PowerPoint Presentation Infographics
This is a marketing launch plan ppt powerpoint presentation infographics. This is a one stage process. The stages in this process are business, marketing, management, launching, planning.
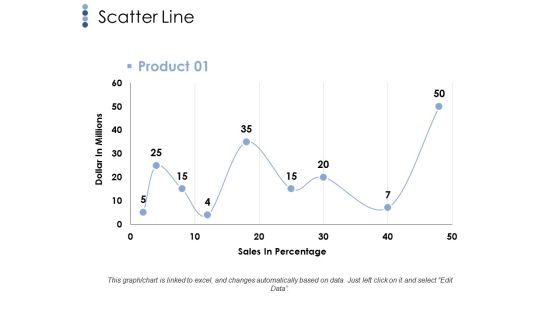
Scatter Line Ppt PowerPoint Presentation File Infographics
This is a scatter line ppt powerpoint presentation file infographics. This is a one stage process. The stages in this process are scatter line, dollar in millions, sales in percentage, business.
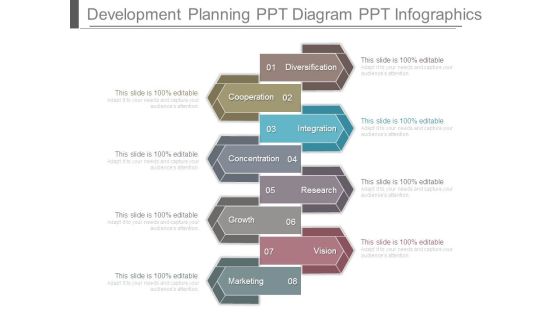
Development Planning Ppt Diagram Ppt Infographics
This is a development planning ppt diagram ppt infographics. This is a eight stage process. The stages in this process are diversification, cooperation, integration, concentration, research, growth, vision, marketing.
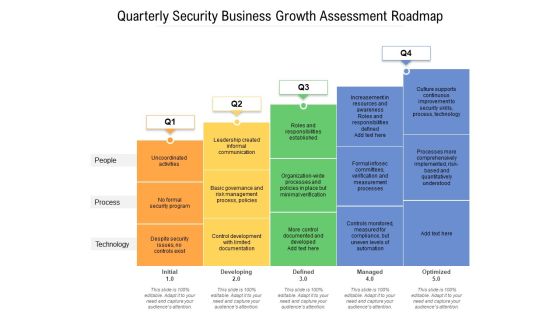
Quarterly Security Business Growth Assessment Roadmap Infographics
Presenting our jaw-dropping quarterly security business growth assessment roadmap infographics. You can alternate the color, font size, font type, and shapes of this PPT layout according to your strategic process. This PPT presentation is compatible with Google Slides and is available in both standard screen and widescreen aspect ratios. You can also download this well-researched PowerPoint template design in different formats like PDF, JPG, and PNG. So utilize this visually-appealing design by clicking the download button given below.

Combo Chart Ppt PowerPoint Presentation Portfolio Infographics
This is a combo chart ppt powerpoint presentation portfolio infographics. This is a eight stage process. The stages in this process are market size, growth, years, finance, business.

Area Chart Ppt PowerPoint Presentation Professional Infographics
This is a area chart ppt powerpoint presentation professional infographics. This is a two stage process. The stages in this process are business, strategy, analysis, planning, area chart.

Successful Ecommerce Business Models Ppt Infographics
This is a successful ecommerce business models ppt infographics. This is a five stage process. The stages in this process are decide, register, open, obtain, launch.
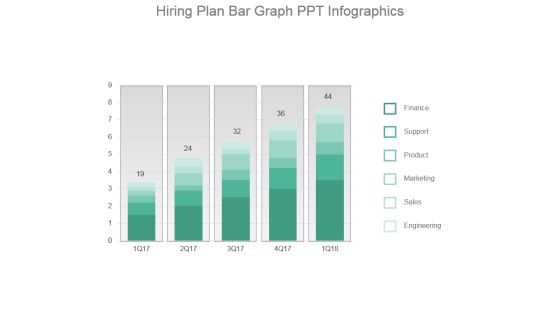
Hiring Plan Bar Graph Ppt Infographics
This is a hiring plan bar graph ppt infographics. This is a five stage process. The stages in this process are finance, support, product, marketing, sales, engineering.
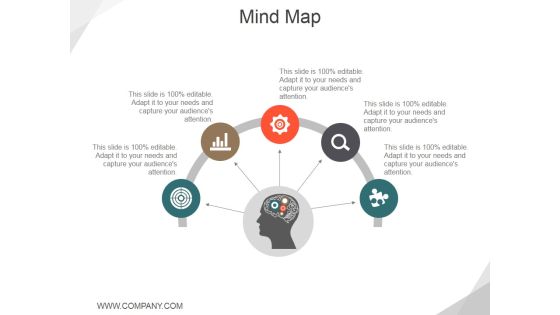
Mind Map Ppt PowerPoint Presentation File Infographics
This is a mind map ppt powerpoint presentation file infographics. This is a five stage process. The stages in this process are semi, icons, management, strategy.

Risk Tolerance Ppt PowerPoint Presentation Summary Infographics
This is a risk tolerance ppt powerpoint presentation summary infographics. This is a three stage process. The stages in this process are high, medium, low.

Combo Chart Ppt PowerPoint Presentation Professional Infographics
This is a combo chart ppt powerpoint presentation professional infographics. This is a three stage process. The stages in this process are combo chart, market size, product.

Our Mission Ppt PowerPoint Presentation Show Infographics
This is a our mission ppt powerpoint presentation show infographics. This is a two stage process. The stages in this process are vision, mission.

Exit Strategy Ppt PowerPoint Presentation Outline Infographics
This is a exit strategy ppt powerpoint presentation outline infographics. This is a one stage process. The stages in this process are acquisition, financial buyer, ipo.
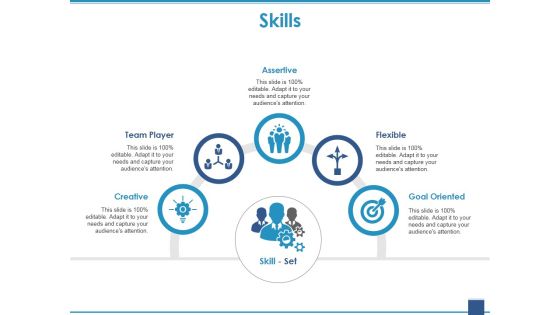
Skills Ppt PowerPoint Presentation Model Infographics
This is a skills ppt powerpoint presentation model infographics. This is a five stage process. The stages in this process are assertive, team player, creative, flexible, goal oriented.
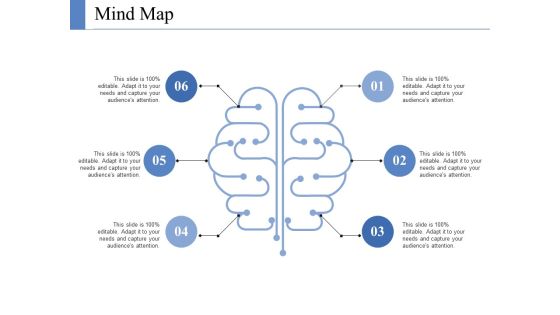
Mind Map Ppt PowerPoint Presentation Layouts Infographics
This is a mind map ppt powerpoint presentation layouts infographics. This is a six stage process. The stages in this process are mind map, marketing, strategy, planning, technology.

Training Evaluation Ppt PowerPoint Presentation File Infographics
This is a training evaluation ppt powerpoint presentation file infographics. This is a four stage process. The stages in this process are results, behavior, learning, reaction, business.
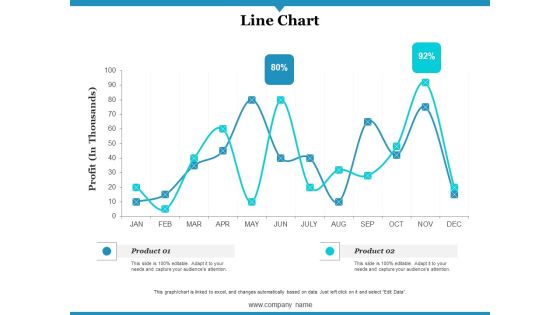
Line Chart Ppt PowerPoint Presentation Gallery Infographics
This is a line chart ppt powerpoint presentation gallery infographics. This is a two stage process. The stages in this process are profit, product, line chart.

Secondary Activities Ppt PowerPoint Presentation File Infographics
This is a secondary activities ppt powerpoint presentation file infographics. This is a four stage process. The stages in this process are procurement, human resource management, technology development, infrastructure, business.
Our Mission Ppt PowerPoint Presentation Gallery Infographics
This is a our mission ppt powerpoint presentation gallery infographics. This is a four stage process. The stages in this process are business, success, management, strategy, development.
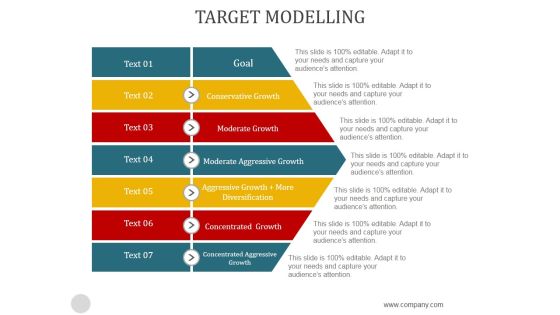
Target Modelling Ppt PowerPoint Presentation Infographics
This is a target modelling ppt powerpoint presentation infographics. This is a seven stage process. The stages in this process are conservative growth, moderate growth, moderate aggressive growth, aggressive growth more diversification, concentrated growth, concentrated aggressive, growth, goal.

Project Planning Process Ppt PowerPoint Presentation Infographics
This is a project planning process ppt powerpoint presentation infographics. This is a seven stage process. The stages in this process are project charter scope, project resource, project quality, project communication, project schedule, project budget and cost, project risk.

About Us Ppt PowerPoint Presentation Infographics
This is a about us ppt powerpoint presentation infographics. This is a one stage process. The stages in this process are business, strategy, analysis, about us, icons.

Sales Breakdown Ppt PowerPoint Presentation Summary Infographics
This is a sales breakdown ppt powerpoint presentation summary infographics. This is a four stage process. The stages in this process are per channel, per region.
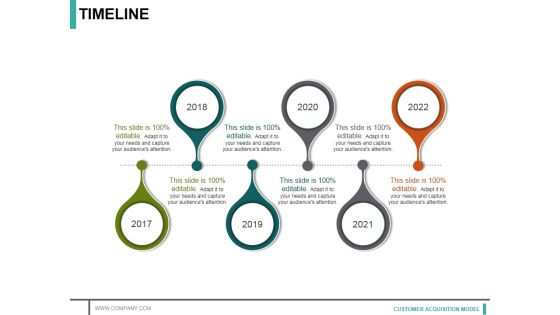
Timeline Ppt PowerPoint Presentation Model Infographics
This is a timeline ppt powerpoint presentation model infographics. This is a six stage process. The stages in this process are year, growth, success, time planning, business.
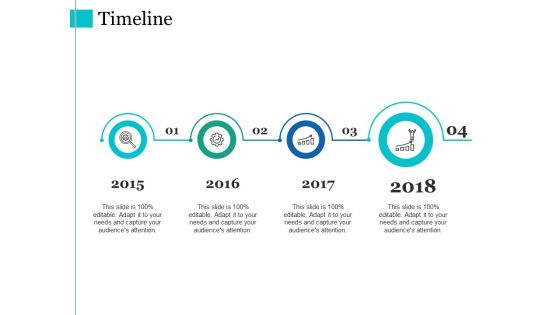
Timeline Ppt PowerPoint Presentation Styles Infographics
This is a timeline ppt powerpoint presentation styles infographics. This is a four stage process. The stages in this process are year, growth, success, time planning, business.

Basic Enhancement Template Diagram Ppt Infographics
This is a basic enhancement template diagram ppt infographics. This is a four stage process. The stages in this process are creative, problem, insight, solution.

Corporate Innovation Performance Diagram Ppt Infographics
This is a corporate innovation performance diagram ppt infographics. This is a six stage process. The stages in this process are value partners, operational innovation, customer experience, strategic resources, business strategy, product innovation.

Campaign Performance Ppt Powerpoint Presentation Summary Infographics
This is a campaign performance ppt powerpoint presentation summary infographics. This is a four stage process. The stages in this process are delivery rate, open rate, click rate, conversion rate.

Financial Measures Ppt PowerPoint Presentation Model Infographics
This is a financial measures ppt powerpoint presentation model infographics. This is a seven stage process. The stages in this process are cost of raw material, revenue from goods sold, inventory holding cost, transportation cost, cost of expired perishable goods.

Brand Pricing Ppt PowerPoint Presentation Icon Infographics
This is a brand pricing ppt powerpoint presentation icon infographics. This is a four stage process. The stages in this process are superior quality, brand, value for money, economical.

Timeline Template 1 Ppt PowerPoint Presentation Infographics
This is a timeline template 1 ppt powerpoint presentation infographics. This is a three stage process. The stages in this process are year, time planning, growth, success.
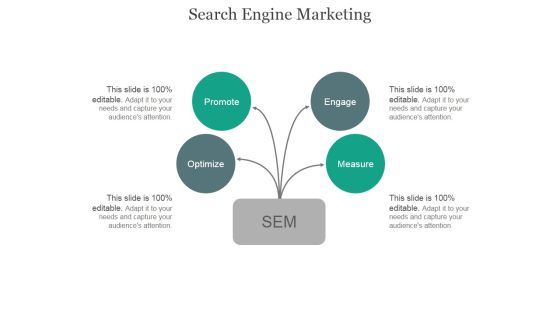
Search Engine Marketing Ppt PowerPoint Presentation Infographics
This is a search engine marketing ppt powerpoint presentation infographics. This is a four stage process. The stages in this process are optimize, promote, engage, measure.

Bar Chart Ppt PowerPoint Presentation Outline Infographics
This is a bar chart ppt powerpoint presentation outline infographics. This is a two stage process. The stages in this process are bar chart, finance, marketing, strategy, analysis, business.
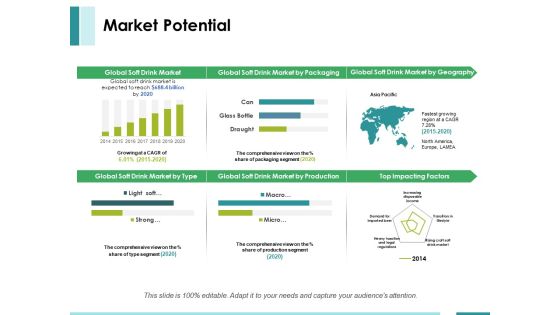
Market Potential Ppt PowerPoint Presentation Pictures Infographics
This is a market potential ppt powerpoint presentation pictures infographics. This is a two stage process. The stages in this process are top impacting factors, asia pacific, global soft drink market by type, global soft drink market.

Modern Business Infographics Design PowerPoint Templates
Use our above slide displays modern business Infographics. This template has been designed with text boxes and icons. Blend your views with this professional image.
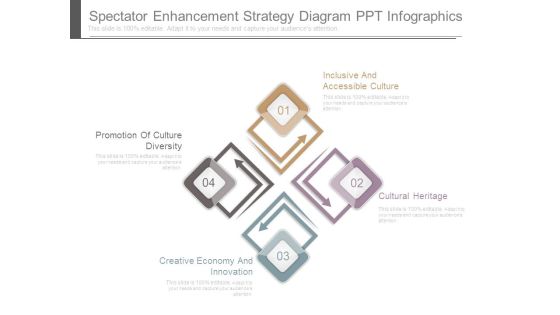
Spectator Enhancement Strategy Diagram Ppt Infographics
This is a spectator enhancement strategy diagram ppt infographics. This is a four stage process. The stages in this process are promotion of culture diversity, creative economy and innovation, cultural heritage, inclusive and accessible culture.
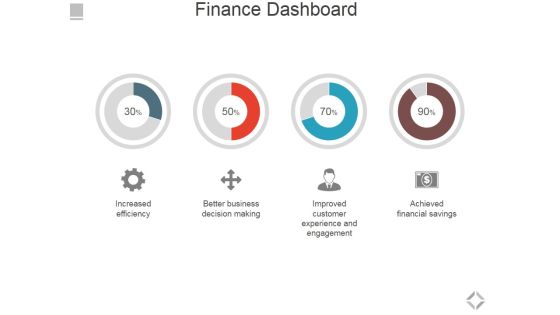
Finance Dashboard Ppt PowerPoint Presentation Layouts Infographics
This is a finance dashboard ppt powerpoint presentation layouts infographics. This is a four stage process. The stages in this process are increased efficiency, better business decision making, improved customer experience and engagement, achieved financial savings.

Magnifying Glass Ppt PowerPoint Presentation Infographics
This is a magnifying glass ppt powerpoint presentation infographics. This is a five stage process. The stages in this process are business, marketing, management, process, magnifier glass.
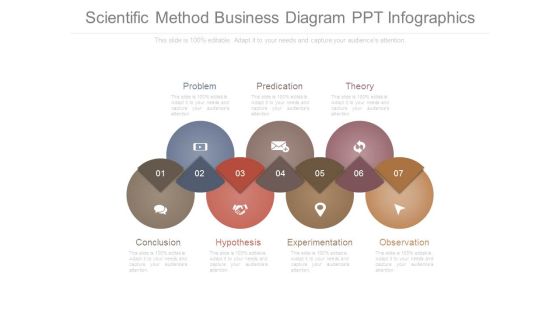
Scientific Method Business Diagram Ppt Infographics
This is a scientific method business diagram ppt infographics. This is a seven stage process. The stages in this process are conclusion, problem, hypothesis, predication, experimentation, theory, observation.
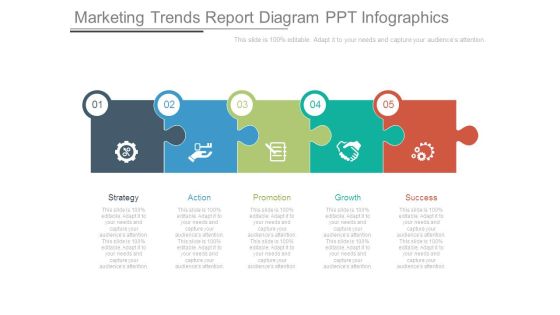
Marketing Trends Report Diagram Ppt Infographics
This is a marketing trends report diagram ppt infographics. This is a five stage process. The stages in this process are strategy, action, promotion, growth, success.

Departments And Team Ppt PowerPoint Presentation Infographics
This is a departments and team ppt powerpoint presentation infographics. This is a three stage process. The stages in this process are product manager, graphic designer, web designer, marketing, ceo.

Market Budget Ppt PowerPoint Presentation Infographics
This is a market budget ppt powerpoint presentation infographics. This is a five stage process. The stages in this process are marketing objectives, target marketing, business opportunities, competition, product and services.
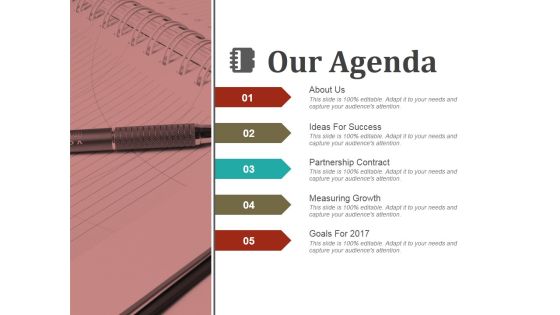
Our Agenda Ppt PowerPoint Presentation Infographics
This is a our agenda ppt powerpoint presentation infographics. This is a five stage process. The stages in this process are about us, ideas for success, partnership contract, measuring growth.

Company Name Template3 Ppt PowerPoint Presentation Infographics
This is a company name template3 ppt powerpoint presentation infographics. This is a three stage process. The stages in this process are vision, mission, goal.
Funnel Ppt PowerPoint Presentation Icon Infographics
This is a funnel ppt powerpoint presentation icon infographics. This is a four stage process. The stages in this process are business, marketing, funnel, process, planning.

Infographics For Business Level Strategies PowerPoint Templates
This PowerPoint template contains four level Infographics. This diagram has been designed with four tags with icons to depict business level strategies. Use this diagram to set targets and to measure performance in your presentations.
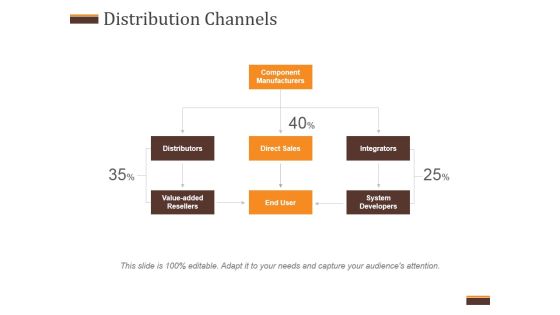
Distribution Channels Ppt PowerPoint Presentation Infographics
This is a distribution channels ppt powerpoint presentation infographics. This is a three stage process. The stages in this process are component manufacturers, distributors, direct sales, integrators, value added resellers, end user, system developers.

Biotech Industry Report Diagram Ppt Infographics
This is a biotech industry report diagram ppt infographics. This is a four stage process. The stages in this process are agriculture, chemicals, phar maceuticals, information technology.

Channel Management Decisions Diagram Ppt Infographics
This is a channel management decisions diagram ppt infographics. This is a four stage process. The stages in this process are decide, observe, act, selecting.

Business Inventory Accounting Diagram Ppt Infographics
This is a business inventory accounting diagram ppt infographics. This is a three stage process. The stages in this process are beginning inventory, purchases, goods available for sale, cost goods sold, ending inventory.

Radar Chart Ppt PowerPoint Presentation Styles Infographics
This is a radar chart ppt powerpoint presentation styles infographics. This is a six stage process. The stages in this process are business, marketing, product, radar chart, strategy.
Our Goal Ppt PowerPoint Presentation Model Infographics
This is a our goal ppt powerpoint presentation model infographics. This is a four stage process. The stages in this process are goal, arrows, planning, process, business.

Generate Idea Ppt PowerPoint Presentation Layouts Infographics
This is a generate idea ppt powerpoint presentation layouts infographics. This is a one stage process. The stages in this process are business, marketing, analysis, strategy, idea bulb.

Milestones Achieved Ppt PowerPoint Presentation Infographics
This is a milestones achieved ppt powerpoint presentation infographics. This is a five stage process. The stages in this process are business, strategy, marketing, analysis, success, time line.

Mind Map Ppt PowerPoint Presentation Infographics
This is a mind map ppt powerpoint presentation infographics. This is a one stage process. The stages in this process are mind map, icons, memory, analysis, success, management.
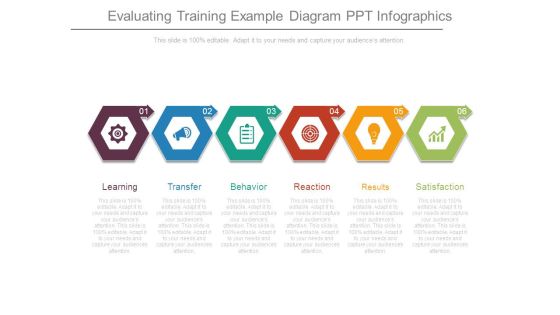
Evaluating Training Example Diagram Ppt Infographics
This is a evaluating training example diagram ppt infographics. This is a six stage process. The stages in this process are learning, transfer, behavior, reaction, results, satisfaction.
 Home
Home