Progress Infographic

Digital Technological Innovation Four Quarter Roadmap Infographics
Presenting our innovatively structured digital technological innovation four quarter roadmap infographics Template. Showcase your roadmap process in different formats like PDF, PNG, and JPG by clicking the download button below. This PPT design is available in both Standard Screen and Widescreen aspect ratios. It can also be easily personalized and presented with modified font size, font type, color, and shapes to measure your progress in a clear way.
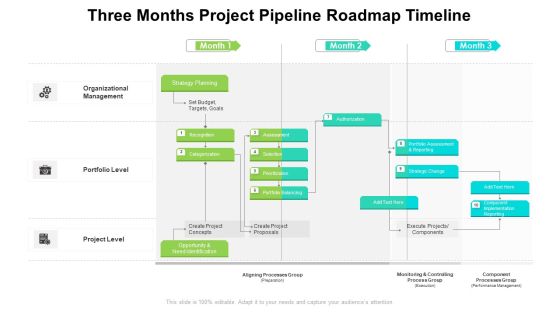
Three Months Project Pipeline Roadmap Timeline Infographics
Presenting our innovatively structured three months project pipeline roadmap timeline infographics Template. Showcase your roadmap process in different formats like PDF, PNG, and JPG by clicking the download button below. This PPT design is available in both Standard Screen and Widescreen aspect ratios. It can also be easily personalized and presented with modified font size, font type, color, and shapes to measure your progress in a clear way.

Consulting Portfolio Project Status Report Infographics PDF
The following slide showcases portfolio project status report that outlines the progress of goals pursued by the. The following report includes portfolio status and financial Showcasing this set of slides titled Consulting Portfolio Project Status Report Infographics PDF. The topics addressed in these templates are Project, Budget, Resources. All the content presented in this PPT design is completely editable. Download it and make adjustments in color, background, font etc. as per your unique business setting.
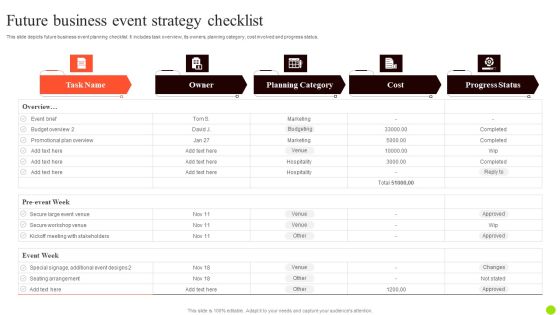
Future Business Event Strategy Checklist Infographics PDF
This slide depicts future business event planning checklist. It includes task overview, its owners, planning category, cost involved and progress status. Showcasing this set of slides titled Future Business Event Strategy Checklist Infographics PDF. The topics addressed in these templates are Planning Category, Cost, Strategy Checklist. All the content presented in this PPT design is completely editable. Download it and make adjustments in color, background, font etc. as per your unique business setting.

Guidelines To Develop Effective Strategic Planning Process Infographics PDF
This slide displays guidelines that can be used by managers while formulating strategic plan. Guideline covered are focusing on right team formation, information gathering, developing mission statement, establishing and executing strategic plan, and evaluating the progress. Create an editable Guidelines To Develop Effective Strategic Planning Process Infographics PDF that communicates your idea and engages your audience. Whether you are presenting a business or an educational presentation, pre-designed presentation templates help save time. Guidelines To Develop Effective Strategic Planning Process Infographics PDF is highly customizable and very easy to edit, covering many different styles from creative to business presentations. Slidegeeks has creative team members who have crafted amazing templates. So, go and get them without any delay.

Five Steps Circular Infographics Diagram Powerpoint Template
This PowerPoint template has been designed with circular infographic diagram. This Infographic diagram may be used for business process analysis. Download this impressive diagram to build unique presentations.
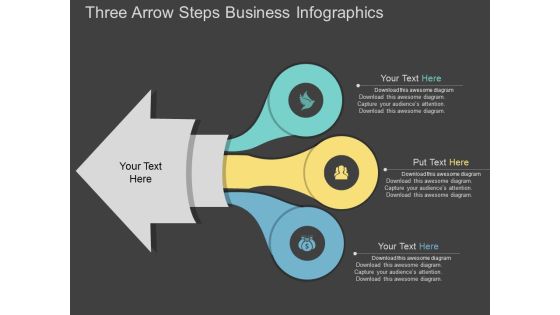
Three Arrow Steps Business Infographics Powerpoint Template
This PowerPoint template has been designed with business infographic layout. Download this professional slide to depict steps of financial planning. Enlighten your audience with your breathtaking ideas.

Circles Infographics With Text Space Powerpoint Templates
Circular infographic has been displayed in this business slide. This business diagram helps to exhibit process of target planning. Use this diagram to build an exclusive presentation.

Triangle Infographics For Growth Indication Powerpoint Template
Our above PPT slide has been designed triangle infographic with growth arrow. This PowerPoint template is suitable to present strategic management for business growth. Use this business diagram to present your work in a more smart and precise manner.

Infographics For Market Research Data Powerpoint Template
Our professionally designed business diagram is as an effective tool for communicating market research and planning. It contains infographic template design. Convey your views with this diagram slide. It will amplify the strength of your logic.

Five Colored Business Infographics Tags Powerpoint Template
Develop competitive advantage with our above template which contains business infographic tags. This diagram helps to display business information in visual manner. You can edit text, color, shade and style as per you need.

Business Infographics Theme Design Powerpoint Slides
This PPT slide has been designed with circular arrows infographic diagram. This business diagram is suitable for marketing research and analysis. This professional slide helps in making an instant impact on viewers.

Infographics For Market Development Strategy Powerpoint Template
This PowerPoint template has been designed with infographic diagram. This PowerPoint template may be used for market development strategy. Prove the viability of your ideas using this impressive slide.
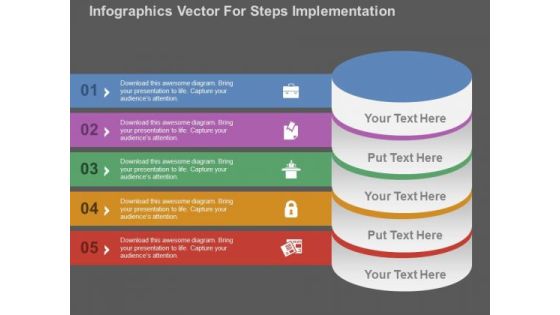
Infographics Vector For Steps Implementation PowerPoint Templates
Our above image has design of five staged infographic chart. This diagram is designed for steps implementation. Add this PowerPoint template in your presentations to visually support your content
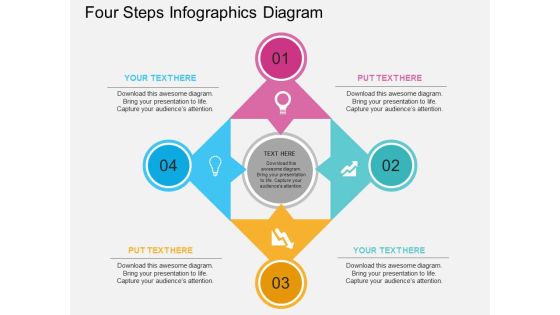
Four Steps Infographics Diagram Powerpoint Template
Four steps infographic diagram has been displayed in this business slide. This business diagram helps to exhibit process of target planning. Use this diagram to build an exclusive presentation.
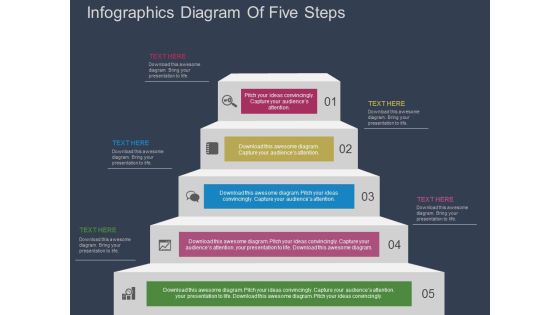
Infographics Diagram Of Five Steps Powerpoint Template
This business slide has been designed with infographic diagram of five steps. This PowerPoint diagram is suitable to present business process steps This professional slide helps in making an instant impact on viewers.

Four Steps Stair Infographics Design Powerpoint Template
Our above template contains stair infographic design of four steps. Download this PPT slide to exhibit management of business functions. Use this eye-catchy slide to make unique business presentations.

Cloud Design Infographics With Screen Powerpoint Template
Our above PPT slide has been designed with cloud infographic with screen. This PowerPoint template may be used for technology related topics. You can present your opinions using this impressive slide.

Colorful Infographics For Corporate Financing Powerpoint Template
This business slide contains five steps circular infographic design. This diagram provides schematic representation of any information. Visual effect this slide helps in maintaining the flow of the discussion and provides more clarity to the subject.

Four Petal Infographics On Globe Powerpoint Template
This PowerPoint slide contains design of four petal infographic on globe. This slide helps to global business planning. Illustrate your plans to your listeners with using this PowerPoint template.

Circular Gear Process Infographics Diagram Powerpoint Template
This business slide contains circular infographic design. This diagram may be used for developing a marketing strategy. Visual effect this slide helps in maintaining the flow of the discussion and provides more clarity to the subject.
News Paper Infographics Diagram Powerpoint Slides
This PowerPoint template has been designed with newspaper infographic layout. This PPT slide may be used to display concepts like information, business news and communication. Develop your marketing strategy by using this PPT slide.

Sample Sales Cycle Flow Chart Ppt Infographics
This is a sample sales cycle flow chart ppt infographics. This is a seven stage process. The stages in this process are fix it, feedback, ask customers, assess progress, set the improved product, make changes, improve it.
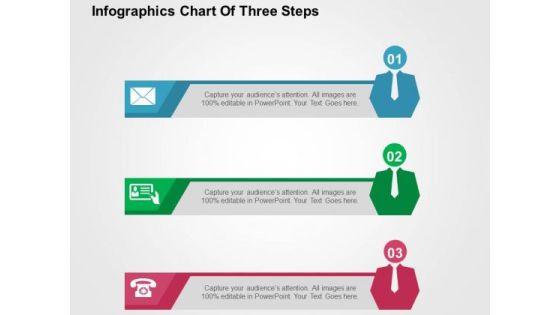
Infographics Chart Of Three Steps PowerPoint Templates
The above slide display graphic of text boxes with business men icons. This PPT slide is designed to define concepts like progress, competition, and leadership. Use this business diagram slide to make attractive presentations.
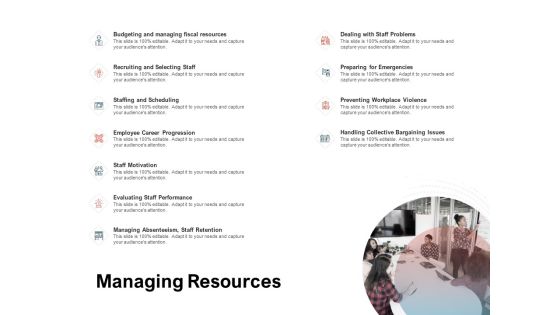
Team Manager Administration Managing Resources Infographics Pdf
Presenting team manager administration managing resources infographics pdf. to provide visual cues and insights. Share and navigate important information on eleven stages that need your due attention. This template can be used to pitch topics like staffing and scheduling, staff motivation, employee career progression, recruiting and selecting staff, dealing staff problems. In addtion, this PPT design contains high-resolution images, graphics, etc, that are easily editable and available for immediate download.

Scrum Task Project Management Board Infographics PDF
The following slide showcases task management board for scrum project teams. It contains details about backlog, to do, in progress, review and evaluation, done, task priority, task managers, etc. Persuade your audience using this Scrum Task Project Management Board Infographics PDF. This PPT design covers one stages, thus making it a great tool to use. It also caters to a variety of topics including Pricing Plans, Business, Payment Methods. Download this PPT design now to present a convincing pitch that not only emphasizes the topic but also showcases your presentation skills.
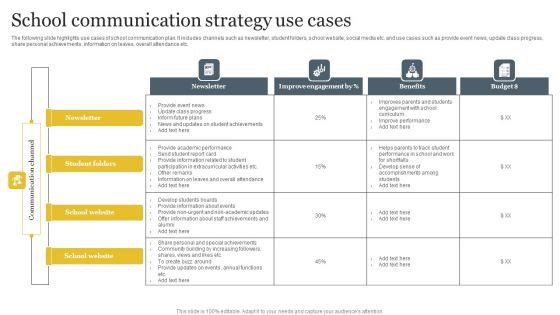
School Communication Strategy Use Cases Infographics PDF
The following slide highlights use cases of school communication plan. It includes channels such as newsletter, student folders, school website, social media etc. and use cases such as provide event news, update class progress, share personal achievements, information on leaves, overall attendance etc. Pitch your topic with ease and precision using this School Communication Strategy Use Cases Infographics PDF. This layout presents information on Newsletter, Student Folders, School Website. It is also available for immediate download and adjustment. So, changes can be made in the color, design, graphics or any other component to create a unique layout.

Engineering Quarterly Roadmap For Blockchain Development Infographics
Introducing our engineering quarterly roadmap for blockchain development infographics. This PPT presentation is Google Slides compatible, therefore, you can share it easily with the collaborators for measuring the progress. Also, the presentation is available in both standard screen and widescreen aspect ratios. So edit the template design by modifying the font size, font type, color, and shapes as per your requirements. As this PPT design is fully editable it can be presented in PDF, JPG and PNG formats.
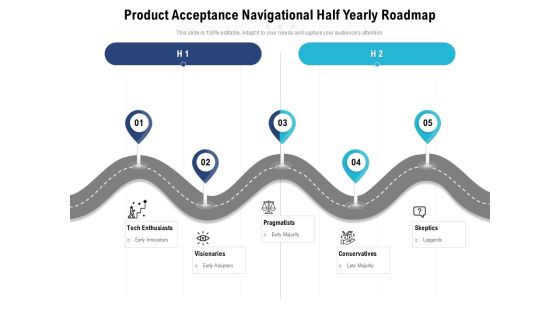
Product Acceptance Navigational Half Yearly Roadmap Infographics
Introducing our product acceptance navigational half yearly roadmap infographics. This PPT presentation is Google Slides compatible, therefore, you can share it easily with the collaborators for measuring the progress. Also, the presentation is available in both standard screen and widescreen aspect ratios. So edit the template design by modifying the font size, font type, color, and shapes as per your requirements. As this PPT design is fully editable it can be presented in PDF, JPG and PNG formats.

5 Year Goods Production Digitalization Roadmap Infographics
Introducing our 5 year goods production digitalization roadmap infographics. This PPT presentation is Google Slides compatible, therefore, you can share it easily with the collaborators for measuring the progress. Also, the presentation is available in both standard screen and widescreen aspect ratios. So edit the template design by modifying the font size, font type, color, and shapes as per your requirements. As this PPT design is fully editable it can be presented in PDF, JPG and PNG formats.

Half Yearly Company Technology Change Roadmap Infographics
Introducing our half yearly company technology change roadmap infographics. This PPT presentation is Google Slides compatible, therefore, you can share it easily with the collaborators for measuring the progress. Also, the presentation is available in both standard screen and widescreen aspect ratios. So edit the template design by modifying the font size, font type, color, and shapes as per your requirements. As this PPT design is fully editable it can be presented in PDF, JPG and PNG formats.
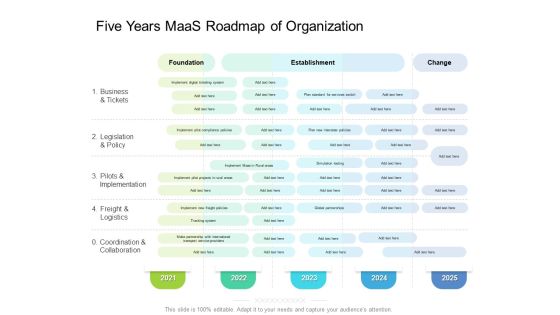
Five Years Maas Roadmap Of Organization Infographics
Introducing our five years maas roadmap of organization infographics. This PPT presentation is Google Slides compatible, therefore, you can share it easily with the collaborators for measuring the progress. Also, the presentation is available in both standard screen and widescreen aspect ratios. So edit the template design by modifying the font size, font type, color, and shapes as per your requirements. As this PPT design is fully editable it can be presented in PDF, JPG and PNG formats.

5 Year Data Analytics Roadmap Infographics
Introducing our 5 year data analytics roadmap infographics. This PPT presentation is Google Slides compatible, therefore, you can share it easily with the collaborators for measuring the progress. Also, the presentation is available in both standard screen and widescreen aspect ratios. So edit the template design by modifying the font size, font type, color, and shapes as per your requirements. As this PPT design is fully editable it can be presented in PDF, JPG and PNG formats.

Cryptocurrency Lightning Webwork Half Yearly Roadmap Infographics
Introducing our cryptocurrency lightning webwork half yearly roadmap infographics. This PPT presentation is Google Slides compatible, therefore, you can share it easily with the collaborators for measuring the progress. Also, the presentation is available in both standard screen and widescreen aspect ratios. So edit the template design by modifying the font size, font type, color, and shapes as per your requirements. As this PPT design is fully editable it can be presented in PDF, JPG and PNG formats.

Business Operations Ability Half Yearly Roadmap Infographics
Introducing our business operations ability half yearly roadmap infographics. This PPT presentation is Google Slides compatible, therefore, you can share it easily with the collaborators for measuring the progress. Also, the presentation is available in both standard screen and widescreen aspect ratios. So edit the template design by modifying the font size, font type, color, and shapes as per your requirements. As this PPT design is fully editable it can be presented in PDF, JPG and PNG formats.

Five Years Data Analysis Procedure Roadmap Infographics
Introducing our five years data analysis procedure roadmap infographics. This PPT presentation is Google Slides compatible, therefore, you can share it easily with the collaborators for measuring the progress. Also, the presentation is available in both standard screen and widescreen aspect ratios. So edit the template design by modifying the font size, font type, color, and shapes as per your requirements. As this PPT design is fully editable it can be presented in PDF, JPG and PNG formats.
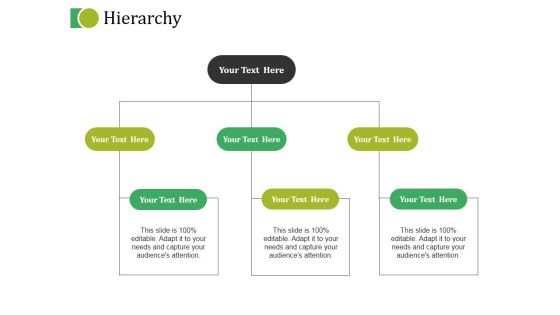
Hierarchy Ppt PowerPoint Presentation Infographics Format Ideas
This is a hierarchy ppt powerpoint presentation infographics format ideas. This is a three stage process. The stages in this process are hierarchy, business, marketing, strategy, planning.
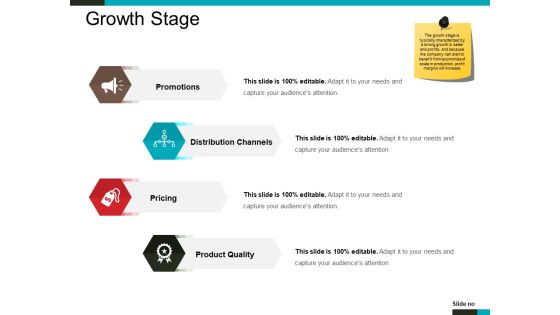
Growth Stage Ppt PowerPoint Presentation Infographics Vector
This is a growth stage ppt powerpoint presentation infographics vector. This is a four stage process. The stages in this process are promotions, distribution channels, pricing, icons.

2 Year Data Management Evolution Infographics PDF
This slide signifies the 2 year Evolution on data management. It comparison includes data system, governance, sourcing with vision. Showcasing this set of slides titled 2 Year Data Management Evolution Infographics PDF. The topics addressed in these templates are Data Sourcing, Governance, Data System. All the content presented in this PPT design is completely editable. Download it and make adjustments in color, background, font etc. as per your unique business setting.

Bar Graph Ppt PowerPoint Presentation Infographics Pictures
This is a bar graph ppt powerpoint presentation infographics pictures. This is a six stage process. The stages in this process are bar graph, business, marketing, success, growth.

Line Chart Ppt PowerPoint Presentation Infographics Ideas
This is a line chart ppt powerpoint presentation infographics ideas. This is a two stage process. The stages in this process are growth, graph, marketing.
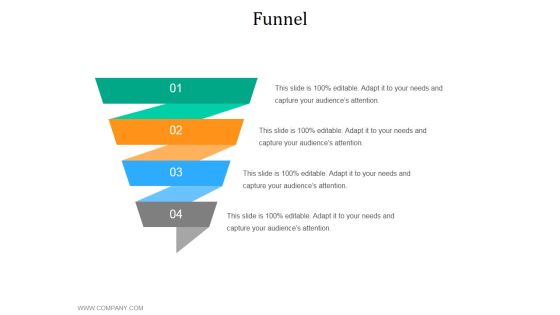
Funnel Ppt PowerPoint Presentation Infographics Ideas
This is a funnel ppt powerpoint presentation infographics ideas. This is a four stage process. The stages in this process are business, marketing, funnel, process, planning.
Target Ppt PowerPoint Presentation Infographics Icons
This is a target ppt powerpoint presentation infographics icons. This is a four stage process. The stages in this process are target, success, planning, strategy, business, marketing, management.

Target Ppt PowerPoint Presentation Infographics Rules
This is a target ppt powerpoint presentation infographics rules. This is a one stage process. The stages in this process are target, success, business, management, achieve.

Column Chart Ppt PowerPoint Presentation Infographics Model
This is a column chart ppt powerpoint presentation infographics model. This is a two stage process. The stages in this process are bar graph, growth, product, percentage, year.
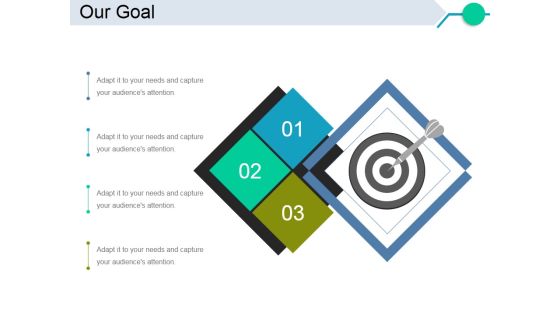
Our Goal Ppt PowerPoint Presentation Infographics Shapes
This is a our goal ppt powerpoint presentation infographics shapes. This is a stage process. The stages in this process are .

Scatter Line Ppt PowerPoint Presentation Infographics Skills
This is a scatter line ppt powerpoint presentation infographics skills. This is a one stage process. The stages in this process are growth, success, business, marketing, management.

Bubble Chart Ppt PowerPoint Presentation Infographics Images
This is a bubble chart ppt powerpoint presentation infographics images. This is a two stage process. The stages in this process are product, bubble chart, business, growth, success.
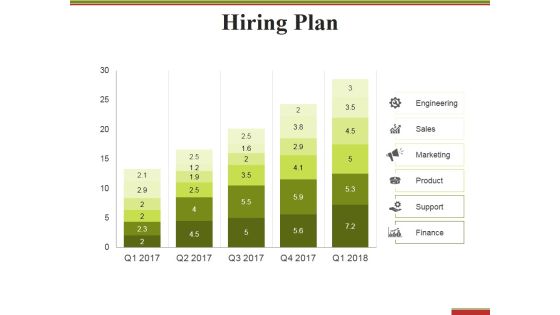
Hiring Plan Ppt PowerPoint Presentation Infographics Model
This is a hiring plan ppt powerpoint presentation infographics model. This is a five stage process. The stages in this process are engineering, sales, marketing, product, support.
Impotent Notes Ppt PowerPoint Presentation Infographics Layouts
This is a impotent notes ppt powerpoint presentation infographics layouts. This is a four stage process. The stages in this process are impotent notes, marketing, strategy, business, success.
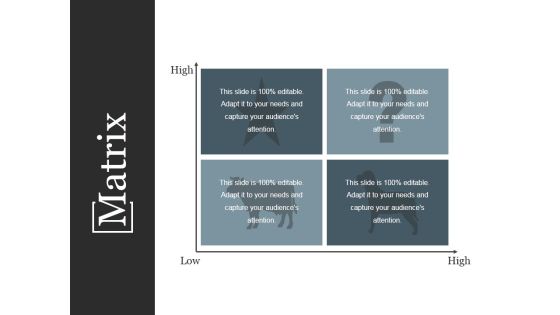
Matrix Ppt PowerPoint Presentation Infographics File Formats
This is a matrix ppt powerpoint presentation infographics file formats. This is a four stage process. The stages in this process are high, low.
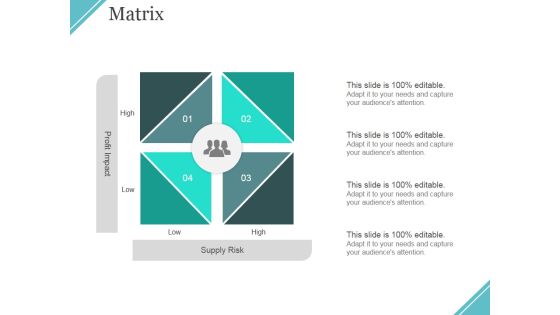
Matrix Ppt PowerPoint Presentation Infographics Display
This is a matrix ppt powerpoint presentation infographics display. This is a four stage process. The stages in this process are high, low, profit impact, supply risk, business.
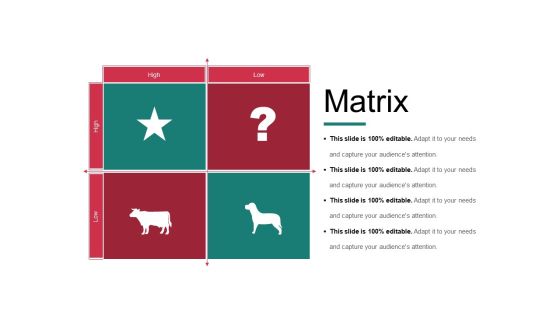
Matrix Ppt PowerPoint Presentation Infographics Guidelines
This is a matrix ppt powerpoint presentation infographics guidelines. This is a four stage process. The stages in this process are high, business, marketing, low, matrix.

Target Ppt PowerPoint Presentation Infographics Show
This is a target ppt powerpoint presentation infographics show. This is a three stage process. The stages in this process are business, marketing, goal, intention, success.

Thank You Ppt PowerPoint Presentation Infographics Maker
This is a thank you ppt powerpoint presentation infographics maker. This is a one stage process. The stages in this process are thank you, success, planning, marketing, business.

Timeline Ppt Template 8 Staged Circular Infographics
Open Up Doors That Lead To Success. Our Timeline Ppt Template 8 Staged Circular Infographics Powerpoint Templates Provide The Handles.

Matrix Ppt PowerPoint Presentation Infographics Graphics Design
This is a matrix ppt powerpoint presentation infographics graphics design. This is a four stage process. The stages in this process are business, marketing, matrix, planning, strategy.
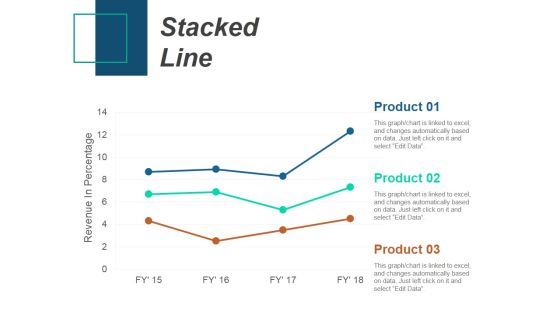
Stacked Line Ppt PowerPoint Presentation Infographics Slideshow
This is a stacked line ppt powerpoint presentation infographics slideshow. This is a three stage process. The stages in this process are stacked line, revenue in percentage, product.

Thank You Ppt PowerPoint Presentation Infographics Example
This is a thank you ppt powerpoint presentation infographics example. This is a one stage process. The stages in this process are thank you, planning, management, business, strategy.

Competitors Objectives Ppt PowerPoint Presentation Infographics Topics
This is a competitors objectives ppt powerpoint presentation infographics topics. This is a two stage process. The stages in this process are long term objectives, short term objectives.

 Home
Home