Progress Bar

Curve Bar Graph For Process Capability Measurement Powerpoint Guide
This is a curve bar graph for process capability measurement powerpoint guide. This is a nine stage process. The stages in this process are target, lsl, usl, category.
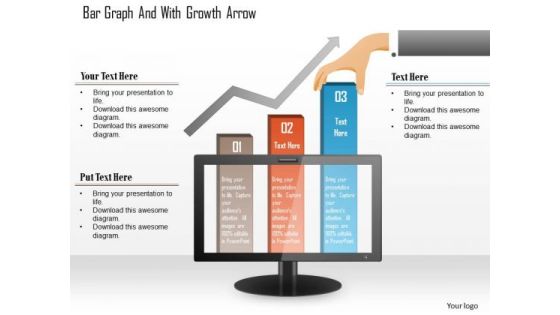
Business Diagram Bar Graph And With Growth Arrow Presentation Template
Our above diagram slide displays bar graph graph that shows relationships between different data series. Use this diagram in your presentations to get good remarks from your viewers.

Bar Chart Ppt PowerPoint Presentation Icon Infographic Template
This is a bar chart ppt powerpoint presentation icon infographic template. This is a nine stage process. The stages in this process are product, marketing, management, business, success.

bar graph template 1 ppt powerpoint presentation infographics
This is a bar graph template 1 ppt powerpoint presentation infographics. This is a five stage process. The stages in this process are business, marketing, graph, analysis, growth.

bar graph template 2 ppt powerpoint presentation gallery
This is a bar graph template 2 ppt powerpoint presentation gallery. This is a four stage process. The stages in this process are business, marketing, product, analysis, growth.

Company Performance Dashboard Icon With Bar Graph Template PDF
Persuade your audience using this company performance dashboard icon with bar graph template pdf. This PPT design covers four stages, thus making it a great tool to use. It also caters to a variety of topics including company performance dashboard icon with bar graph. Download this PPT design now to present a convincing pitch that not only emphasizes the topic but also showcases your presentation skills.

Bar Graph Ppt PowerPoint Presentation Layouts Graphic Images
This is a bar graph ppt powerpoint presentation layouts graphic images. This is a four stage process. The stages in this process are product, business, marketing, growth.

Bar Graph Ppt PowerPoint Presentation Pictures Graphics Pictures
This is a bar graph ppt powerpoint presentation pictures graphics pictures. This is a five stage process. The stages in this process are graph, growth, business, marketing, finance.

Financials Bar Graph For Expectation Analysis Powerpoint Slide Deck Samples
This is a financials bar graph for expectation analysis powerpoint slide deck samples. This is a four stage process. The stages in this process are product version.
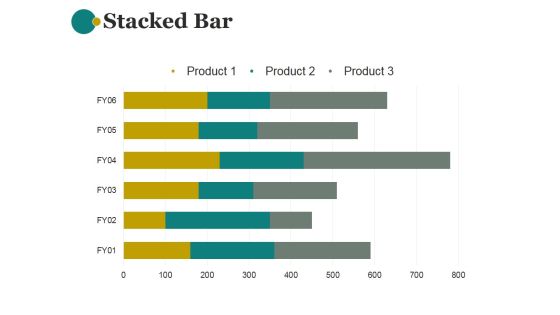
Stacked Bar Template 2 Ppt PowerPoint Presentation Rules
This is a stacked bar template 2 ppt powerpoint presentation rules. This is a three stage process. The stages in this process are product, planning ,business, management, strategy.
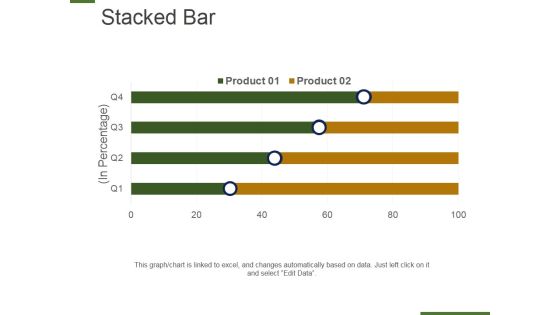
Stacked Bar Template 1 Ppt PowerPoint Presentation Show Smartart
This is a stacked bar template 1 ppt powerpoint presentation show smartart. This is a four stage process. The stages in this planning, management, strategy, marketing, business.

Bar Diagram Ppt PowerPoint Presentation Ideas Infographic Template
This is a bar diagram ppt powerpoint presentation ideas infographic template. This is a four stage process. The stages in this process are business, finance, marketing, strategy, analysis.
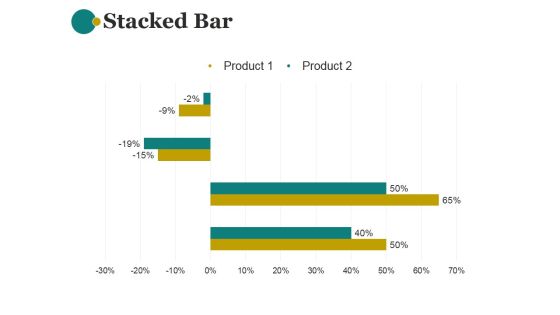
Stacked Bar Template 1 Ppt PowerPoint Presentation Show
This is a stacked bar template 1 ppt powerpoint presentation show. This is a two stage process. The stages in this process are product, planning ,business, management, strategy.

Bar Chart Ppt PowerPoint Presentation Styles Graphics Example
This is a bar chart ppt powerpoint presentation styles graphics example. This is a nine stage process. The stages in this process are graph, growth, success, business, finance.

Bar Graph Infographics For Business Analysis Powerpoint Template
This PowerPoint template contains bar graph with icons. This PPT slide helps to exhibit concepts like strategy, direction and success. Use this business slide to make impressive presentations.

Bar Graph Business PowerPoint Templates And PowerPoint Themes 1012
Bar Graph Business PowerPoint Templates And PowerPoint Themes 1012-This PowerPoint Template shows the Bar Graph with increasing percentage which signifies the Financial Growth. The Template signifies the concept of business growth. The structure of our templates allows you to effectively highlight the key issues concerning the growth of your business. Our PPT images are so ideally designed that it reveals the very basis of our PPT template are an effective tool to make your clients understand.-Bar Graph Business PowerPoint Templates And PowerPoint Themes 1012-This PowerPoint template can be used for presentations relating to-Financial bar graph chart, technology, money, business, finance, marketing
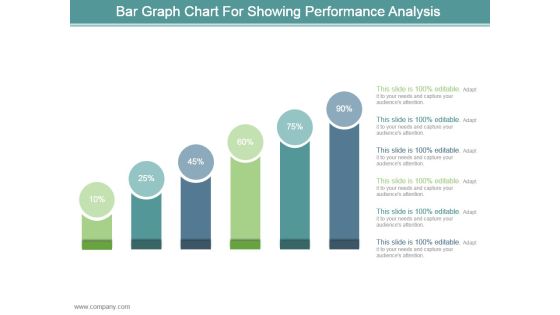
Bar Graph Chart For Showing Performance Analysis Ppt Design
This is a bar graph chart for showing performance analysis ppt design. This is a six stage process. The stages in this process are business, marketing, process, success, presentation.

Modern Marketing Concepts 3d Man Climbing Bar Graph Adaptable Business
Discover Decisive Moments With Our modern marketing concepts 3d man climbing bar graph adaptable business Powerpoint Templates. They Help Make That Crucial Difference.

Quantitative Data Analysis Bar Chart For Different Categories PowerPoint Templates
Make Some Dough With Our quantitative data analysis bar chart for different categories Powerpoint Templates . Your Assets Will Rise Significantly.
Business Strategy Plan Bar Graph Made By Grass Clipart
Brace Yourself, Arm Your Thoughts. Prepare For The Hustle With Our Business Strategy Plan Bar Graph Made By Grass Clipart Powerpoint Templates.

Stock Photo Pie Chart And Bar Graph PowerPoint Template
Put In A Dollop Of Our stock photo Pie Chart And Bar Graph powerpoint template Powerpoint Templates. Give Your Thoughts A Distinctive Flavor.

Stock Photo Piggy Banks Of Bar Graph PowerPoint Slide
This image is designed with piggy banks on bar graph. This image portrays the concepts of saving and investment. You may use this image to make outstanding presentations.
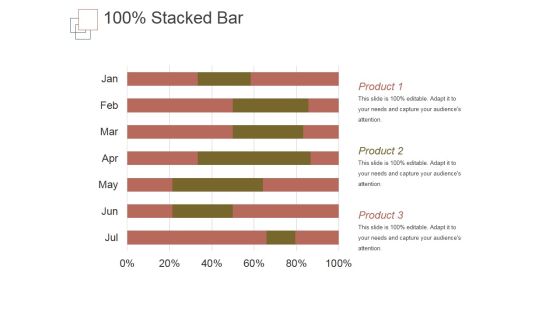
Stacked Bar Template 1 Ppt PowerPoint Presentation Themes
This is a stacked bar template 1 ppt powerpoint presentation themes. This is a six stage process. The stages in this process are product, business, marketing, success, management.

Bar Graph Ppt PowerPoint Presentation Portfolio Example Topics
This is a bar graph ppt powerpoint presentation portfolio example topics. This is a four stage process. The stages in this process are business, marketing, management, success, planning.
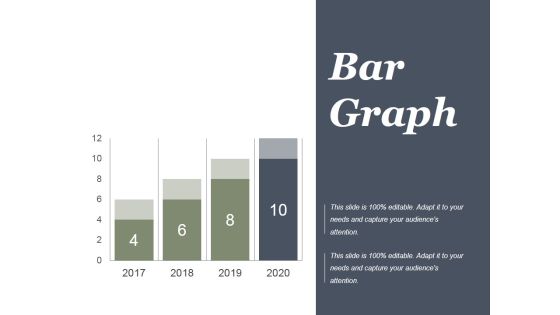
Project Performance Bar Graph Ppt PowerPoint Presentation Outline
This is a project performance bar graph ppt powerpoint presentation outline. This is a four stage process. The stages in this process are finance, year, business, marketing, future, marketing.

Bar Chart Icon Representing Trend Growth Information PDF
Presenting Bar Chart Icon Representing Trend Growth Information PDF to dispense important information. This template comprises Four stages. It also presents valuable insights into the topics including Bar Chart, Icon Representing, Trend Growth This is a completely customizable PowerPoint theme that can be put to use immediately. So, download it and address the topic impactfully.

Icon Depicting Energy Consumption Statistics Bar Graph Sample PDF
Presenting Icon Depicting Energy Consumption Statistics Bar Graph Sample PDF to dispense important information. This template comprises three stages. It also presents valuable insights into the topics including Icon Depicting, Energy Consumption Statistics, Bar Graph. This is a completely customizable PowerPoint theme that can be put to use immediately. So, download it and address the topic impactfully.

Bar Showing Growth Vector Icon Ppt PowerPoint Presentation Layouts Show
Presenting this set of slides with name bar showing growth vector icon ppt powerpoint presentation layouts show. The topics discussed in these slide is bar showing growth vector icon. This is a completely editable PowerPoint presentation and is available for immediate download. Download now and impress your audience.

Stock Photo Bar Graph With Grid PowerPoint Slide
This image slide displays bar graph with grid. This image has been designed with graphic of 3d multicolor bar graph. Use this image slide, in your presentations to express views on finance, growth and success. This image slide may also be used to exhibit any information which requires visual presentation in your presentations. This image slide will enhance the quality of your presentations.
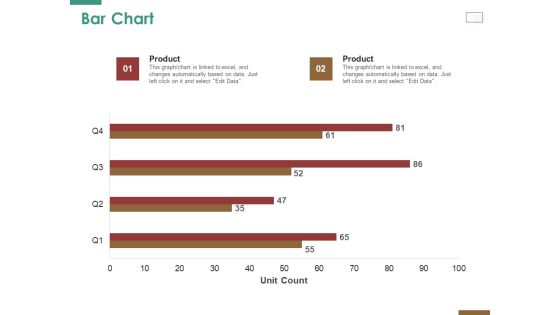
Successful Strategy Implementation Process Organization Bar Chart Clipart PDF
Presenting this set of slides with name successful strategy implementation process organization bar chart clipart pdf. The topics discussed in these slide is bar chart. This is a completely editable PowerPoint presentation and is available for immediate download. Download now and impress your audience.

Stock Photo Bar Graph With Growth Arrow PowerPoint Slide
This creative image displays design of Bar Graph with Growth Arrow. This image has been designed to depict business on an Upward Trend. Create an impact with this quality image and make professional presentations.

2 Year Digital Evolution Icon With Bar Graph Demonstration PDF
Persuade your audience using this 2 Year Digital Evolution Icon With Bar Graph Demonstration PDF. This PPT design covers Four stages, thus making it a great tool to use. It also caters to a variety of topics including 2 Year Digital, Evolution Icon, Bar Graph. Download this PPT design now to present a convincing pitch that not only emphasizes the topic but also showcases your presentation skills.
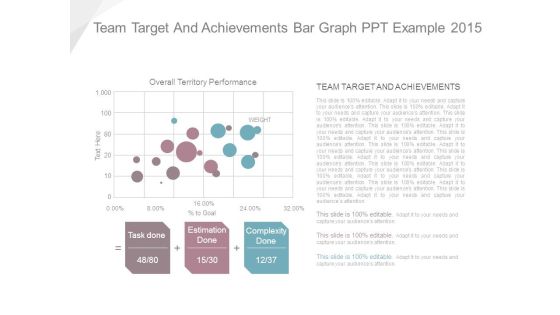
Team Target And Achievements Bar Graph Ppt Example 2015
This is a team target and achievements bar graph ppt example 2015. This is a three stage process. The stages in this process are task done, estimation done, complexity done, overall territory performance, team target and achievements.

Bar Chart Software Designing And Development Playbook Ideas PDF
Presenting this PowerPoint presentation, titled Bar Chart Software Designing And Development Playbook Ideas PDF, with topics curated by our researchers after extensive research. This editable presentation is available for immediate download and provides attractive features when used. Download now and captivate your audience. Presenting this Bar Chart Software Designing And Development Playbook Ideas PDF. Our researchers have carefully researched and created these slides with all aspects taken into consideration. This is a completely customizable Bar Chart Software Designing And Development Playbook Ideas PDF that is available for immediate downloading. Download now and make an impact on your audience. Highlight the attractive features available with our PPTs.

Bar Graph Showing Business Success Ppt PowerPoint Presentation Inspiration
This is a bar graph showing business success ppt powerpoint presentation inspiration. This is a five stage process. The stages in this process are business, success, marketing, management, strategy.
Employee Productivity Enhancement Plan Icon With Bar Graph Slides PDF
Persuade your audience using this Employee Productivity Enhancement Plan Icon With Bar Graph Slides PDF This PPT design covers three stages, thus making it a great tool to use. It also caters to a variety of topics including Employee Productivity, Enhancement Plan, Bar Graph Download this PPT design now to present a convincing pitch that not only emphasizes the topic but also showcases your presentation skills.

Bar Graph For Business Growth Steps Powerpoint Slides
This PowerPoint template contains design of bar graph with icons. You may download this slide to display strategy steps for business growth. You can easily customize this template to make it more unique as per your need.

Sales Growth Bar Graph Ppt PowerPoint Presentation Background Image
This is a sales growth bar graph ppt powerpoint presentation background image. This is a five stage process. The stages in this process are arrows, success, business, marketing, process.

Stock Photo Red Growth Arrow On Bar Graph PowerPoint Slide
Explain the concepts of business growth with this unique image. This image has been designed with red growth arrow on bar graph. Use this image in business and finance related topics

Bar Graph Ppt PowerPoint Presentation Summary Infographic Template
This is a bar graph ppt powerpoint presentation summary infographic template. This is a seven stage process. The stages in this process are business, strategy, marketing, analysis, growth strategy.

Dollar Coins Money Growth Bar Graph Powerpoint Template
Use this PowerPoint template, in your corporate presentations. It contains bar graph of dollar coins. This business slide may be used to exhibit money growth. Make wonderful presentations using this diagram.

Bar Graph To Showcase Financial Analysis Ppt PowerPoint Presentation Professional
This is a bar graph to showcase financial analysis ppt powerpoint presentation professional. This is a four stage process. The stages in this process are business, marketing, growth, success, arrows.
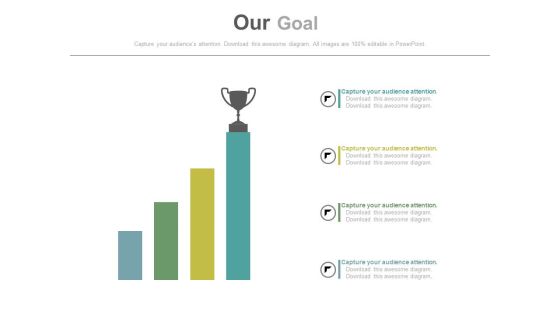
Growth Bar Graph With Trophy On Top Powerpoint Slides
This PowerPoint template has been designed with growth bar graph and trophy onto of it. Download this PPT slide to define and achieve goals with more success. This diagram may be used for goal planning related topics.
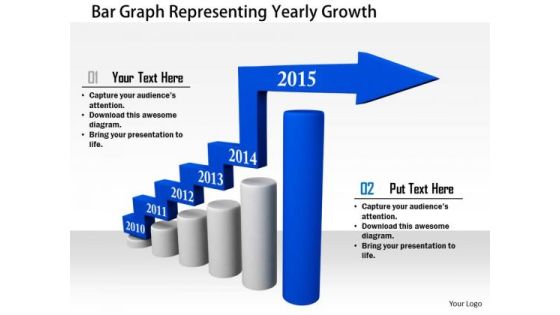
Stock Photo Bar Graph Representing Yearly Growth PowerPoint Slide
This Power Point image template slide has been crafted with graphic of bar graph and arrow. This image slide template contains the concept of yearly growth. Use this image slide and build exclusive presentation for your viewers.

3d Man Running On Blue Growth And Bar Graph
This image slide has been designed with graphic of 3d man on blue arrow moving towards bar graph. This professional slide contains the concept of growth and success. Use this editable slide to depict business growth.

Bar Chart Ppt PowerPoint Presentation Infographic Template Master Slide
This is a bar chart ppt powerpoint presentation infographic template master slide. This is a two stage process. The stages in this process are growth, finance, business, analysis, marketing.

Bar Chart Ppt PowerPoint Presentation Infographic Template Skills
This is a bar chart ppt powerpoint presentation infographic template skills. This is a nine stage process. The stages in this process are sales in percentage, finance, business, marketing, strategy, success.

Magnifier With Tools And Bar Graph Ppt PowerPoint Presentation Diagrams
This is a magnifier with tools and bar graph ppt powerpoint presentation diagrams. This is a four stage process. The stages in this process are magnifier, strategy, search, business, management.

Bar Chart Percentage Product Ppt PowerPoint Presentation Layouts Designs Download
This is a bar chart percentage product ppt powerpoint presentation layouts designs download. This is a two stage process. The stages in this process are percentage, product, business, management.

Bar Graph With Increasing Percentage Flow Powerpoint Slides
This PowerPoint slide has been designed with bar graph and increasing percentage values. This diagram slide may be used to display profit growth. Prove the viability of your ideas with this professional slide.
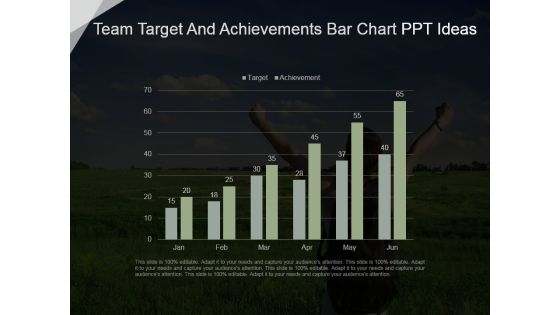
Team Target And Achievements Bar Chart Ppt Ideas
This is a team target and achievements bar chart ppt ideas. This is a six stage process. The stages in this process are business, marketing, graph chart, success, strategy.
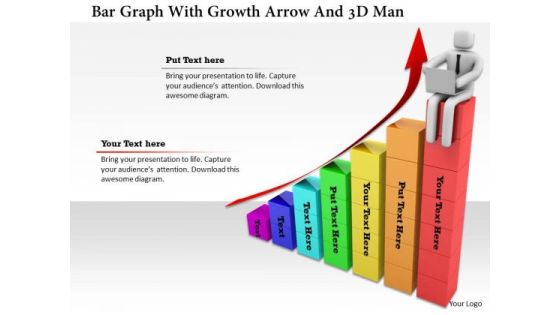
Bar Graph With Growth Arrow And 3d Man
This image slide has been crafted with graphic of bar graph and arrow. In this slide arrow is representing the concept of growth. Use this editable slide to display business growth.
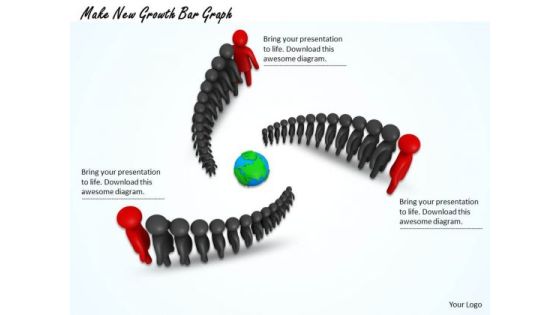
Stock Photo Make New Growth Bar Graph PowerPoint Template
Your Listeners Will Never Doodle. Our Stock Photo Make New Growth Bar Graph Powerpoint Template Powerpoint Templates Will Hold Their Concentration. Do The One Thing With Your Thoughts. Uphold Custom With Our Business Powerpoint Templates.

Bar Graph For Profit Growth Analysis Powerpoint Slides
This PowerPoint template has been designed with bar graph with percentage values. This diagram is useful to exhibit profit growth analysis. This diagram slide can be used to make impressive presentations.

Bar Graph On Blackboard For Growth Analysis Powerpoint Template
Visually support your presentation with our above template containing bar graph on blackboard. This PowerPoint template helps to display growth analysis. Etch your views in the brains of your audience with this diagram slide.
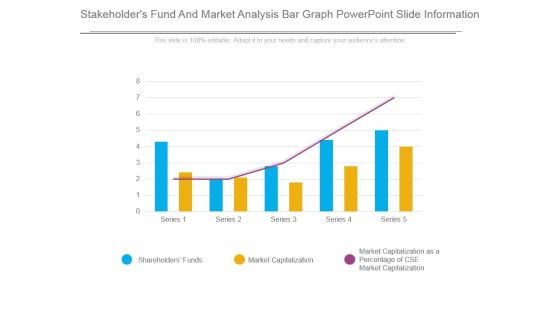
Stakeholders Fund And Market Analysis Bar Graph Powerpoint Slide Information
This is a stakeholders fund and market analysis bar graph powerpoint slide information. This is a five stage process. The stages in this process are shareholders funds, market capitalization, market capitalization as a percentage of cse market capitalization.
Revenue Projection Icon With Bar Chart Ppt Ideas Designs PDF
Persuade your audience using this revenue projection icon with bar chart ppt ideas designs pdf. This PPT design covers three stages, thus making it a great tool to use. It also caters to a variety of topics including revenue projection icon with bar chart. Download this PPT design now to present a convincing pitch that not only emphasizes the topic but also showcases your presentation skills.
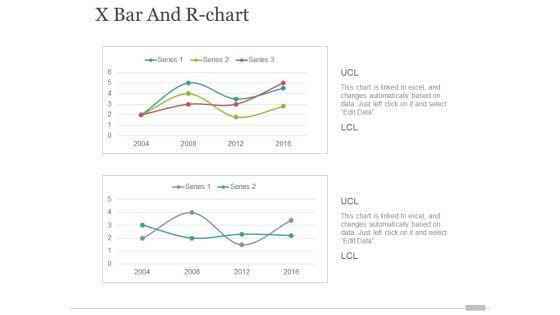
x bar and r chart ppt powerpoint presentation portfolio elements
This is a x bar and r chart ppt powerpoint presentation portfolio elements. This is a two stage process. The stages in this process are finance, business, marketing, growth.
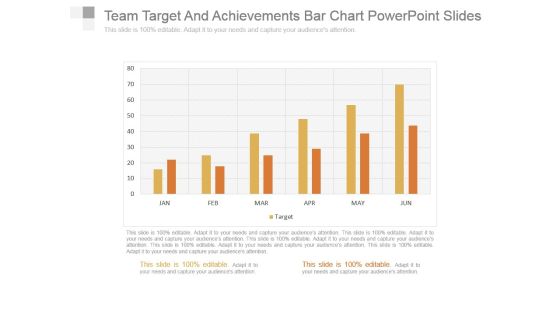
Team Target And Achievements Bar Chart Powerpoint Slides
This is a team target and achievements bar chart powerpoint slides. This is a six stage process. The stages in this process are business, success, graph chart, strategy, marketing.

Bar Graph Ppt PowerPoint Presentation Visual Aids Model
This is a bar graph ppt powerpoint presentation visual aids model. This is a three stage process. The stages in this process are business, strategy, analysis, planning, sales in percentage.
 Home
Home