Progress Bar

SPI Methodology Project Improvement Milestone Schedule Ppt PowerPoint Presentation File Infographics PDF
This slide provides the glimpse about the project improvement milestone schedule which focuses on various process areas such as project kick off, initial assessment, process areas implementation, progress assessment, formal project assessment and project closeout. Deliver and pitch your topic in the best possible manner with this spi methodology project improvement milestone schedule ppt powerpoint presentation file infographics pdf. Use them to share invaluable insights on process areas, implementation and support, project assessment, progress assessment and impress your audience. This template can be altered and modified as per your expectations. So, grab it now.

Optimizing Ecommerce Marketing Plan To Improve Sales Increase In Potential Leads Of Company Background PDF
This slide shows the bar graph that represents the potential leads of the company in six consecutive years which depicts the increase in percentage of online leads. Deliver an awe inspiring pitch with this creative Optimizing Ecommerce Marketing Plan To Improve Sales Increase In Potential Leads Of Company Background PDF bundle. Topics like E Commerce Marketing Plan, Potential Leads Of Company can be discussed with this completely editable template. It is available for immediate download depending on the needs and requirements of the user.

Company Departmental Task And Time Monitoring Report Clipart PDF
This slide shows a dashboard which includes a table with category, task description, due date, priority, status. It also includes pie charts of sales and marketing team showing task completed, in progress and overdue along with summary table and todays progress. Showcasing this set of slides titled company departmental task and time monitoring report clipart pdf. The topics addressed in these templates are system, sales, marketing. All the content presented in this PPT design is completely editable. Download it and make adjustments in color, background, font etc. as per your unique business setting.
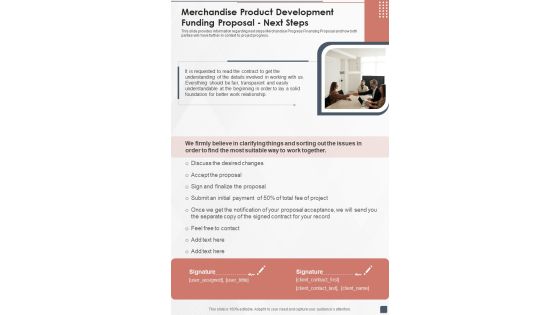
Merchandise Product Development Funding Proposal Next Steps One Pager Sample Example Document
This slide provides information regarding next steps Merchandise Progress Financing Proposal and how both parties will move further in context to project progress. Presenting you an exemplary Merchandise Product Development Funding Proposal Next Steps One Pager Sample Example Document. Our one-pager comprises all the must-have essentials of an inclusive document. You can edit it with ease, as its layout is completely editable. With such freedom, you can tweak its design and other elements to your requirements. Download this Merchandise Product Development Funding Proposal Next Steps One Pager Sample Example Document brilliant piece now.

Data Lineage Methods Overview Of Graph Data Lineage Visualization Ideas PDF
This slide gives an overview of graph data lineage visualization that enables business users to view and analyze data lineage to find solutions without technical skills. The search bar feature allows users to search for any data set or property in the database. The best PPT templates are a great way to save time, energy, and resources. Slidegeeks have 100 percent editable powerpoint slides making them incredibly versatile. With these quality presentation templates, you can create a captivating and memorable presentation by combining visually appealing slides and effectively communicating your message. Download Data Lineage Methods Overview Of Graph Data Lineage Visualization Ideas PDF from Slidegeeks and deliver a wonderful presentation.

Annual Performance Report Of Support Center Inspiration PDF
This slide signifies the annual performance comparison on bar graph between answered and unanswered calls. It represents the performance of employee and strategies they implemented on monthly basis for growth. Showcasing this set of slides titled Annual Performance Report Of Support Center Inspiration PDF. The topics addressed in these templates are Annual Performance, Report Of Support Center. All the content presented in this PPT design is completely editable. Download it and make adjustments in color, background, font etc. as per your unique business setting.
Performance Analysis Of New Product Development Total Number Of Units Sold By The Product Icons PDF
The following slide displays the total number of units sold by the organization, the provided bar graph displays the various months and total units in million sold in each. Deliver an awe inspiring pitch with this creative performance analysis of new product development total number of units sold by the product icons pdf bundle. Topics like total number of units sold by the product can be discussed with this completely editable template. It is available for immediate download depending on the needs and requirements of the user.
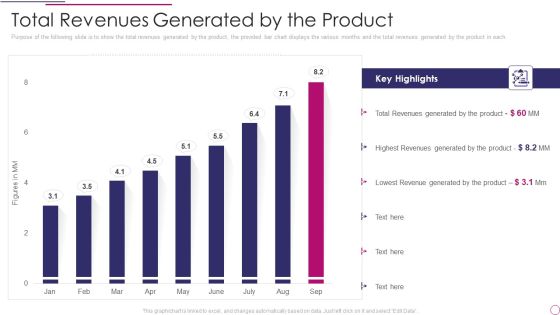
Performance Analysis Of New Product Development Total Revenues Generated By The Product Microsoft PDF
Purpose of the following slide is to show the total revenues generated by the product, the provided bar chart displays the various months and the total revenues generated by the product in each. Deliver and pitch your topic in the best possible manner with this performance analysis of new product development total revenues generated by the product microsoft pdf. Use them to share invaluable insights on total revenues generated by the product and impress your audience. This template can be altered and modified as per your expectations. So, grab it now.

Business Graph PowerPoint Templates And PowerPoint Themes 1012
Business Graph PowerPoint Templates And PowerPoint Themes 1012-The PowerPoint Template shows the Growing Bar Graph reaching its Destination that is Globe. This template portrays the concepts of winning leadership Finance Success competition sports business shapes people and abstract. You can use this template to illustrate Global Issues. An excellent graphic to attract the attention of your audience to improve earnings.-Business Graph PowerPoint Templates And PowerPoint Themes 1012-This PowerPoint template can be used for presentations relating to-Business graph with earth, marketing, finance, business, success, money
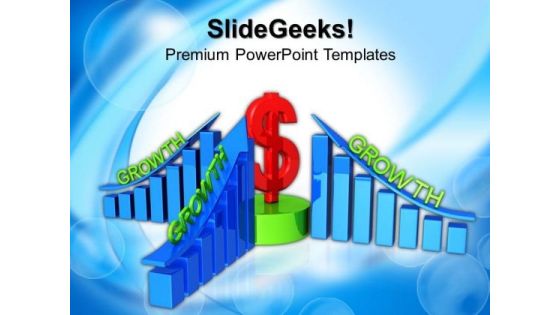
Business Profits Growth PowerPoint Templates And PowerPoint Themes 1012
Business Profits Growth PowerPoint Templates And PowerPoint Themes 1012-The above template displays a diagram of profit and growth bar graph with dollar in center. This image represents the business concept. Use this template for presentations on growth of indicators, growth of indices, rise up, business development, evaluative reports, ratings, graphs, economy, rate of exchange, market review etc. Adjust the above image in your PPT presentations to visually support your content in your Business and Marketing PPT slideshows. Deliver amazing presentations to mesmerize your audience.-Business Profits Growth PowerPoint Templates And PowerPoint Themes 1012-This PowerPoint template can be used for presentations relating to-Business profits growth, business, finance, success, money, marketing

Freight Shipping Company Profile Future Plan Information PDF
The slide highlights the future plans for logistics transport company. It illustrates full bar code traceability, lean sigma six and real time GPS tracking implementation as well as it depicts partnerships and centralized facility.This is a Freight Shipping Company Profile Future Plan Information PDF template with various stages. Focus and dispense information on six stages using this creative set, that comes with editable features. It contains large content boxes to add your information on topics like Technology Partners, Technology Onboardings, Centralized Facility. You can also showcase facts, figures, and other relevant content using this PPT layout. Grab it now.

Transportation Company Profile Future Plan Ppt PowerPoint Presentation Infographics Backgrounds PDF
The slide highlights the future plans for logistics transport company. It illustrates full bar code traceability, lean sigma six and real time GPS tracking implementation as well as it depicts partnerships and centralized facility.This is a Transportation Company Profile Future Plan Ppt PowerPoint Presentation Infographics Backgrounds PDF template with various stages. Focus and dispense information on six stages using this creative set, that comes with editable features. It contains large content boxes to add your information on topics like Code Traceability, Centralized Facility, New Partnership. You can also showcase facts, figures, and other relevant content using this PPT layout. Grab it now.

Business Dollar Growth Finance PowerPoint Templates And PowerPoint Themes 1012
Create visually stunning and define your PPT Presentations in a unique and inspiring manner using our above template which contains a graphic of bar graph and dollar symbol with an upward arrow. This image depicts the concept of growth and success. Adjust the above image in your PPT presentations to visually support your content in your Business PPT slideshows investment, finance, marketing and success PPT presentations. Our PPT images are so perfectly designed that it reveals the very basis of our PPT template to make your clients understand.
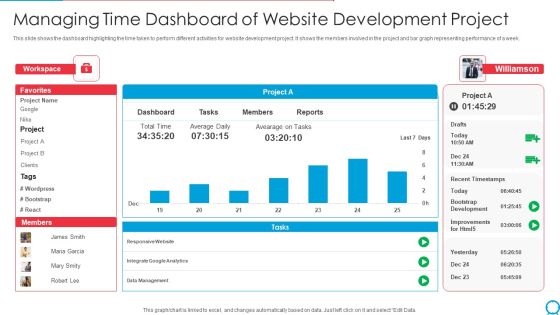
Managing Time Dashboard Of Website Development Project Ppt PowerPoint Presentation Gallery Outline PDF
This slide shows the dashboard highlighting the time taken to perform different activities for website development project. It shows the members involved in the project and bar graph representing performance of a week. Showcasing this set of slides titled managing time dashboard of website development project ppt powerpoint presentation gallery outline pdf. The topics addressed in these templates are workspace, project, data management, recent timestamps. All the content presented in this PPT design is completely editable. Download it and make adjustments in color, background, font etc. as per your unique business setting.

Research And Development Investment Global Food Products Company Profile Information PDF
This slide highlights the research and development investment of agricultural company through bar graph format which showcases last five years data. From laying roadmaps to briefing everything in detail, our templates are perfect for you. You can set the stage with your presentation slides. All you have to do is download these easy-to-edit and customizable templates. Research And Development Investment Global Food Products Company Profile Information PDF will help you deliver an outstanding performance that everyone would remember and praise you for. Do download this presentation today.
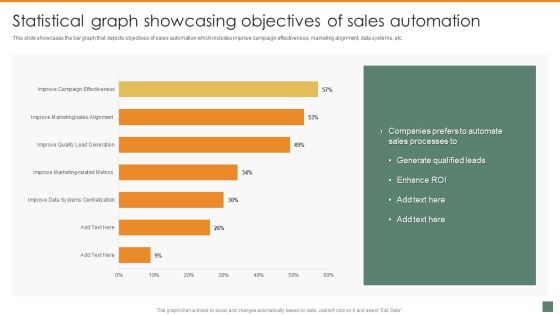
Statistical Graph Showcasing Objectives Of Sales Automation Summary And Significance Of Sales Automation Inspiration PDF
This slide showcases the bar graph that depicts objectives of sales automation which includes improve campaign effectiveness, marketing alignment, data systems, etc. The Statistical Graph Showcasing Objectives Of Sales Automation Summary And Significance Of Sales Automation Inspiration PDF is a compilation of the most recent design trends as a series of slides. It is suitable for any subject or industry presentation, containing attractive visuals and photo spots for businesses to clearly express their messages. This template contains a variety of slides for the user to input data, such as structures to contrast two elements, bullet points, and slides for written information. Slidegeeks is prepared to create an impression.
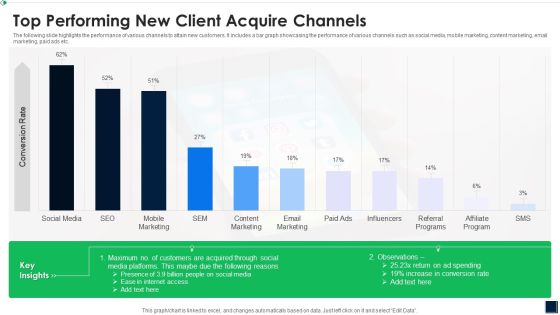
Top Performing New Client Acquire Channels Elements PDF
The following slide highlights the performance of various channels to attain new customers. It includes a bar graph showcasing the performance of various channels such as social media, mobile marketing, content marketing, email marketing, paid ads etc. Showcasing this set of slides titled Top Performing New Client Acquire Channels Elements PDF The topics addressed in these templates are Top Performing New Client Acquire Channels All the content presented in this PPT design is completely editable. Download it and make adjustments in color, background, font etc. as per your unique business setting.
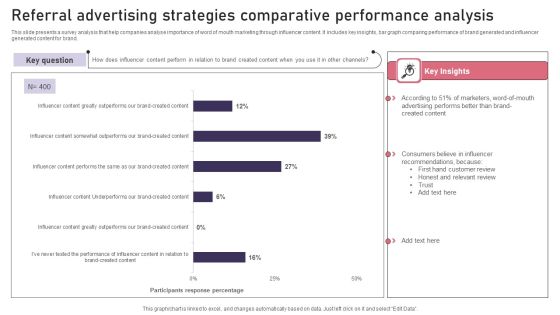
Referral Advertising Strategies Comparative Performance Analysis Diagrams PDF
This slide presents a survey analysis that help companies analyse importance of word of mouth marketing through influencer content. It includes key insights, bar graph comparing performance of brand generated and influencer generated content for brand. Showcasing this set of slides titled Referral Advertising Strategies Comparative Performance Analysis Diagrams PDF. The topics addressed in these templates are Referral Advertising, Strategies Comparative, Performance Analysis. All the content presented in this PPT design is completely editable. Download it and make adjustments in color, background, font etc. as per your unique business setting.

Increase In Profit Business PowerPoint Templates And PowerPoint Themes 1012
Increase In Profit Business PowerPoint Templates And PowerPoint Themes 1012-Use this template containing a blue bar graph with years in staircase manner showing increase in profits yearly to highlight the key issues of your presentation. The development in business is due to working in team and leadership. This image has been conceived to enable you to emphatically communicate your ideas in your Business and Teamwork PPT presentations. Create captivating presentations to deliver comparative and weighted arguments.-Increase In Profit Business PowerPoint Templates And PowerPoint Themes 1012-This PowerPoint template can be used for presentations relating to-Chart graph profit increase, finance, success, marketing, business, communication

Six Staged Business Growth Analysis PowerPoint Template
Growth analysis of business can be explained with this diagram. It contains graphics of bars with icons. You can use this design to complement your idea themed presentation.
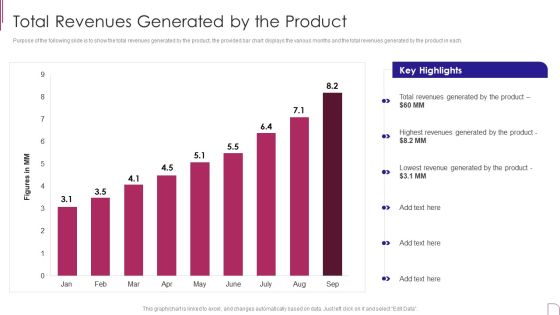
Yearly Product Performance Assessment Repor Total Revenues Generated By The Product Background PDF
Purpose of the following slide is to show the total revenues generated by the product, the provided bar chart displays the various months and the total revenues generated by the product in each. Deliver and pitch your topic in the best possible manner with this Yearly Product Performance Assessment Repor Total Revenues Generated By The Product Background PDF Use them to share invaluable insights on Key Highlights, Revenues Generated, Lowest Revenue and impress your audience. This template can be altered and modified as per your expectations. So, grab it now.

House With Finance Growth Real Estate PowerPoint Templates And PowerPoint Themes 1112
House With Finance Growth Real Estate PowerPoint Templates And PowerPoint Themes 1112-Deliver amazing Presentations with our above template showing house and dollar coins in form of bar graph. This image represents the concept of increasing prices of houses. Clarity of thought has been the key to your growth. Use our templates to illustrate your ability. It is a useful captivating tool conceived to enable you to define your message in your Business PPT presentations on architecture, family, success and wealth.-House With Finance Growth Real Estate PowerPoint Templates And PowerPoint Themes 1112-This PowerPoint template can be used for presentations relating to-Housing prices goes down, Money, Finance, Symbol, Marketing, Real estate

Cyber Risk Security Market Growth With Current Trends Summary PDF
The following slide highlights the bar graph of cyber security market growth from 2017 to 2028 and pie chart of cyber security market share. Showcasing this set of slides titled cyber risk security market growth with current trends summary pdf. The topics addressed in these templates are cyber security market share, cyber security expected market growth, banking and finance. All the content presented in this PPT design is completely editable. Download it and make adjustments in color, background, font etc. as per your unique business setting.

Piggy With Coins Growth Arrows PowerPoint Templates And PowerPoint Themes 1112
Piggy With Coins Growth Arrows PowerPoint Templates And PowerPoint Themes 1112-This PowerPoint template features an image of piggy with dollar coins and growing business bar graph. Use our Business PowerPoint Templates because, Show them how to persistently hit bulls eye. Use our Money PowerPoint Templates because, Business ethics is an essential element in your growth. Use our Success PowerPoint Templates because, Highlight your ideas broad- based on strong fundamentals and illustrate how they step by step achieve the set growth factor.-Piggy With Coins Growth Arrows PowerPoint Templates And PowerPoint Themes 1112-This PowerPoint template can be used for presentations relating to-Piggy with golden coins graph, Money, Finance, Arrows, Marketing, Future

Success Graph Finance PowerPoint Templates And PowerPoint Themes 1012
Success Graph Finance PowerPoint Templates And PowerPoint Themes 1012-The Above PowerPoint Template shows the Bar graph of Several Components showing the Percentage of each component. It signifies the Concept of Growth, Finance, Investment etc. Prove how they mesh to motivate the company team and provide the steam to activate the composite machine. You have noted down some very fruitful ideas that have occurred to you at random moments. Organize them all and prioritize them effectively.-Success Graph Finance PowerPoint Templates And PowerPoint Themes 1012-This PowerPoint template can be used for presentations relating to-Business growth, Business, Finance, Marketing, Success, Symbol

Dollar Symbol Business PowerPoint Templates And PowerPoint Themes 1012
Dollar Symbol Business PowerPoint Templates And PowerPoint Themes 1012-Develop competitive advantage with our above template which contains a diagram showing 3d green dollars which signifies business growth which is being illustrated by the bar graph. It portrays the concept of finance, profit, loss, finance, investment etc. This image has been conceived to enable you to emphatically communicate your ideas in your Business and Marketing PPT presentations. The structure of our templates allows you to effectively highlight the key issues concerning the growth of your business.-Dollar Symbol Business PowerPoint Templates And PowerPoint Themes 1012-This PowerPoint template can be used for presentations relating to-Dollor, Symbol, Signs, Finance, Shapes, Metaphor
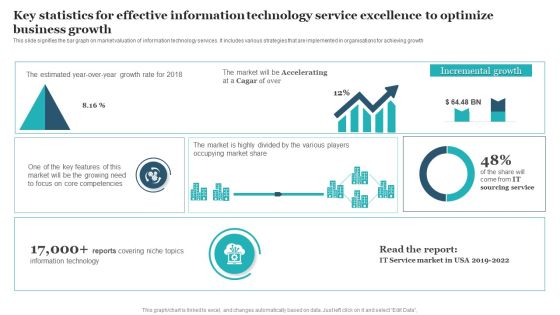
Key Statistics For Effective Information Technology Service Excellence To Optimize Business Growth Guidelines PDF
This slide signifies the bar graph on market valuation of information technology services. It includes various strategies that are implemented in organisations for achieving growth. Showcasing this set of slides titled Key Statistics For Effective Information Technology Service Excellence To Optimize Business Growth Guidelines PDF. The topics addressed in these templates are Key Statistics Effective, Information Technology Service, Excellence Optimize Business Growth. All the content presented in this PPT design is completely editable. Download it and make adjustments in color, background, font etc. as per your unique business setting.

Formulating Product Development Action Plan To Enhance Client Experience Costs Associated With Product Diagrams PDF
This slide represents the bar graph that shows costs associated with stages of product development such as idea generation and validation, concept development, prototype testing, commercialization, etc. Deliver and pitch your topic in the best possible manner with this formulating product development action plan to enhance client experience costs associated with product diagrams pdf. Use them to share invaluable insights on development, costs, organizing, marketing, campaigns and impress your audience. This template can be altered and modified as per your expectations. So, grab it now.
Group Of Pencils Forming Graph PowerPoint Templates And PowerPoint Themes 1012
Group Of Pencils Forming Graph PowerPoint Templates And PowerPoint Themes 1012-Use this PowerPoint Template to illustrate the business concept. This Template shows group of pencils forming bar graph symbolizing growth and success. The ideas and plans are on your fingertips. Now imprint them on the minds of your audience via our slides. This image has been conceived to enable you to emphatically communicate your ideas in your Marketing and Business PPT presentations.-Group Of Pencils Forming Graph PowerPoint Templates And PowerPoint Themes 1012-This PowerPoint template can be used for presentations relating to-Pencils forming a graph, business, education, children, shapes, success

Data Lineage Implementation Overview Of Graph Data Lineage Visualization Demonstration PDF
This slide gives an overview of graph data lineage visualization that enables business users to view and analyze data lineage to find solutions without technical skills. The search bar feature allows users to search for any data set or property in the database. There are so many reasons you need a Data Lineage Implementation Overview Of Graph Data Lineage Visualization Demonstration PDF. The first reason is you cannot spend time making everything from scratch, Thus, Slidegeeks has made presentation templates for you too. You can easily download these templates from our website easily.
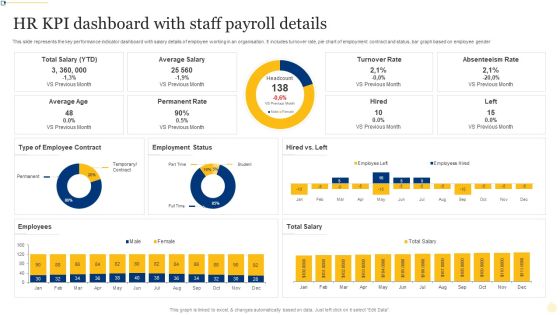
HR KPI Dashboard With Staff Payroll Details Ppt PowerPoint Presentation File Layout Ideas PDF
This slide represents the key performance indicator dashboard with salary details of employee working in an organisation. It includes turnover rate, pie chart of employment contract and status, bar graph based on employee gender. Showcasing this set of slides titled HR KPI Dashboard With Staff Payroll Details Ppt PowerPoint Presentation File Layout Ideas PDF. The topics addressed in these templates are Turnover Rate, Absenteeism Rate, Permanent Rate. All the content presented in this PPT design is completely editable. Download it and make adjustments in color, background, font etc. as per your unique business setting.

3d Man Global Business PowerPoint Templates And PowerPoint Themes 1012
3d Man Global Business PowerPoint Templates And PowerPoint Themes 1012-This template with an image of 3d man drawing a down bar graph helps you chart the course of your presentation. This image represents the downfall of the business or financial crisis. Our stunning and unique image makes your presentations simpler and professional showing that you care about even the smallest details. This template signifies global business, finance, marketing, statistics, strategy and success.-3d Man Global Business PowerPoint Templates And PowerPoint Themes 1012-This PowerPoint template can be used for presentations relating to-Global business man, earth, business, glabe, technology, success
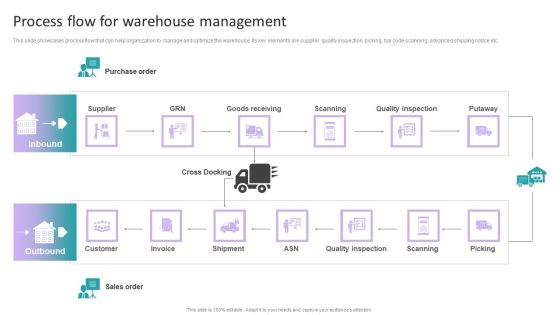
Stock Inventory Acquisition Process Flow For Warehouse Management Introduction PDF
This slide showcases process flow that can help organization to manage and optimize the warehouse. Its key elements are supplier, quality inspection, picking, bar code scanning, advanced shipping notice etc. Boost your pitch with our creative Stock Inventory Acquisition Process Flow For Warehouse Management Introduction PDF. Deliver an awe-inspiring pitch that will mesmerize everyone. Using these presentation templates you will surely catch everyones attention. You can browse the ppts collection on our website. We have researchers who are experts at creating the right content for the templates. So you dont have to invest time in any additional work. Just grab the template now and use them.

Strategies To Order And Manage Ideal Inventory Levels Process Flow For Warehouse Slides PDF
This slide showcases process flow that can help organization to manage and optimize the warehouse. Its key elements are supplier, quality inspection, picking, bar code scanning, advanced shipping notice etc. The best PPT templates are a great way to save time, energy, and resources. Slidegeeks have 100 percent editable powerpoint slides making them incredibly versatile. With these quality presentation templates, you can create a captivating and memorable presentation by combining visually appealing slides and effectively communicating your message. Download Strategies To Order And Manage Ideal Inventory Levels Process Flow For Warehouse Slides PDF from Slidegeeks and deliver a wonderful presentation.

Green Ball On Top Success PowerPoint Templates And PowerPoint Themes 1012
Green Ball On Top Success PowerPoint Templates And PowerPoint Themes 1012-This PowerPoint template consists an image of bar graph with green sphere depicting the concept of leadership. It signifies communication, corporation, creativity, individual, leader, metaphor, opportunity, strategy, success, teamwork, winner. It is a useful captivating tool conceived to enable you to define your message in your Business and Competition PPT presentations. Use this template for presentations on teamwork, group thinking, brainstorming, leadership etc. Deliver amazing presentations to mesmerize your audience.-Green Ball On Top Success PowerPoint Templates And PowerPoint Themes 1012-This PowerPoint template can be used for presentations relating to-Green ball jumping on the top level, Earth, Globe, Business, Marketing, Abstract
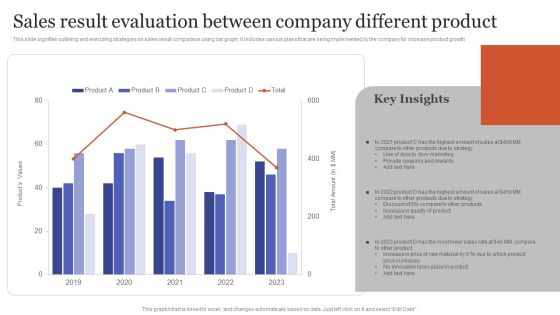
Sales Result Evaluation Between Company Different Product Microsoft PDF
This slide signifies outlining and executing strategies on sales result comparison using bar graph. It includes various plans that are being implemented by the company for increase product growth. Showcasing this set of slides titled Sales Result Evaluation Between Company Different Product Microsoft PDF. The topics addressed in these templates are Door Marketing, Provide Coupons Rewards, Increase Quality Product. All the content presented in this PPT design is completely editable. Download it and make adjustments in color, background, font etc. as per your unique business setting.
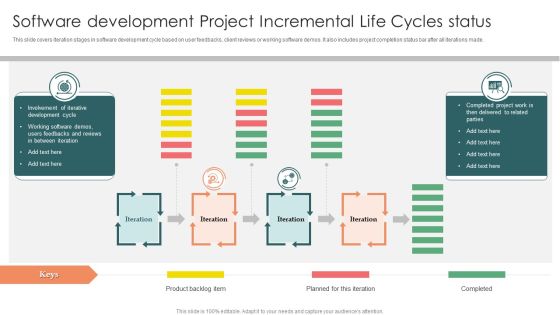
Software Development Project Incremental Life Cycles Status Rules PDF
This slide covers iteration stages in software development cycle based on user feedbacks, client reviews or working software demos. It also includes project completion status bar after all iterations made. Showcasing this set of slides titled Software Development Project Incremental Life Cycles Status Rules PDF. The topics addressed in these templates are Software development, Project Incremental, Life Cycles status. All the content presented in this PPT design is completely editable. Download it and make adjustments in color, background, font etc. as per your unique business setting.

Employee Skill Assessment After Leadership And Development Program Themes PDF
The slide shows a bar graph showing skill assessment pre and post attending leadership and management training workshop. It includes assessment of skills like program management, team building, employee management, communication skills and problem solving ability. Showcasing this set of slides titled Employee Skill Assessment After Leadership And Development Program Themes PDF. The topics addressed in these templates are Team, Employee Management. All the content presented in this PPT design is completely editable. Download it and make adjustments in color, background, font etc. as per your unique business setting.

Digital Marketing Agency Business Profile Revenue And Net Profit Diagrams PDF
This slide highlights the revenue and net profit of digital marketing agency through bar graph and tabular format. It covers three years data of revenue, gross margin and net profit. Deliver and pitch your topic in the best possible manner with this Digital Marketing Agency Business Profile Revenue And Net Profit Diagrams PDF. Use them to share invaluable insights on Increase In Revenue, Growth Rate, Net Profit and impress your audience. This template can be altered and modified as per your expectations. So, grab it now.

Expense Incurred On Digital And Offline Marketing Promotion Ppt Slides Infographics PDF
This slide showcases analysis of amount spent on online and offline marketing over the years. The following bar graph shows expense spent on advertising through online channels increased as it has proved more to be more effective. Showcasing this set of slides titled Expense Incurred On Digital And Offline Marketing Promotion Ppt Slides Infographics PDF. The topics addressed in these templates are Growth, Online Product Promotion, 2018 To 2023. All the content presented in this PPT design is completely editable. Download it and make adjustments in color, background, font etc. as per your unique business setting.
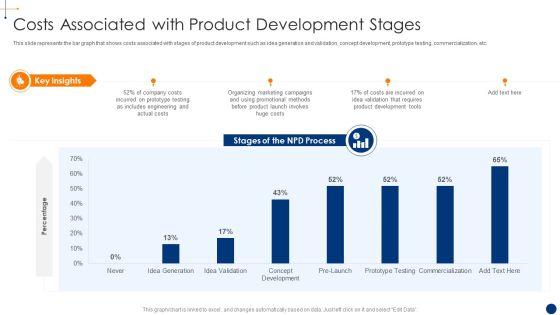
New Product Development Process Optimization Costs Associated With Product Pictures PDF
This slide represents the bar graph that shows costs associated with stages of product development such as idea generation and validation, concept development, prototype testing, commercialization, etc. Deliver and pitch your topic in the best possible manner with this new product development process optimization automating sales related activities diagrams pdf . Use them to share invaluable insights on automating sales related activities to accelerate product delivery and impress your audience. This template can be altered and modified as per your expectations. So, grab it now.

Rescue Statistics Business PowerPoint Templates And PowerPoint Themes 1112
Rescue Statistics Business PowerPoint Templates And PowerPoint Themes 1112-This PowerPoint Template contains an image of lifesaver and multicolored bar graphs which depict the concept of rescue statistics. Use our Success PowerPoint Templates because; amplify your thoughts via our appropriate templates. Use our Business PowerPoint Templates because, Business Template: - There is a vision, a need you can meet. Present your views using our innovative slides and be assured of leaving a lasting impression.-Rescue Statistics Business PowerPoint Templates And PowerPoint Themes 1112-This PowerPoint template can be used for presentations relating to-Rescue Statistics, Business, Security, Marketing, Finance, Abstract

E Business Finance Computer Profit PowerPoint Templates And PowerPoint Themes 1012
E Business Finance Computer Profit PowerPoint Templates And PowerPoint Themes 1012-Create visually stunning and define your PPT Presentations in a unique and inspiring manner using our above template which contains a graphic of pc with business or profits growth bar graph. This image has been professionally designed to emphasize the business concept. Present your views using our innovative slides and be assured of leaving a lasting impression. This image has been conceived to enable you to emphatically communicate your ideas in your Global Business PPT presentations.-E Business Finance Computer Profit PowerPoint Templates And PowerPoint Themes 1012-This PowerPoint template can be used for presentations relating to-Business graph with arrow, technology, computer, business, finance, arrows

Dollar Sign Money PowerPoint Templates And PowerPoint Themes 1012
Dollar Sign Money PowerPoint Templates And PowerPoint Themes 1012-This PowerPoint Template Shows Dollars placed in 3D manner. It also signifies the Business Growth which is being illustrated by the Bar Graph. It portrays the concept of Finance, Profit Loss etc. Adjust the above image in your PPT presentations to visually support your content in your Financial and Business PPT slideshows.-Dollar Sign Money PowerPoint Templates And PowerPoint Themes 1012-This PowerPoint template can be used for presentations relating to-Dollar sign money, symbol, finance, business, metaphor, money

Market Share Statistics Of Different IT Cloud Services Providers Topics PDF
This slide represents the market comparison bar graph on market share of different cloud computing service providers. It includes competitive analysis between various companies and there implemented strategies for growth. Showcasing this set of slides titled market share statistics of different it cloud services providers topics pdf. The topics addressed in these templates are largest market share, cloud computing services. All the content presented in this PPT design is completely editable. Download it and make adjustments in color, background, font etc. as per your unique business setting.

Comparative Risk Assessment On Effective IT Service Excellence Designs PDF
This slide signifies the bar graph comparison on growth and benefits provided by IT services. It includes various assistance like cost control, cyber security risk, data analytics and anti virus protection. Showcasing this set of slides titled Comparative Risk Assessment On Effective IT Service Excellence Designs PDF. The topics addressed in these templates are Software Management, Incident Management, Release Management. All the content presented in this PPT design is completely editable. Download it and make adjustments in color, background, font etc. as per your unique business setting.

Business Financial Highlights For Planning And Forecasting Background PDF
The slide shows bar graph showing actual and forecasted revenue, expenses and net profit of a company for various financial years. It is done to effectively conduct financial and investment planning for business growth and sustainability. Pitch your topic with ease and precision using this Business Financial Highlights For Planning And Forecasting Background PDF. This layout presents information on Revenue, Expenses And Costs, Net Profit. It is also available for immediate download and adjustment. So, changes can be made in the color, design, graphics or any other component to create a unique layout.

Security And Surveillance Company Profile Revenue And Profit Of Security Company Microsoft PDF
This slide highlights the revenue and profit of security company in bar graph format which includes data from last 5 years from financial year 2018 to 2022.Deliver and pitch your topic in the best possible manner with this Security And Surveillance Company Profile Revenue And Profit Of Security Company Microsoft PDF. Use them to share invaluable insights on Revenue Increased, Increased In Last, Key Highlights and impress your audience. This template can be altered and modified as per your expectations. So, grab it now.

Knowledge Process Outsourcing Company Profile Revenue And Profit Of Call Centers Diagrams PDF
This slide highlights the revenue and profit of call center company through bar graph format which includes data from last 5 years from financial year 2018 to 2022.Deliver and pitch your topic in the best possible manner with this Knowledge Process Outsourcing Company Profile Revenue And Profit Of Call Centers Diagrams PDF. Use them to share invaluable insights on Revenue Increased, Profit Increased, Key Takeaways and impress your audience. This template can be altered and modified as per your expectations. So, grab it now.

Portable Home Safety Systems Company Profile Revenue And Profit Of Security Company Ideas PDF
This slide highlights the revenue and profit of security company in bar graph format which includes data from last 5 years from financial year 2018 to 2022. Deliver and pitch your topic in the best possible manner with this Portable Home Safety Systems Company Profile Revenue And Profit Of Security Company Ideas PDF. Use them to share invaluable insights on Revenue Increased, 2018 To 2022, Profit Increased and impress your audience. This template can be altered and modified as per your expectations. So, grab it now.

BPO Call Center Company Profile Revenue And Profit Of Call Centers Template PDF
This slide highlights the revenue and profit of call center company through bar graph format which includes data from last 5 years from financial year 2018 to 2022.Deliver and pitch your topic in the best possible manner with this BPO Call Center Company Profile Revenue And Profit Of Call Centers Template PDF. Use them to share invaluable insights on Revenue Increased, Profit Increased, Profit Million and impress your audience. This template can be altered and modified as per your expectations. So, grab it now.

Commercial And Urban Architect Business Profile Company Revenue And Profit For 2017 And 2022 Introduction PDF
This slide highlights the company revenue and profit increases with supply chain planning and automation which includes data of 2018 and 2022 through bar graph. Deliver and pitch your topic in the best possible manner with this Commercial And Urban Architect Business Profile Company Revenue And Profit For 2017 And 2022 Introduction PDF. Use them to share invaluable insights on Additional Costs, Revenue Increased, Profits and impress your audience. This template can be altered and modified as per your expectations. So, grab it now.

Achieved And Pending Workplace Diversity Objectives Chart Guidelines PDF
This slide displays the bar chart representing the percentage of diversity goals achieved. It also includes some key insights such as an increase in the women workforce in tech roles, increase in director level black representation, etc. Showcasing this set of slides titled Achieved And Pending Workplace Diversity Objectives Chart Guidelines PDF. The topics addressed in these templates are Achieved And Pending Workplace, Diversity Objectives Chart. All the content presented in this PPT design is completely editable. Download it and make adjustments in color, background, font etc. as per your unique business setting.

Global Medical Tourism Advertising Analysis Pictures PDF
The slide showcases global market trends that it has faced due to medical tourism, i.e., customers visiting foreign counties to get medical treatments done. The slides assist in getting aware of the increasing scale of medical treatments opted for by customers all over the world. The bar graphs depicting an increase in tourism with key insights are the most noticeable. Showcasing this set of slides titled Global Medical Tourism Advertising Analysis Pictures PDF. The topics addressed in these templates are Key Insights, Reassignment Surgeries, Reconstruction. All the content presented in this PPT design is completely editable. Download it and make adjustments in color, background, font etc. as per your unique business setting.

Measuring Influencer Marketing ROI Annual Budget For Influencer Marketing Clipart PDF
Based on the total marketing budget allocated to the team, the marketing manager in consultation with stakeholders decides the budget for influencer marketing. You can use a bar chart to show the budget allocated over the years and convince the stakeholders to increase this years budget allocation. Deliver an awe-inspiring pitch with this creative measuring influencer marketing roi annual budget for influencer marketing clipart pdf bundle. Topics like annual budget for influencer marketing can be discussed with this completely editable template. It is available for immediate download depending on the needs and requirements of the user.

Monthly Cost Comparative Analysis Of Advertising Expenditure Introduction PDF
This slide represents the bar graph on marketing monthly cost comparative analysis for increasing organisation revenue. It includes methods like online, catalogues, conventions, trade shows, print, radio and magazines Pitch your topic with ease and precision using this Monthly Cost Comparative Analysis Of Advertising Expenditure Introduction PDF This layout presents information on Monthly Cost Comparative Analysis Of Advertising Expenditure It is also available for immediate download and adjustment. So, changes can be made in the color, design, graphics or any other component to create a unique layout.
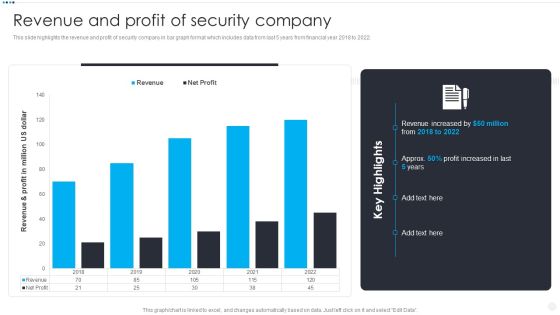
Smart Home Security Solutions Company Profile Revenue And Profit Of Security Company Elements PDF
This slide highlights the revenue and profit of security company in bar graph format which includes data from last 5 years from financial year 2018 to 2022. Deliver and pitch your topic in the best possible manner with this Smart Home Security Solutions Company Profile Revenue And Profit Of Security Company Elements PDF. Use them to share invaluable insights on Revenue And Profit, Million US Dollar, Revenue Increased Profit and impress your audience. This template can be altered and modified as per your expectations. So, grab it now.
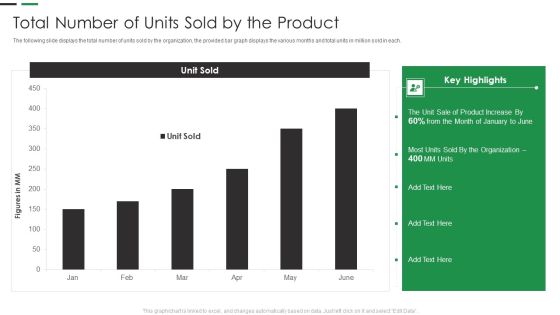
Evaluating New Commodity Impact On Market Total Number Of Units Sold By The Product Clipart PDF
The following slide displays the total number of units sold by the organization, the provided bar graph displays the various months and total units in million sold in each.Deliver and pitch your topic in the best possible manner with this Evaluating New Commodity Impact On Market Total Number Of Units Sold By The Product Clipart PDF Use them to share invaluable insights on Product Increase, Total Units, Sold Product and impress your audience. This template can be altered and modified as per your expectations. So, grab it now.

Security Officer Service Company Profile Revenue And Net Profit Ppt PowerPoint Presentation Gallery Graphic Images PDF
This slide highlights the revenue and net profit of security guard company through bar graph and tabular format. It covers three years data of revenue, and net profit. Deliver an awe inspiring pitch with this creative Security Officer Service Company Profile Revenue And Net Profit Ppt PowerPoint Presentation Gallery Graphic Images PDF bundle. Topics like Net Profit, Increase Revenue, 2018 To 2022 can be discussed with this completely editable template. It is available for immediate download depending on the needs and requirements of the user.

Company Revenue And Profit For 2017 And 2022 Structure PDF
This slide highlights the company revenue and profit increases with supply chain planning and automation which includes data of 2018 and 2022 through bar graph. Boost your pitch with our creative Company Revenue And Profit For 2017 And 2022 Structure PDF. Deliver an awe-inspiring pitch that will mesmerize everyone. Using these presentation templates you will surely catch everyones attention. You can browse the ppts collection on our website. We have researchers who are experts at creating the right content for the templates. So you do not have to invest time in any additional work. Just grab the template now and use them.

 Home
Home