Progress Bar

Stacked Area Clustered Column Ppt PowerPoint Presentation Ideas Themes
This is a stacked area clustered column ppt powerpoint presentation ideas themes. This is a three stage process. The stages in this process are product, in percentage, bar graph, area chart, growth.
Column Chart Ppt PowerPoint Presentation Icon Show
This is a column chart ppt powerpoint presentation icon show. This is a two stage process. The stages in this process are column chart, product, years, bar graph, growth.
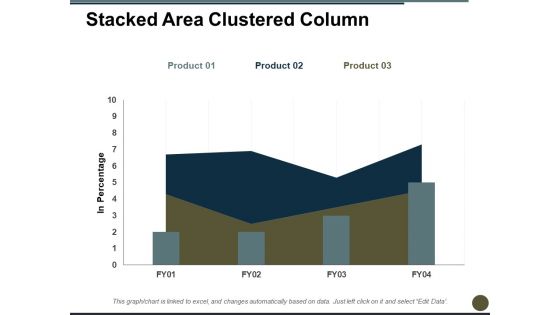
Stacked Area Clustered Column Ppt PowerPoint Presentation Professional Graphics
This is a stacked area clustered column ppt powerpoint presentation professional graphics. This is a three stage process. The stages in this process are in percentage, bar chart, product, growth, year.
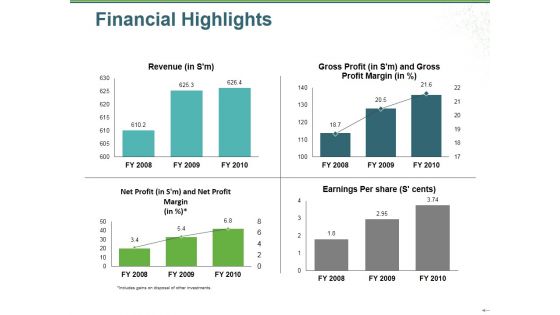
Financial Highlights Ppt PowerPoint Presentation Gallery Graphics Example
This is a financial highlights ppt powerpoint presentation gallery graphics example. This is a four stage process. The stages in this process are revenue, gross profit, net profit, earnings per share, bar graph.
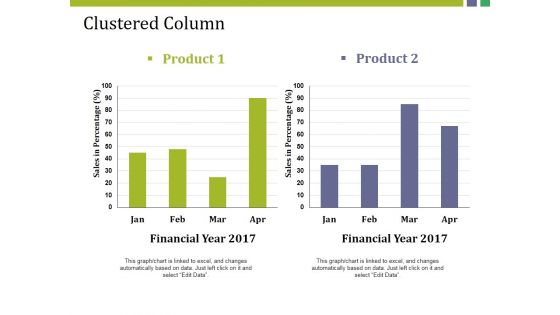
Clustered Column Ppt PowerPoint Presentation Gallery Structure
This is a clustered column ppt powerpoint presentation gallery structure. This is a two stage process. The stages in this process are product, sales in percentage, financial year, bar graph, finance.

Clustered Column Line Ppt PowerPoint Presentation Professional
This is a clustered column line ppt powerpoint presentation professional. This is a three stage process. The stages in this process are clustered column line, product, bar graph, marketing, finance.
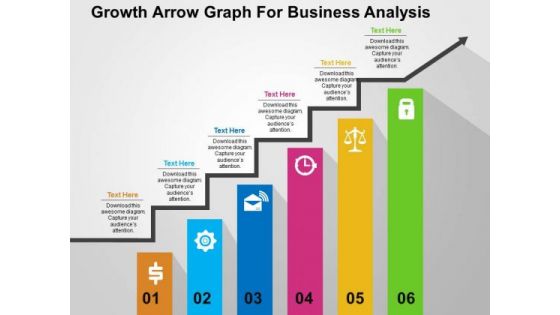
Growth Arrow Graph For Business Analysis PowerPoint Templates
Use this PowerPoint template containing growth arrow graph for business analysis. This PPT slide contains bar graph with icons. This slide is designed to attract the attention of your audience towards business plan evaluation.

Midstream Organic Growth Ppt PowerPoint Presentation Ideas Graphics Tutorials
This is a midstream organic growth ppt powerpoint presentation ideas graphics tutorials. This is a three stage process. The stages in this process are business, marketing, bar graph, management, financials.

Development And Testing Ppt PowerPoint Presentation Background Designs
This is a development and testing ppt powerpoint presentation background designs. This is a five stage process. The stages in this process are step, business, growth, success, bar graph.

Pitch Deck For Entrepreneurs Raising Money For A New Business Ppt PowerPoint Presentation Complete Deck With Slides
This is a pitch deck for entrepreneurs raising money for a new business ppt powerpoint presentation complete deck with slides. This is a one stage process. The stages in this process are business, growth strategy, marketing, management, bar graph.

Support Center Agent Activity Report Guidelines PDF
This slide signifies the KPI dashboard on performance evaluation of each agent working in a call center. It includes active agents, total and average talk time, answer ratio with bar graph on answerer calls.

Quarter Track Record Ppt PowerPoint Presentation File Clipart Images
This is a quarter track record ppt powerpoint presentation file clipart images. This is a two stage process. The stages in this process are bar graph, growth, success, business, marketing.
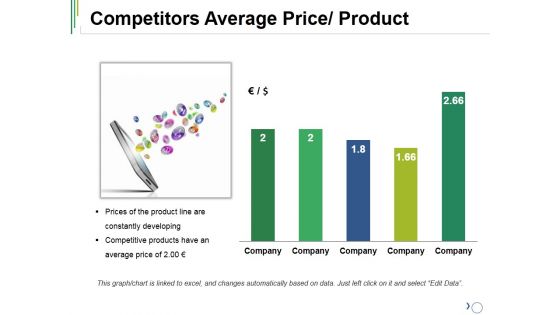
Competitors Average Price Product Ppt PowerPoint Presentation Layouts Infographic Template
This is a competitors average price product ppt powerpoint presentation layouts infographic template. This is a five stage process. The stages in this process are company, bar graph, success, growth, business.

Clustered Column Ppt PowerPoint Presentation Pictures Graphics Template
This is a clustered column ppt powerpoint presentation pictures graphics template. This is a two stage process. The stages in this process are product, growth, success, business, bar graph.
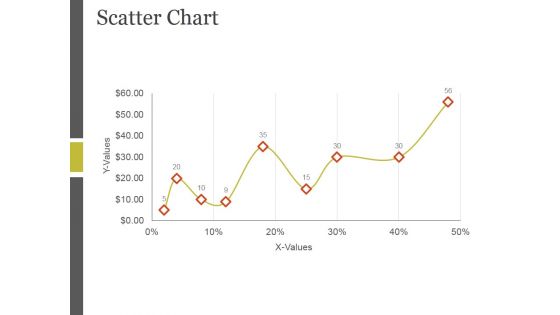
Scatter Chart Ppt PowerPoint Presentation Microsoft
This is a scatter chart ppt powerpoint presentation microsoft. This is a one stage process. The stages in this process are x values, scatter chart, bar graph, growth, business.
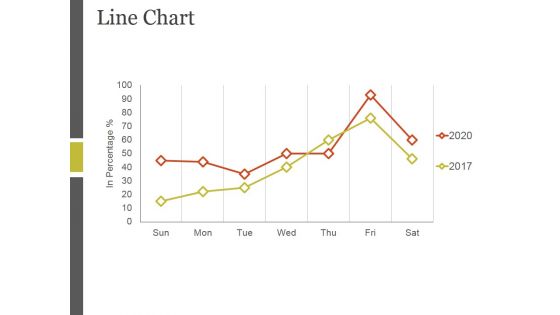
Line Chart Ppt PowerPoint Presentation Ideas Example
This is a line chart ppt powerpoint presentation ideas example. This is a two stage process. The stages in this process are sales in percentage, bar graph, business, marketing, growth.

Area Chart Ppt PowerPoint Presentation Summary Templates
This is a area chart ppt powerpoint presentation summary templates. This is a two stage process. The stages in this process are product, in percentage, bar graph, growth, business.
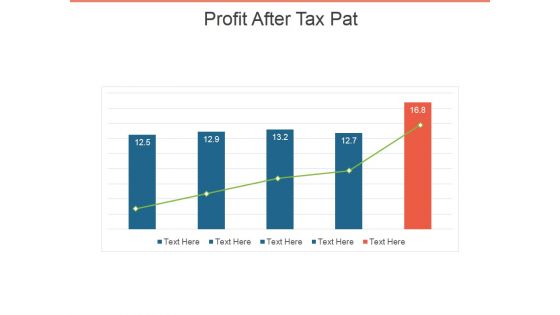
Profit After Tax Pat Ppt PowerPoint Presentation Inspiration Slide
This is a profit after tax pat ppt powerpoint presentation inspiration slide. This is a five stage process. The stages in this process are bar graph, business, marketing, growth, management.

Process Capability Measurement Ppt PowerPoint Presentation Rules
This is a process capability measurement ppt powerpoint presentation rules. This is a nine stage process. The stages in this process are business, strategy, marketing, success, bar graph, growth strategy.
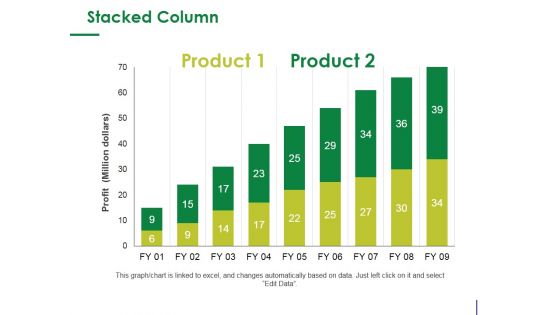
Stacked Column Ppt PowerPoint Presentation Infographic Template Design Ideas
This is a stacked column ppt powerpoint presentation infographic template design ideas. This is a two stage process. The stages in this process are product, profit, bar graph, growth, success.

Column Chart Ppt PowerPoint Presentation Slides Visual Aids
This is a column chart ppt powerpoint presentation slides visual aids. This is a six stage process. The stages in this process are bar graph, growth, success, sales in percentage, financial year.

Stacked Column Ppt PowerPoint Presentation Layouts Example
This is a stacked column ppt powerpoint presentation layouts example. This is a two stage process. The stages in this process are product, stacked column, bar graph, growth, success.

Clustered Column Line Ppt PowerPoint Presentation Infographic Template Pictures
This is a clustered column line ppt powerpoint presentation infographic template pictures. This is a three stage process. The stages in this process are product, in percentage, bar graph, growth, success.
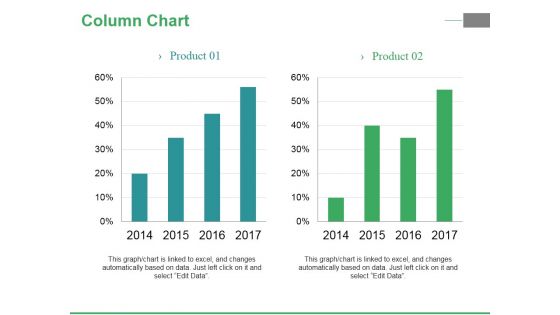
Column Chart Ppt PowerPoint Presentation Pictures Graphic Images
This is a column chart ppt powerpoint presentation pictures graphic images. This is a two stage process. The stages in this process are product, years, growth, success, bar graph.

Combo Chart Ppt PowerPoint Presentation Pictures Summary
This is a combo chart ppt powerpoint presentation pictures summary. This is a three stage process. The stages in this process are product, market size, growth rate, bar graph, success.

0814 Bargraph Of Dollars Bundles With Arrow Graphic Image Graphics For PowerPoint
This unique image has backdrop of bar graph of dollars bundles with growth arrow. This image displays the concept of financial growth. Define the business growth with this suitable image. Use this image to make outstanding presentations

Combo Chart Ppt PowerPoint Presentation Shapes
This is a combo chart ppt powerpoint presentation shapes. This is a eight stage process. The stages in this process are combo chart, business, marketing, sales in percentage, bar graph.
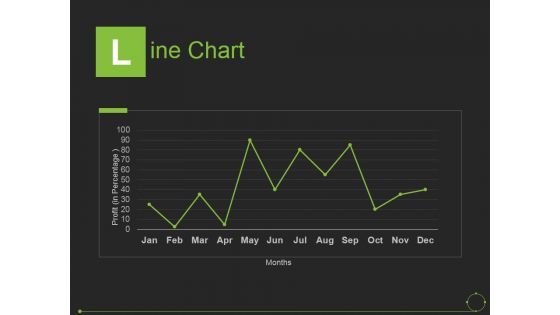
Line Chart Ppt PowerPoint Presentation File Graphics Tutorials
This is a line chart ppt powerpoint presentation file graphics tutorials. This is a one stage process. The stages in this process are months, line chart, bar graph, business, marketing.
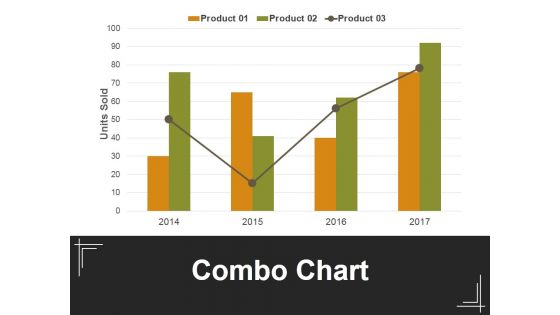
Combo Chart Ppt PowerPoint Presentation Outline Background Image
This is a combo chart ppt powerpoint presentation outline background image. This is a four stage process. The stages in this process are combo chart, units sold, bar graph, business, marketing.

Scatter Chart Ppt PowerPoint Presentation Model Show
This is a scatter chart ppt powerpoint presentation model show. This is a one stage process. The stages in this process are sales in percentage, scatter chart, business, bar graph, marketing.
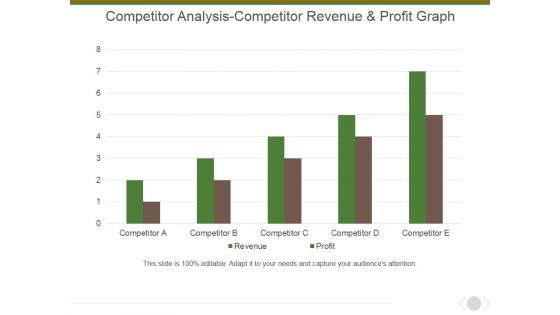
Competitor Analysis Competitor Revenue And Profit Graph Ppt PowerPoint Presentation Gallery Vector
This is a competitor analysis competitor revenue and profit graph ppt powerpoint presentation gallery vector. This is a five stage process. The stages in this process are bar graph, marketing, management, business, presentation.
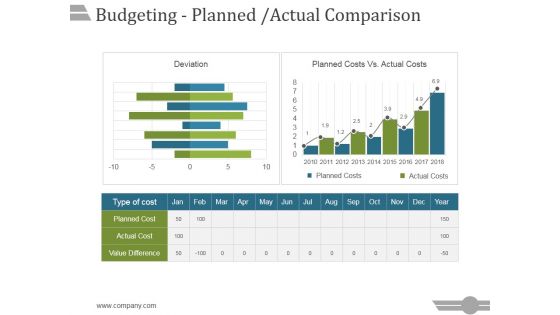
Budgeting Planned Actual Comparison Ppt PowerPoint Presentation Portfolio
This is a budgeting planned actual comparison ppt powerpoint presentation portfolio. This is a three stage process. The stages in this process are business, strategy, marketing, analysis, success, bar graph.

Competitor Revenue And Profit Ppt PowerPoint Presentation Layouts Vector
This is a competitor revenue and profit ppt powerpoint presentation layouts vector. This is a five stage process. The stages in this process are competitor, profit, revenue, bar graph, success.
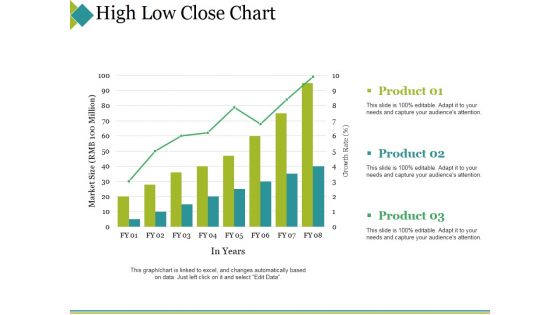
High Low Close Chart Ppt PowerPoint Presentation Portfolio Topics
This is a high low close chart ppt powerpoint presentation portfolio topics. This is a three stage process. The stages in this process are product, market size, in years, success, bar graph.
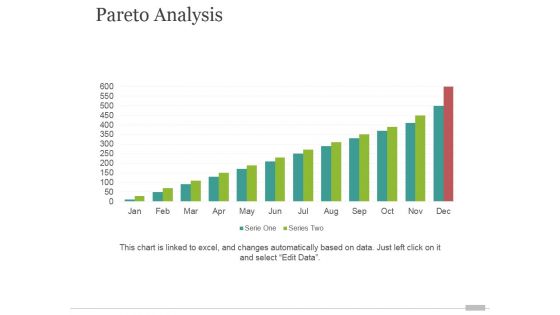
Pareto Analysis Tamplate 2 Ppt PowerPoint Presentation Graphics
This is a pareto analysis tamplate 2 ppt powerpoint presentation graphics. This is a twelve stage process. The stages in this process are bar graph, finance, marketing, strategy, analysis, business.
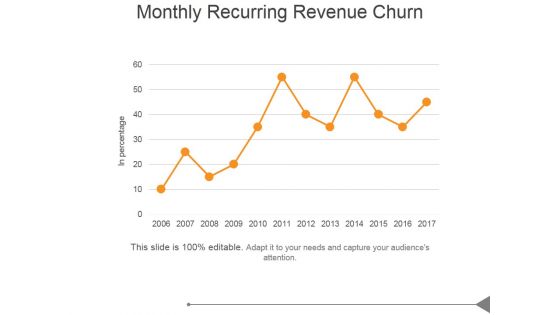
Monthly Recurring Revenue Churn Ppt PowerPoint Presentation Images
This is a monthly recurring revenue churn ppt powerpoint presentation images. This is a five stage process. The stages in this process are business, marketing, success, bar graph, growth.
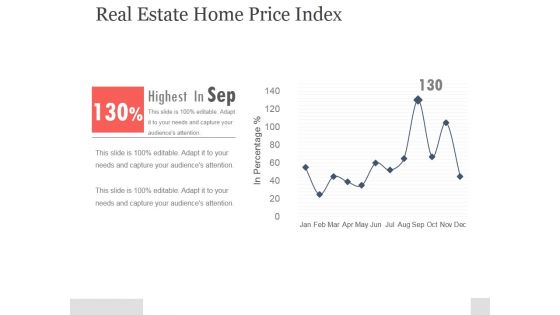
Real Estate Home Price Index Ppt PowerPoint Presentation Example
This is a real estate home price index ppt powerpoint presentation example. This is a one stage process. The stages in this process are bar graph, business, marketing, success, management.
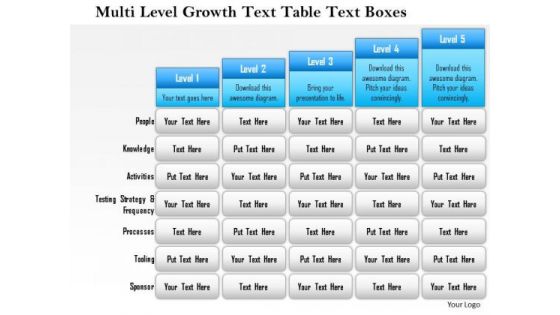
Business Framework Multi Level Growth Text Table Text Boxes 2 PowerPoint Presentation
Five staged text box style chart in bar graph design has been used to decorate this power point template slide. This diagram slide contains the multilevel growth concept. Use this PPT slide for financial growth and result analysis related topics.
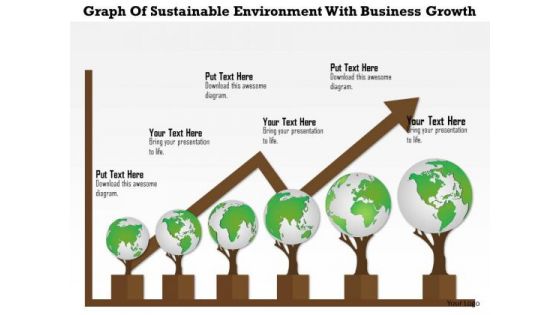
Business Diagram Graph Of Sustainable Environment With Business Growth Presentation Template
This diagram displays bar graph with globes and growth arrow. This image depicts concepts of green environment and business growth .Use this diagram to present your views in a wonderful manner.
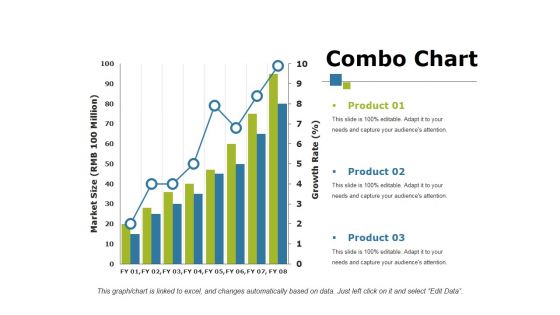
Combo Chart Ppt PowerPoint Presentation Show Influencers
This is a combo chart ppt powerpoint presentation show influencers. This is a three stage process. The stages in this process are product, bar graph, growth, growth rate, market size.
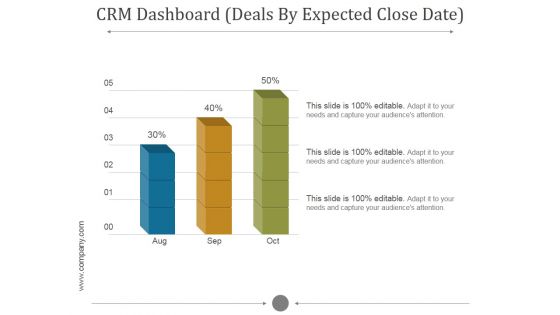
Crm Dashboard Deals By Expected Close Date Ppt PowerPoint Presentation Background Images
This is a crm dashboard deals by expected close date ppt powerpoint presentation background images. This is a five stage process. The stages in this process are bar graph, aug, sep, oct, growth.

Combo Chart Ppt PowerPoint Presentation Infographics Infographics
This is a combo chart ppt powerpoint presentation infographics infographics. This is a three stage process. The stages in this process are bar graph, growth, finance, marketing, strategy, business.
Crm Dashboard Deals By Expected Close Date Ppt PowerPoint Presentation Portfolio Icons
This is a crm dashboard deals by expected close date ppt powerpoint presentation portfolio icons. This is a three stage process. The stages in this process are bar graph, finance, marketing, strategy, business, analysis, growth.

Advertising Spent On Different Mediums Ppt PowerPoint Presentation Infographics Show
This is a advertising spent on different mediums ppt powerpoint presentation infographics show. This is a five stage process. The stages in this process are business, finance, marketing, strategy, bar graph, growth.
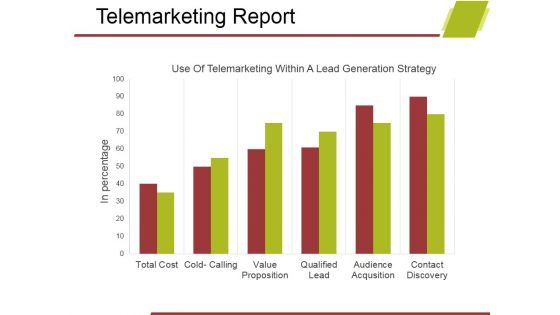
Telemarketing Report Template 1 Ppt PowerPoint Presentation Show Design Ideas
This is a telemarketing report template 1 ppt powerpoint presentation show design ideas. This is a six stage process. The stages in this process are business, bar graph, marketing, analysis, growth, strategy.

Dividend Per Share Ppt PowerPoint Presentation Summary Rules
This is a dividend per share ppt powerpoint presentation summary rules. This is a nine stage process. The stages in this process are business, bar graph, finance, marketing, strategy, growth.

Stacked Area Clustered Column Ppt PowerPoint Presentation Model Guidelines
This is a stacked area clustered column ppt powerpoint presentation model guidelines. This is a three stage process. The stages in this process are product, in percentage, bar graph, growth, success.

Stock Chart Template 1 Ppt PowerPoint Presentation Infographic Template Objects
This is a stock chart template 1 ppt powerpoint presentation infographic template objects. This is a two stage process. The stages in this process are product, profit, bar graph, growth, success.
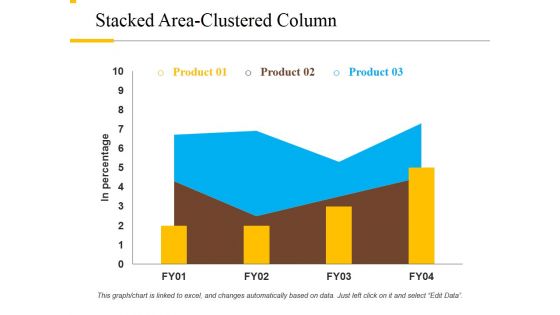
Stacked Area Clustered Column Ppt PowerPoint Presentation File Background Designs
This is a stacked area clustered column ppt powerpoint presentation file background designs. This is a three stage process. The stages in this process are product, in percentage, growth, success, bar graph.
Clustered Column Line Ppt PowerPoint Presentation Icon Ideas
This is a clustered column line ppt powerpoint presentation icon ideas. This is a three stage process. The stages in this process are product, in percentage, bar graph, success, growth.
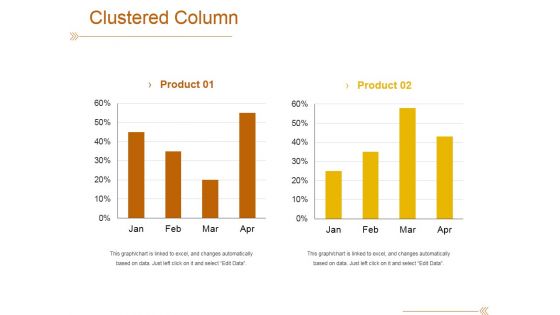
Clustered Column Template 1 Ppt PowerPoint Presentation Outline File Formats
This is a clustered column template 1 ppt powerpoint presentation outline file formats. This is a two stage process. The stages in this process are product, bar graph, success, growth, finance.

Clustered Column Template 2 Ppt PowerPoint Presentation Summary Smartart
This is a clustered column template 2 ppt powerpoint presentation summary smartart. This is a two stage process. The stages in this process are product, bar graph, in percentage, clustered column, growth.
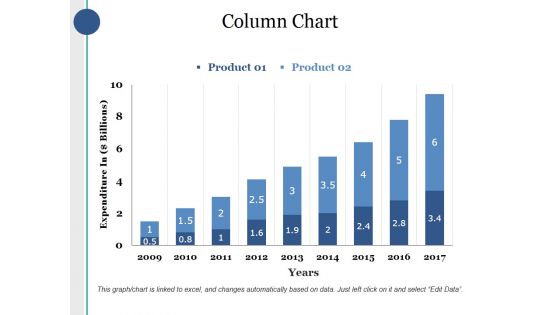
Column Chart Ppt PowerPoint Presentation Infographics Deck
This is a column chart ppt powerpoint presentation infographics deck. This is a two stage process. The stages in this process are product, expenditure in, years, bar graph, growth.
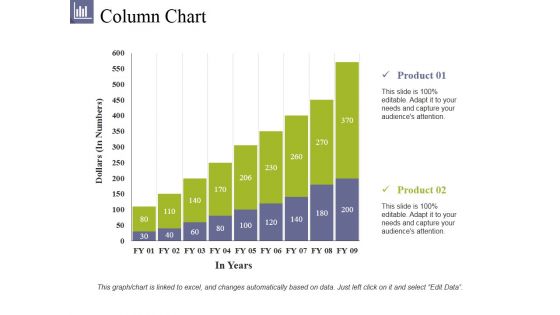
Column Chart Ppt PowerPoint Presentation File Summary
This is a column chart ppt powerpoint presentation file summary. This is a two stage process. The stages in this process are product, dollars, in years, bar graph, growth.

Clustered Column Line Ppt PowerPoint Presentation Topics
This is a clustered column line ppt powerpoint presentation topics. This is a three stage process. The stages in this process are product, in percentage, growth, bar graph, business.
Clustered Column Ppt PowerPoint Presentation Icon Objects
This is a clustered column ppt powerpoint presentation icon objects. This is a two stage process. The stages in this process are clustered column, product, growth, finance, bar graph.

Global Communication For Business Growth PowerPoint Templates Ppt Backgrounds For Slides 0613
Raise the bar with our Globe Powerpoint Templates. They are programmed to take you to the next level. Our People Powerpoint Templates bring a lot to the table. Their alluring flavours will make your audience salivate.

Graphical Representation For Total Business Revenue Ppt PowerPoint Presentation Diagrams
This is a graphical representation for total business revenue ppt powerpoint presentation diagrams. This is a nine stage process. The stages in this process are business, strategy, line chart, bar graph, marketing, management.
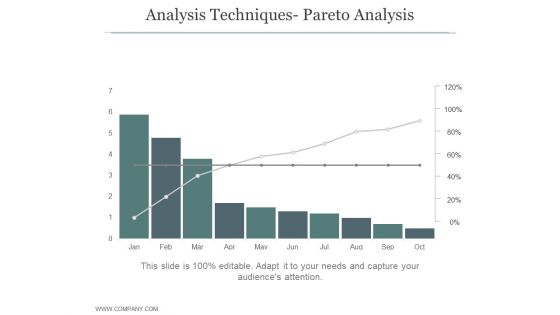
Analysis Techniques Pareto Analysis Ppt PowerPoint Presentation Example
This is a analysis techniques pareto analysis ppt powerpoint presentation example. This is a ten stage process. The stages in this process are business, strategy, bar graph, line graph, process.
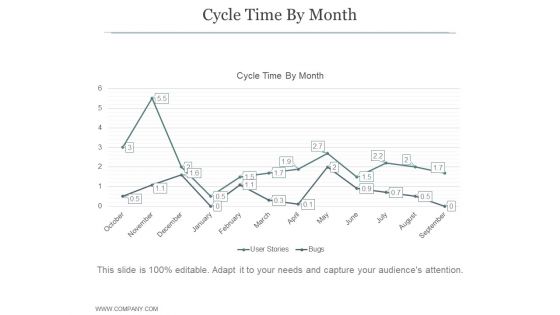
Cycle Time By Month Ppt PowerPoint Presentation Guidelines
This is a cycle time by month ppt powerpoint presentation guidelines. This is a twelve stage process. The stages in this process are business, strategy, marketing, process, arrow, finance, bar graph.
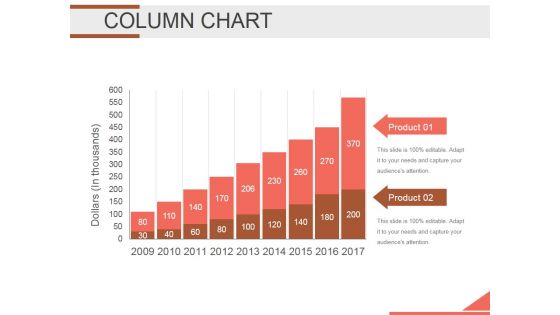
Column Chart Ppt PowerPoint Presentation Background Designs
This is a column chart ppt powerpoint presentation background designs. This is a two stage process. The stages in this process are bar graph, finance, marketing, strategy, analysis, business.
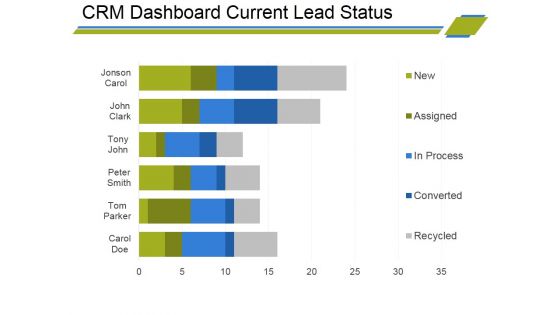
Crm Dashboard Current Lead Status Ppt PowerPoint Presentation Infographic Template Visual Aids
This is a crm dashboard current lead status ppt powerpoint presentation infographic template visual aids. This is a six stage process. The stages in this process are bar graph, finance, marketing, strategy, business, analysis.
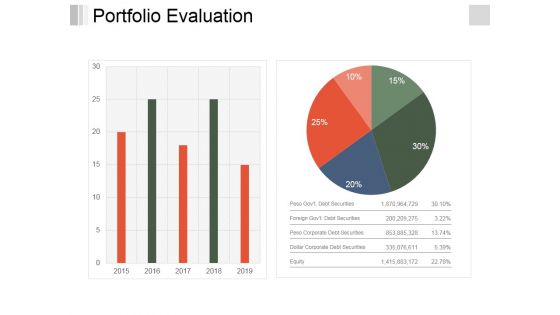
Portfolio Evaluation Ppt PowerPoint Presentation Infographics Objects
This is a portfolio evaluation ppt powerpoint presentation infographics objects. This is a two stage process. The stages in this process are business, finance, bar graph, pie chart, marketing, analysis, investment.

Gap Between Current And Required Staff Ppt PowerPoint Presentation Infographic Template Microsoft
This is a gap between current and required staff ppt powerpoint presentation infographic template microsoft. This is a five stage process. The stages in this process are business, bar graph, finance, marketing, strategy, analysis.

Financial Projection Graph Template 2 Ppt PowerPoint Presentation Infographic Template Gallery
This is a financial projection graph template 2 ppt powerpoint presentation infographic template gallery. This is a three stage process. The stages in this process are business, bar graph, finance, marketing, strategy, analysis.
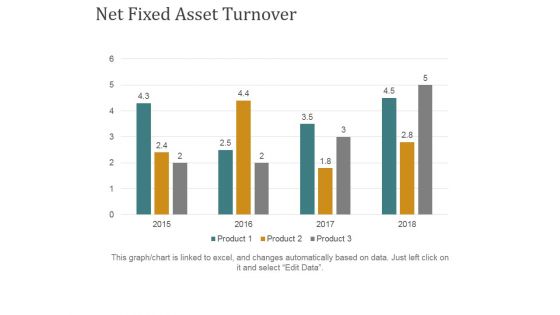
Net Fixed Asset Turnover Ppt PowerPoint Presentation Ideas Grid
This is a net fixed asset turnover ppt powerpoint presentation ideas grid. This is a four stage process. The stages in this process are business, finance, marketing, bar graph, strategy.
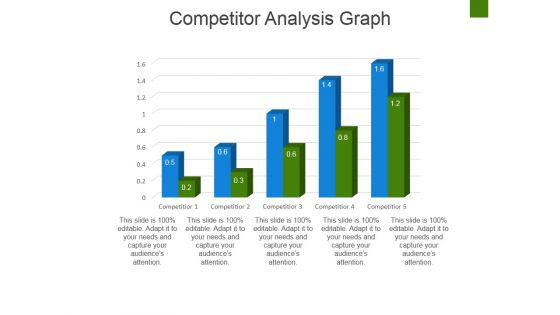
Competitor Analysis Graph Ppt PowerPoint Presentation Slides Elements
This is a competitor analysis graph ppt powerpoint presentation slides elements. This is a five stage process. The stages in this process are bar graph, finance, marketing, strategy, business.

Clustered Column Ppt PowerPoint Presentation File Slide
This is a clustered column ppt powerpoint presentation file slide. This is a two stage process. The stages in this process are product, financial year, sales in percentage, bar graph.
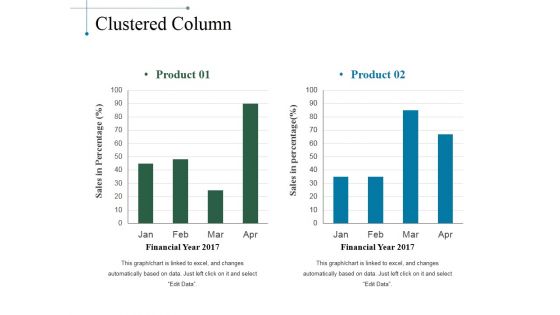
Clustered Column Ppt PowerPoint Presentation Slides Smartart
This is a clustered column ppt powerpoint presentation slides smartart. This is a two stage process. The stages in this process are product, sales in percentage, financial year, bar graph.
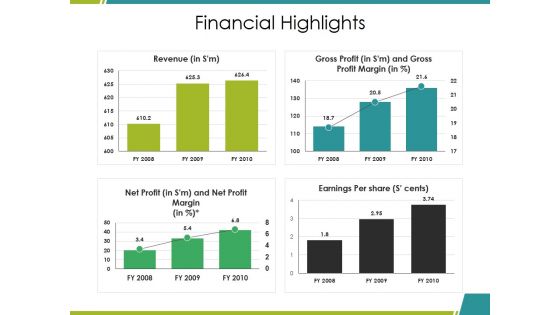
Financial Highlights Ppt PowerPoint Presentation Ideas Graphics Download
This is a financial highlights ppt powerpoint presentation ideas graphics download. This is a four stage process. The stages in this process are revenue, gross profit, net profit, earnings per share, bar graph.

Profitability Ratios Template 3 Ppt PowerPoint Presentation Gallery Slide Portrait
This is a profitability ratios template 3 ppt powerpoint presentation gallery slide portrait. This is a four stage process. The stages in this process are category, roce, net income, business, bar graph.

Column Chart Ppt PowerPoint Presentation Layouts Graphics Example
This is a column chart ppt powerpoint presentation layouts graphics example. This is a two stage process. The stages in this process are product, year, bar graph, business, finance.
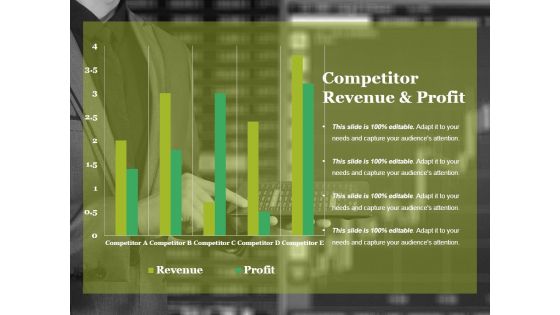
Competitor Revenue And Profit Ppt PowerPoint Presentation Model Templates
This is a competitor revenue and profit ppt powerpoint presentation model templates. This is a five stage process. The stages in this process are revenue, profit, competitor, bar graph, business.
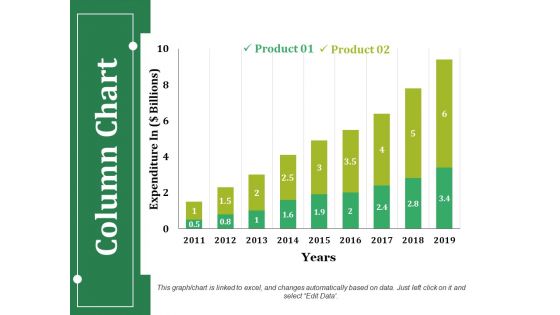
Column Chart Ppt PowerPoint Presentation Infographics Guidelines
This is a column chart ppt powerpoint presentation infographics guidelines. This is a two stage process. The stages in this process are product, expenditure in, years, business, bar graph.

Column Chart Ppt PowerPoint Presentation Layouts Vector
This is a column chart ppt powerpoint presentation layouts vector. This is a two stage process. The stages in this process are product, column chart, bar graph, percentage, finance.

Stacked Area Clustered Column Ppt PowerPoint Presentation Gallery Gridlines
This is a stacked area clustered column ppt powerpoint presentation gallery gridlines. This is a three stage process. The stages in this process are bar graph, product, in percentage.

Stacked Area Clustered Column Ppt PowerPoint Presentation Summary Slides
This is a stacked area clustered column ppt powerpoint presentation summary slides. This is a three stage process. The stages in this process are product, in percentage, financial year, bar graph.
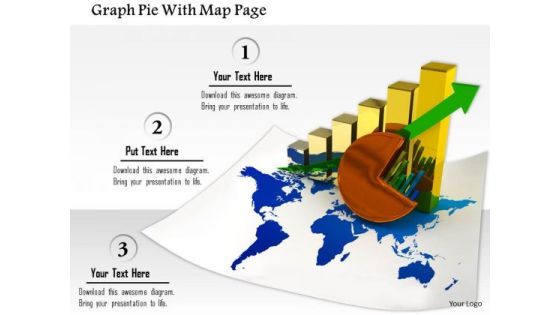
Stock Photo Graph Pie With Map Page PowerPoint Slide
This image slide contains business charts on world map. This image is designed with bar graph and pie chart on world map depicting global economy. Use this image slide to represent financial growth in any business presentation.
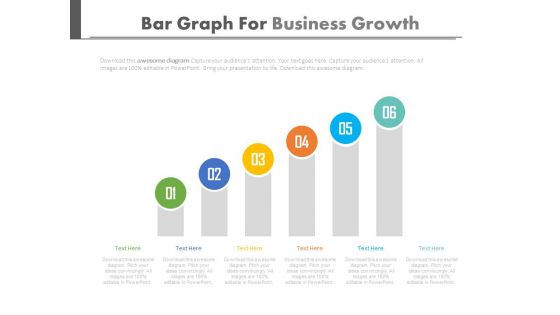
Setting Goals And Developing Strategies Powerpoint Slides
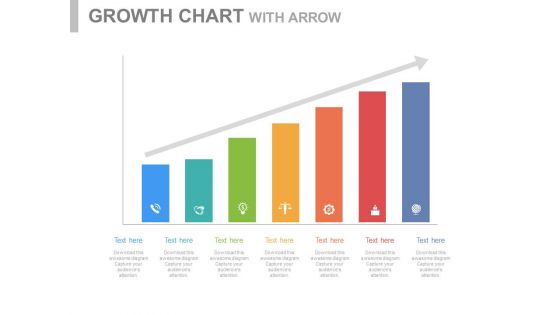
This PowerPoint template is useful for setting goals and developing strategies. This PPT background has a design of six steps bar graph. This PPT slide is suitable for topics like corporate strategic planning.
Steps For Developing Strategic Plan Powerpoint Slides
This PowerPoint template is useful for setting goals and developing strategies. This PPT background has a design of seven steps bar graph. This PPT slide is suitable for topics like corporate strategic planning.
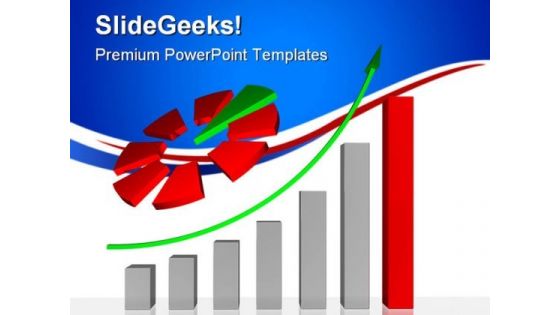
Statistique Success Business PowerPoint Templates And PowerPoint Backgrounds 0811
Microsoft PowerPoint Template and Background with colorful bars and pie
Comparison Of Prices Ppt PowerPoint Presentation Designs Download
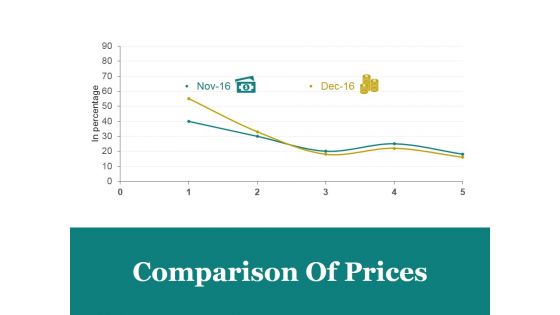
This is a comparison of prices ppt powerpoint presentation designs download. This is a two stage process. The stages in this process are comparison of prices, marketing, in percentage, bar graph, business.

Business Diagram Puzzle Pieces With Different Height Presentation Template
A professional bar graph has been crafted with graphic of puzzles. All these puzzles are in different heights which shows the various levels of any data result representations. Use this diagram for your business result and data analysis related topics.
Man On Top With Success Trophy Powerpoint Template
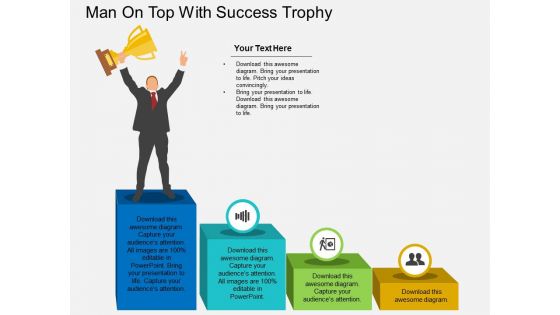
This PowerPoint template has been designed with graphics man standing on top bar with trophy. This Professional may be used to display concept of win, success and strategy. Download this business slide to build impressive presentation.

Monthly Run Revenue Ppt PowerPoint Presentation Design Ideas
This is a monthly run revenue ppt powerpoint presentation design ideas. This is a two stage process. The stages in this process are business, marketing, success, bar graph, growth.

Quarter Track Record Ppt PowerPoint Presentation Gallery Images
This is a quarter track record ppt powerpoint presentation gallery images. This is a two stage process. The stages in this process are series, bar graph, growth, success, business.

Business Diagram Colored Graph For Business And Finance Data Analysis Presentation Template
This Power Point template has been designed with graphic of colored bar graph. Use this slide to represent five steps of any business process. Use this diagram for your business presentations and get exclusive comments on your efforts.

Business Diagram Five Steps Infographics For Data Display Presentation Template
This business diagram has been designed with graphic of five staged info graphics. This diagram can be used to display statistical information. Use this bar graph for your business and sales related presentations.

Show Your Creativity In Business PowerPoint Templates Ppt Backgrounds For Slides 0513
Raise The Bar With Our marketing Power Point Templates. They Are Programmed To Take You To The Next Level. Our spheres Power Point Templates Bring A Lot To The Table. Their Alluring Flavors Will Make Your Audience Salivate.
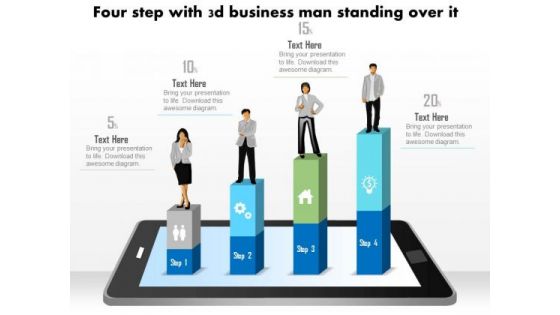
Business Diagram Four Steps With 3d Business Person Standing Over It PowerPoint Slide
This business diagram displays bar graph with business person standing on it. This Power Point template has been designed to display personal growth. You may use this diagram to impart professional appearance to your presentations.
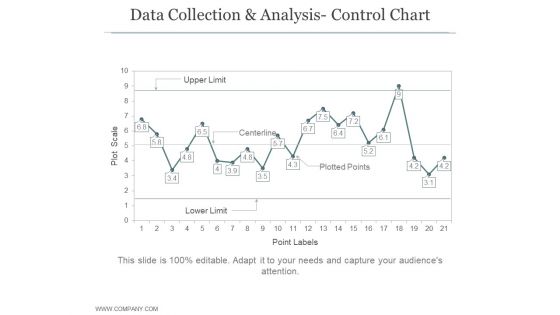
Data Collection And Analysis Control Chart Ppt PowerPoint Presentation Example File
This is a data collection and analysis control chart ppt powerpoint presentation example file. This is a four stage process. The stages in this process are business, strategy, marketing, bar graph, growth strategy.

Clustered Column Line Ppt PowerPoint Presentation Slide
This is a clustered column line ppt powerpoint presentation slide. This is a three stage process. The stages in this process are bar graph, growth, finance, product, sales in percentage.
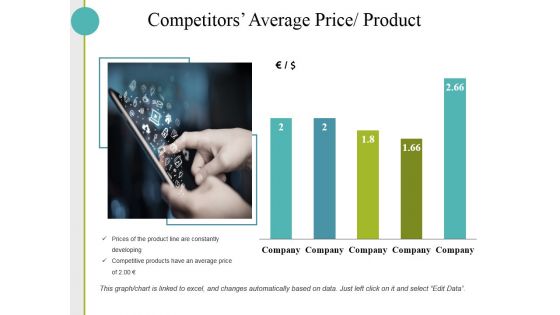
Competitors Average Price Product Ppt PowerPoint Presentation Inspiration Templates
This is a competitors average price product ppt powerpoint presentation inspiration templates. This is a five stage process. The stages in this process are business, finance, analysis, growth, investment, bar graph.

Usa Map Chart Americana PowerPoint Presentation Slides C
Microsoft PowerPoint Slides and Backgrounds with of a multicolored bar chart sitting on top of a transparent extruded map of the united states on a medium gray reflective surface
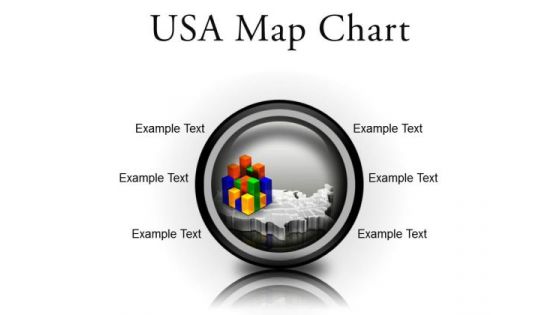
Usa Map Chart Americana PowerPoint Presentation Slides Cc
Microsoft PowerPoint Slides and Backgrounds with of a multicolored bar chart sitting on top of a transparent extruded map of the united states on a medium gray reflective surface

Usa Map Chart Americana PowerPoint Presentation Slides F
Microsoft PowerPoint Slides and Backgrounds with of a multicolored bar chart sitting on top of a transparent extruded map of the united states on a medium gray reflective surface
Usa Map Chart Americana PowerPoint Presentation Slides R
Microsoft PowerPoint Slides and Backgrounds with of a multicolored bar chart sitting on top of a transparent extruded map of the united states on a medium gray reflective surface
Usa Map Chart Americana PowerPoint Presentation Slides S
Microsoft PowerPoint Slides and Backgrounds with of a multicolored bar chart sitting on top of a transparent extruded map of the united states on a medium gray reflective surface

Fort With Light House PowerPoint Templates Ppt Backgrounds For Slides 0613
Raise the bar with our Nature Powerpoint Templates. They are programmed to take you to the next level. Our Environment Powerpoint Templates bring a lot to the table. Their alluring flavours will make your audience salivate.

Business Diagram Persons Standing On Books Presentation Slide Template
This power point diagram template has been crafted with graphic of bar graph made with books and 3d man. This diagram template contains the concept of education and success. Use this diagram slide for your business and education presentation.
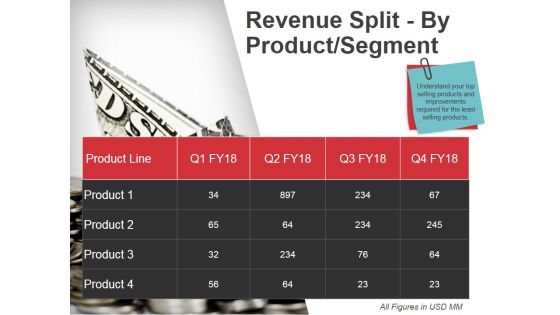
Revenue Split By Product Segment Ppt PowerPoint Presentation Ideas Graphics
This is a revenue split by product segment ppt powerpoint presentation ideas graphics. This is a four stage process. The stages in this process are business, marketing, bar graph, success.
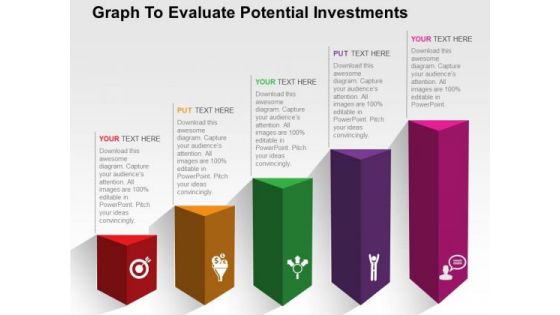
Graph To Evaluate Potential Investments PowerPoint Templates
Use this diagram to evaluate potential investments. This PPT slide contains bar graph with icons. This slide is designed to attract the attention of your audience towards business plan evaluation.

Clustered Column Template 1 Ppt PowerPoint Presentation Inspiration
This is a clustered column template 1 ppt powerpoint presentation inspiration. This is a twelve stage process. The stages in this process are bar graph, marketing, strategy, analysis, business, success.
Clustered Column Template 2 Ppt PowerPoint Presentation Icon
This is a clustered column template 2 ppt powerpoint presentation icon. This is a two stage process. The stages in this process are bar graph, marketing, strategy, analysis, business, success.

Crowdfunding Statistics Template 1 Ppt PowerPoint Presentation Good
This is a crowdfunding statistics template 1 ppt powerpoint presentation good. This is a two stage process. The stages in this process are business, location, geographical, finance, bar graph, marketing.

Financial Highlights Template 1 Ppt PowerPoint Presentation Model
This is a financial highlights template 1 ppt powerpoint presentation model. This is a four stage process. The stages in this process are business, marketing, success, business plan, bar graph.

Lead Scoring Template Ppt PowerPoint Presentation Model
This is a lead scoring template ppt powerpoint presentation model. This is a four stage process. The stages in this process are business, marketing, success, bar graph, lead scoring.
Revenue Split By Product Segment Template 1 Ppt PowerPoint Presentation Ideas Icons
This is a revenue split by product segment template 1 ppt powerpoint presentation ideas icons. This is a four stage process. The stages in this process are business, marketing, success, bar graph, product.

Gap Between Current And Required Staff Ppt PowerPoint Presentation File Tips
This is a gap between current and required staff ppt powerpoint presentation file tips. This is a five stage process. The stages in this process are number of staff, bar graph, business, marketing, success.

Gap Between Current And Required Staff Ppt PowerPoint Presentation Inspiration Slides
This is a gap between current and required staff ppt powerpoint presentation inspiration slides. This is a five stage process. The stages in this process are number of staff, bar graph, business, marketing, success.

Telemarketing Report Template 2 Ppt PowerPoint Presentation Styles Model
This is a telemarketing report template 2 ppt powerpoint presentation styles model. This is a six stage process. The stages in this process are use of telemarketing within a lead generation strategy, business, bar graph, marketing, success.
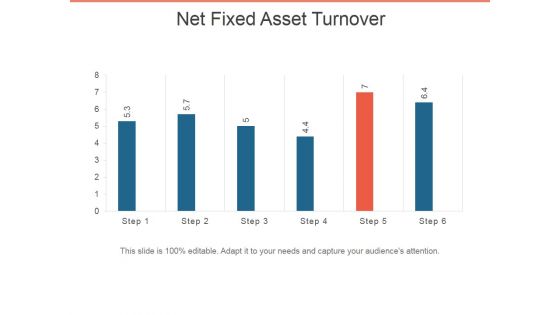
Net Fixed Asset Turnover Ppt PowerPoint Presentation Infographic Template Pictures
This is a net fixed asset turnover ppt powerpoint presentation infographic template pictures. This is a six stage process. The stages in this process are bar graph, business, marketing, presentation, success.

Us Vs Competitors Template 1 Ppt PowerPoint Presentation Model File Formats
This is a us vs competitors template 1 ppt powerpoint presentation model file formats. This is a nine stage process. The stages in this process are bar graph, business, marketing, management, success.

Staff With Professional Qualification Ppt PowerPoint Presentation Gallery Graphics Pictures
This is a staff with professional qualification ppt powerpoint presentation gallery graphics pictures. This is a five stage process. The stages in this process are qualification, bar graph, business, marketing, success.
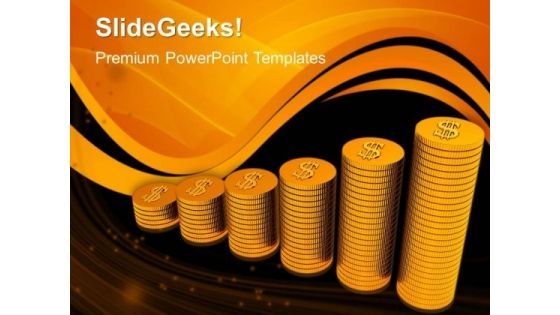
Coins Investment PowerPoint Templates And PowerPoint Themes 1012
Coins Investment PowerPoint Templates And PowerPoint Themes 1012-Use this PowerPoint Template to signify the concept of Bar graph. It consists of the coins forming the Bar graph. This image has been conceived to enable you to emphatically communicate your ideas in your Business PPT presentation. Original thinking is the need of the hour. We provide the means to project your views.-Coins Investment PowerPoint Templates And PowerPoint Themes 1012-This PowerPoint template can be used for presentations relating to-Gold coins, business, money, finance, success, signs
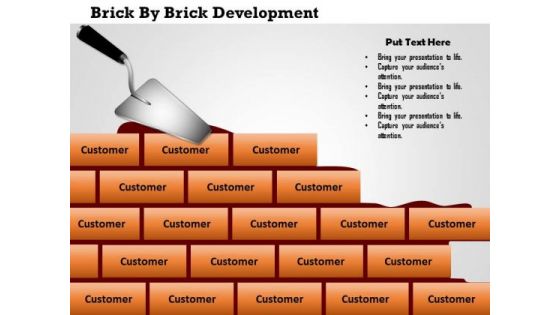
Business Framework Brick By Brick Development PowerPoint Presentation
This business framework displays graphic of bricks taking shape of wall. This business slide depicts concept of progress and development. Use this editable slide to make impressive presentations.
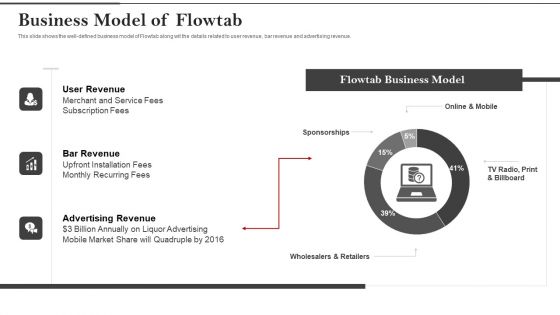
Flowtab Venture Capital Investment Business Model Of Flowtab Elements PDF
This slide shows the well defined business model of Flowtab along wit the details related to user revenue, bar revenue and advertising revenue. This is a flowtab venture capital investment business model of flowtab elements pdf template with various stages. Focus and dispense information on three stages using this creative set, that comes with editable features. It contains large content boxes to add your information on topics like user revenue, bar revenue, advertising revenue. You can also showcase facts, figures, and other relevant content using this PPT layout. Grab it now.
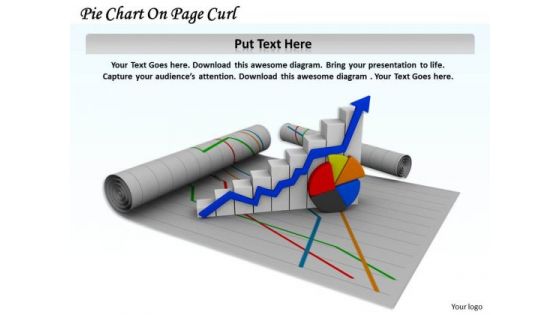
Stock Photo Pie Chart On Page Curl Arrow PowerPoint Slide
This image slide displays pie chart and growth bar graph on page curl. Use this image slide, in your presentations to express views on progress, growth and achievements. This image slide may also be used to depict strategic business planning. Make professional presentations using this image slide.

Stock Photo Pie Chart On Page Curl PowerPoint Slide
This image slide displays pie chart and growth bar graph on page curl on blue shaded background. Use this image slide, in your presentations to express views on progress, growth and achievements. This image slide may also be used to depict strategic business planning. Make professional presentations using this image slide.
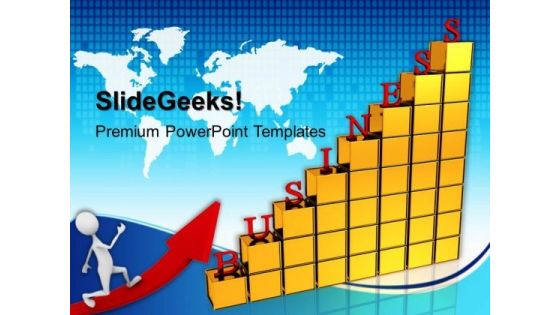
A Corporate Business Growth Graph PowerPoint Templates And PowerPoint Themes 1012
A Corporate Business Growth Graph PowerPoint Templates And PowerPoint Themes 1012-This PowerPoint Template shows the Bar Graph with increasing percentage which signifies the Financial or Business Growth. The Template signifies business concept. It signifies teamwork and team leader. Use this template for Global Business. The structure of our templates allows you to effectively highlight the key issues concerning the growth of your business.-A Corporate Business Growth Graph PowerPoint Templates And PowerPoint Themes 1012-This PowerPoint template can be used for presentations relating to-Business bar graph chart, technology, finance, arrows, business, success
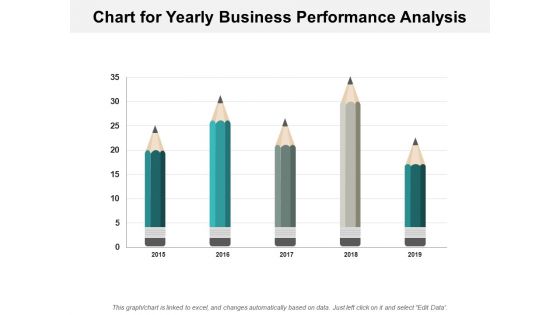
Chart For Yearly Business Performance Analysis Ppt PowerPoint Presentation Slide Download
Presenting this set of slides with name chart for yearly business performance analysis ppt powerpoint presentation slide download. The topics discussed in these slides are education, growth, pencil bar graph. This is a completely editable PowerPoint presentation and is available for immediate download. Download now and impress your audience.

Growth Chart Business PowerPoint Templates And PowerPoint Backgrounds 0411
Microsoft PowerPoint Template and Background with growth chart green bars and red arrow pointing upwards

Growth Chart Business PowerPoint Themes And PowerPoint Slides 0411
Microsoft PowerPoint Theme and Slide with growth chart green bars and red arrow pointing upwards
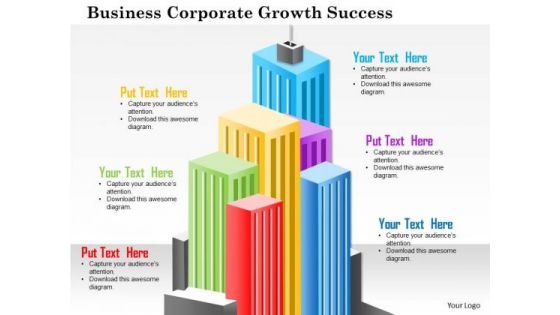
Business Framework Business Corporate Growth Success PowerPoint Presentation
This power point diagram slide has been designed with business corporate growth and success concept. To display this concept we have used graphic of multicolored bar graphs. This graphic slide is based on profit growth in any business. Use this slide for business and finance related presentations.

Stock Photo Green Grass Business Growth Chart PowerPoint Slide
This PowerPoint slide display chart created with green grass. This image slide has been crafted with graphic of green grass bar graph. This image depicts business. Use this image slide to express views on targets, goals, growth and management in your presentations. This image slide exhibits various information which requires visual aid. Enhance the quality of your presentations using this image.

Dollar Profits Growth PowerPoint Templates And PowerPoint Themes 1012
Deliver amazing Presentations with our above template showing profit and growth bar graph. Adjust the above image in your PPT presentations to visually support your content in your Business PPT slideshows marketing, finance, success and strategy. Deliver amazing presentations to mesmerize your audience.
Finance Manager Vector Icon Ppt PowerPoint Presentation Professional Structure PDF
Presenting this set of slides with name finance manager vector icon ppt powerpoint presentation professional structure pdf. This is a one stage process. The stage in this process is finance manager vector icon with bar graph and gear. This is a completely editable PowerPoint presentation and is available for immediate download. Download now and impress your audience.
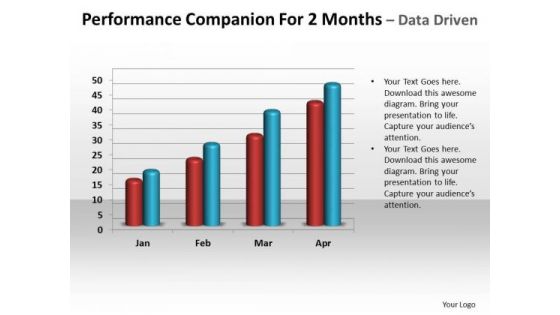
Buinsess Marketing PowerPoint Templates Business Performance Companion For 2 Month Ppt Slides
Business Marketing PowerPoint Template business performance companion for 2 months PPT slide-This PowerPoint Template shows bar chart analysing performance of 2 months of the company. Business Marketing PowerPoint Template business performance companion for 2 months PPT slide-This ppt can be used for concepts relating to-investment, finance, business, Comparison, performance etc.

PowerPoint Process Lego Blocks Process Success Ppt Slides
PowerPoint Process Lego Blocks Process Success PPT Slides-This Business PowerPoint diagram consists of bar Graph of Lego blocks which is monotonically increasing. It refers to the Financial Growth of the Business. It Portrays the concept of Construction, Manufacturing, Design, Retail Market and Business Consultants.-PowerPoint Process Lego Blocks Process Success PPT Slides
Five Steps Business Growth Chart With Icons Ppt PowerPoint Presentation Model Sample
Presenting this set of slides with name five steps business growth chart with icons ppt powerpoint presentation model sample. This is a five stage process. The stages in this process are education, growth, pencil bar graph. This is a completely editable PowerPoint presentation and is available for immediate download. Download now and impress your audience.
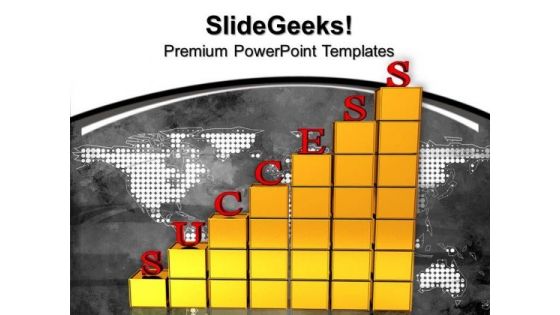
Success Graph Business PowerPoint Templates And PowerPoint Themes 1012
The above template displays a diagram of a bar graph showing success. This image represents the concept of growth in business. This image has been conceived to enable you to emphatically communicate your ideas in your Business PPT presentations. Create captivating presentations to deliver comparative and weighted arguments.
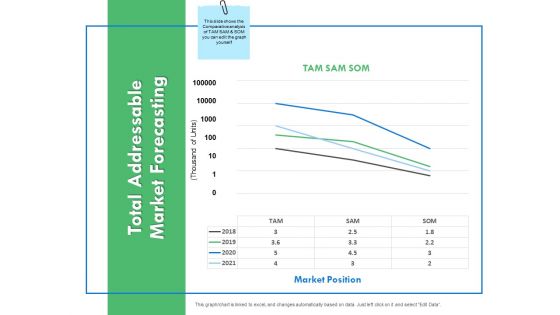
Total Addressable Market Forecasting Ppt PowerPoint Presentation Model Slideshow
Presenting this set of slides with name total addressable market forecasting ppt powerpoint presentation model slideshow. The topics discussed in these slides are bar graph, finance, marketing, analysis, investment. This is a completely editable PowerPoint presentation and is available for immediate download. Download now and impress your audience.

Quarterly Sales Growth Chart For Financial Report Ppt PowerPoint Presentation Ideas Infographics
Presenting this set of slides with name quarterly sales growth chart for financial report ppt powerpoint presentation ideas infographics. The topics discussed in these slides are revenue trend, bar chart, financial. This is a completely editable PowerPoint presentation and is available for immediate download. Download now and impress your audience.
Standard Icon Business Benchmarking Gear Ppt PowerPoint Presentation Complete Deck
Presenting this set of slides with name standard icon business benchmarking gear ppt powerpoint presentation complete deck. The topics discussed in these slides are bar chart, business benchmarking, gear, financial, seo performance. This is a completely editable PowerPoint presentation and is available for immediate download. Download now and impress your audience.
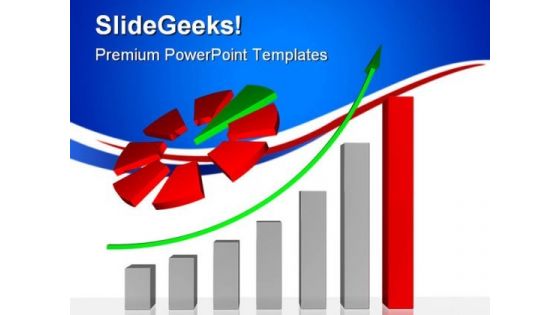
Statistique Success Business PowerPoint Themes And PowerPoint Slides 0811
Microsoft PowerPoint Theme and Slide with colorful bars and pie on white Slide
Success Graph Leadership PowerPoint Templates And PowerPoint Themes 1012
The above template displays a diagram of a bar graph. This image represents the concept of leadership. This image has been conceived to enable you to emphatically communicate your ideas in your Business PPT presentations. Create captivating presentations to deliver comparative and weighted arguments.

Graph Business PowerPoint Background And Template 1210
Microsoft PowerPoint Template and Background with a 3d rendering of a gold bars histogram

0814 Business Diagram 2015 For Planning Image Graphics For PowerPoint
Define the concepts of target and success with this unique image. This image depicts planning for year 2015. In this image pie chart and bar graph is displayed with year 2015. Use this image in business, marketing and sales related presentations.
Business Diagram Icons For Good Marketing Strategy Presentation Template
This power point template has been designed with graphic of bar graph, suitcase and meeting business icons. These business icons are used to display the concept of business result analysis and meeting. Use this diagram for business related topics in any presentations.
Business Chart Finance PowerPoint Templates And PowerPoint Themes 1012
Visually support your Microsoft office PPT Presentation with our above template illustrating a colored bar graph. This image has been professionally designed to emphasize the concept of statistics. This image has been conceived to enable you to emphatically communicate your ideas in your Business and Financial PPT presentations showing reports, ratings and reviews etc. Deliver amazing presentations to mesmerize your audience.

0814 Business Diagram For Planning Image Graphics For PowerPoint
Define the concepts of planning with this unique image. This image of charts and graphs depicts planning for year 2015. In this image pie chart and bar graph is displayed with year 2015. Use this image in business, marketing and sales related presentations.
Transparent Colorful Graph Business PowerPoint Templates And PowerPoint Backgrounds 0811
Microsoft PowerPoint Template and Background with transparent colorful bars and pie
Transparent Colorful Graph Business PowerPoint Themes And PowerPoint Slides 0811
Microsoft PowerPoint Theme and Slide with transparent colorful bars and pie

PowerPoint Template Lego Blocks Process Business Ppt Template
PowerPoint Template Lego Blocks Process Business PPT template-This PowerPoint diagram Consists of Lego Bar Graph which is Monotonically Increasing. Lego is a children's toy used for building models with small colorful plastic bricks that fit together and come apart again. It signifies action figure, balloon, beanbag, brick, building block, cap, catapult, Dinky Toy, dollhouse, doll
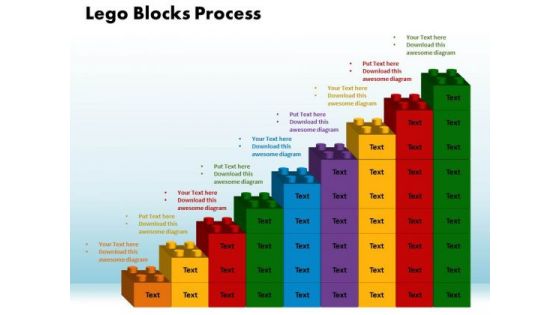
PowerPoint Template Lego Blocks Process Business Ppt Themes
PowerPoint Template Lego Blocks Process Business PPT Themes-Use This Lego Bar Graph which is Monotonically Increasing. This PowerPoint diagram imitates children's toy used for building models with small colorful plastic bricks that fit together and come apart again.-PowerPoint Template Lego Blocks Process Business PPT Themes

Business Diagram Magnifier With Ribbon Style Text Boxes Presentation Template
This business diagram has been designed with magnifier on five bar style text boxes. This diagram provides an effective way of displaying information you can edit text, color, shade and style as per you need. Present your views using this innovative slide and be assured of leaving a lasting impression
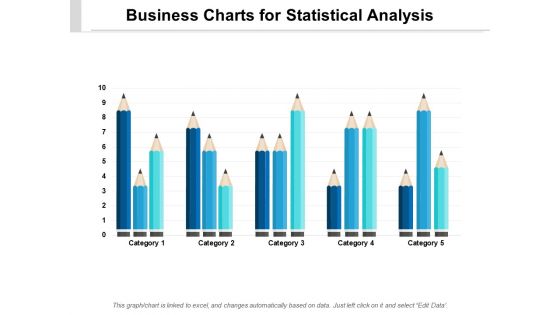
Business Charts For Statistical Analysis Ppt PowerPoint Presentation Pictures Gridlines
Presenting this set of slides with name business charts for statistical analysis ppt powerpoint presentation pictures gridlines. The topics discussed in these slides are education, growth, pencil bar graph. This is a completely editable PowerPoint presentation and is available for immediate download. Download now and impress your audience.

Maximizing Value Business Existing Customers Ppt PowerPoint Presentation Complete Deck
Presenting this set of slides with name maximizing value business existing customers ppt powerpoint presentation complete deck. The topics discussed in these slides are bar graph increasing, business, existing customers, strategies, customer base. This is a completely editable PowerPoint presentation and is available for immediate download. Download now and impress your audience.

Merchandise Product Development Funding Proposal Project Context One Pager Sample Example Document
This slide covers details regarding project context of Merchandise Progress Financing Proposal in terms of concerns faced by firm such as no experience in Merchandise Progress product, ineffective Merchandise Progress capability. Presenting you an exemplary Merchandise Product Development Funding Proposal Project Context One Pager Sample Example Document. Our one-pager comprises all the must-have essentials of an inclusive document. You can edit it with ease, as its layout is completely editable. With such freedom, you can tweak its design and other elements to your requirements. Download this Merchandise Product Development Funding Proposal Project Context One Pager Sample Example Document brilliant piece now.

Quality Improvement In Healthcare Institutions And Hospitals Ideas PDF
This slide shows a bar graph of quality improvement in healthcare institutions. Main components covered are patient satisfaction, reducing readmissions and cost savings.Showcasing this set of slides titled Quality Improvement In Healthcare Institutions And Hospitals Ideas PDF The topics addressed in these templates are Improvement Initiatives, Healthcare Institutes ,Focusing Improving All the content presented in this PPT design is completely editable. Download it and make adjustments in color, background, font etc. as per your unique business setting.

7 Arrows Pointing Upwards Aligned Ppt What Is Business Plan PowerPoint Slides
We present our 7 arrows pointing upwards aligned ppt what is business plan PowerPoint Slides.Download and present our Arrows PowerPoint Templates because it helps to prove the viability of your ideas to help your organisation to achieve the quality and success required. Download our Shapes PowerPoint Templates because you can Churn the wheels of the brains of your colleagues. Use our Metaphors-Visual Concepts PowerPoint Templates because this slide shows each path to the smallest detail. Download our Signs PowerPoint Templates because this diagram helps you to develop your marketing strategy and communicate your enthusiasm and motivation to raise the bar. Download our Business PowerPoint Templates because you are ready to flap your wings and launch off. All poised are you to touch the sky with glory.Use these PowerPoint slides for presentations relating to 3d, abstract, accounting, arrow, background, bank, bar, benefit, business, calculation, capital, chart, company, connection, corporate, data, design, diagram, directive, earnings, economy, enterprise, finance, forecast, graph, growth, illustration, income, increase, information, interest, internet, investment, investor, management, market, measure, network, office, perspective, plan, price, profit, progress, rise, statistics, technology, vector, wealth, world. The prominent colors used in the PowerPoint template are Red, Gray, Black. People tell us our 7 arrows pointing upwards aligned ppt what is business plan PowerPoint Slides are Tranquil. Use our bar PowerPoint templates and PPT Slides are One-of-a-kind. Use our 7 arrows pointing upwards aligned ppt what is business plan PowerPoint Slides are Vintage. PowerPoint presentation experts tell us our bar PowerPoint templates and PPT Slides are Luxuriant. People tell us our 7 arrows pointing upwards aligned ppt what is business plan PowerPoint Slides are Dazzling. Customers tell us our background PowerPoint templates and PPT Slides are Chic.
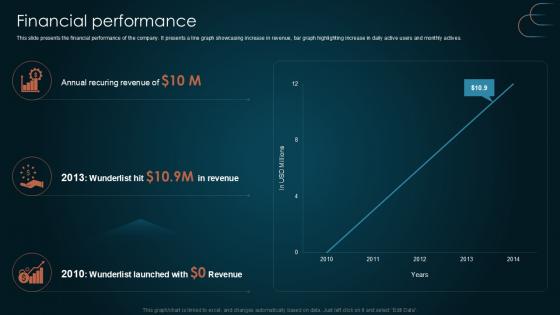
Financial Performance Team Collaboration Platform Pitch Deck PPT Template
This slide presents the financial performance of the company. It presents a line graph showcasing increase in revenue, bar graph highlighting increase in daily active users and monthly actives. There are so many reasons you need a Financial Performance Team Collaboration Platform Pitch Deck PPT Template. The first reason is you can not spend time making everything from scratch, Thus, Slidegeeks has made presentation templates for you too. You can easily download these templates from our website easily.
Project Tracking Gantt Chart Summary PDF
The following slide showcases the progress status of project tracking activities to achieve deliverables. It constitutes of weekly progress status of each project to assess the pending tasks. Showcasing this set of slides titled Project Tracking Gantt Chart Summary PDF. The topics addressed in these templates are Determine, Project, Review Design. All the content presented in this PPT design is completely editable. Download it and make adjustments in color, background, font etc. as per your unique business setting.
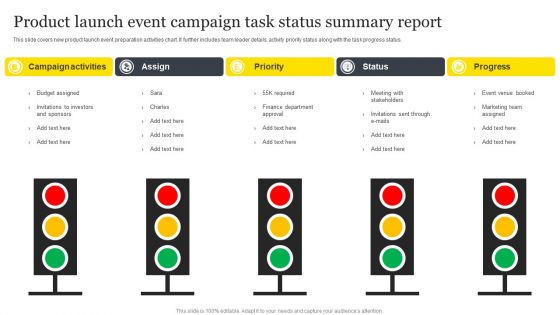
Product Launch Event Campaign Task Status Summary Report Background PDF
This slide covers new product launch event preparation activities chart. It further includes team leader details, activity priority status along with the task progress status. Pitch your topic with ease and precision using this Product Launch Event Campaign Task Status Summary Report Background PDF. This layout presents information on Campaign activities, Assign, Priority, Progress. It is also available for immediate download and adjustment. So, changes can be made in the color, design, graphics or any other component to create a unique layout.

Project Status Report Showcasing Multiple Project Structure PDF
This slide displays project status summary of multiple projects. Company can keep record of different projects simultaneously by tracking completed projects, project in progress and project not started. Presenting Project Status Report Showcasing Multiple Project Structure PDF to dispense important information. This template comprises one stages. It also presents valuable insights into the topics including Completed Project, In Progress, Assigned Started. This is a completely customizable PowerPoint theme that can be put to use immediately. So, download it and address the topic impactfully.
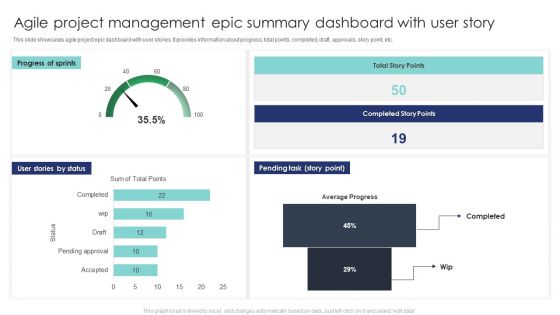
Agile Project Management Epic Summary Dashboard With User Story Formats PDF
This slide showcases agile project epic dashboard with user stories. It provides information about progress, total points, completed, draft, approvals, story point, etc. Pitch your topic with ease and precision using this Agile Project Management Epic Summary Dashboard With User Story Formats PDF. This layout presents information on Pending Tast, Progress Sprints, User Stories Status. It is also available for immediate download and adjustment. So, changes can be made in the color, design, graphics or any other component to create a unique layout.

Various Mobile Search Engine Optimization Strategies To Improve User Experience Ideas PDF
This slide shows four mobile search engine optimization strategies. These strategies are improve site load time, user experience, navigation bar and mobile URL. Presenting Various Mobile Search Engine Optimization Strategies To Improve User Experience Ideas PDF to dispense important information. This template comprises four stages. It also presents valuable insights into the topics including Reduce Server, Designs, Resource Locator. This is a completely customizable PowerPoint theme that can be put to use immediately. So, download it and address the topic impactfully.

Improving Current Organizational Logistic Process Receiving Real Time Information Infographics PDF
This slide covers the bar coded information which helps to check the detailed receiving and ensures that the inbound process is running smoothly. Deliver an awe inspiring pitch with this creative improving current organizational logistic process receiving real time information infographics pdf bundle. Topics like customers benefit, products, barcoding is specifically concatenation can be discussed with this completely editable template. It is available for immediate download depending on the needs and requirements of the user.
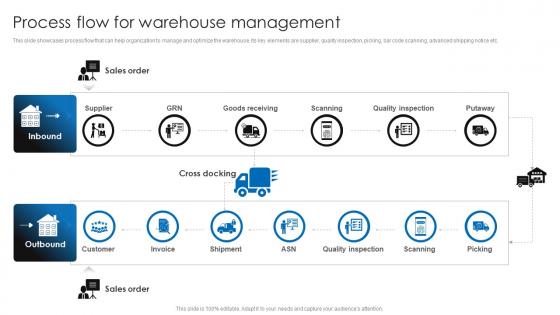
Process Flow For Warehouse Management Retail Stock Administration Strategies Topics Pdf
This slide showcases process flow that can help organization to manage and optimize the warehouse. Its key elements are supplier, quality inspection, picking, bar code scanning, advanced shipping notice etc.There are so many reasons you need a Process Flow For Warehouse Management Retail Stock Administration Strategies Topics Pdf. The first reason is you can not spend time making everything from scratch, Thus, Slidegeeks has made presentation templates for you too. You can easily download these templates from our website easily.
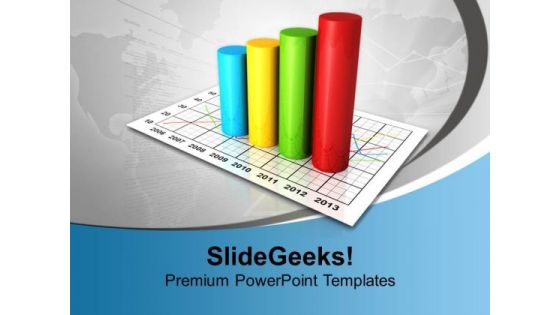
Graph Growth Business PowerPoint Templates And PowerPoint Themes 1012
Graph Growth Business PowerPoint Templates And PowerPoint Themes 1012-The PowerPoint Template shows the annual growth of business through bar graph. This template portrays the Business Concept. You can use this template to illustrate Global Issues. An excellent graphic to attract the attention of your audience to improve earnings. -Graph Growth Business PowerPoint Templates And PowerPoint Themes 1012-This PowerPoint template can be used for presentations relating to-Growth graph background, Marketing, Symbol, Business, Process and flows, Abstract
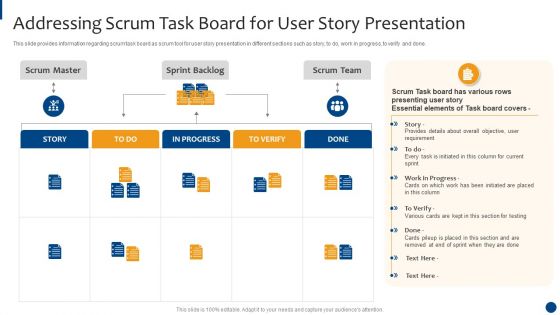
Scrum Master Approaches And Tools IT Addressing Scrum Task Board For User Story Presentation Background PDF
This slide provides information regarding scrum task board as scrum tool for user story presentation in different sections such as story, to do, work in progress, to verify and done. Deliver an awe inspiring pitch with this creative scrum master approaches and tools it addressing scrum task board for user story presentation background pdf bundle. Topics like scrum team, progress can be discussed with this completely editable template. It is available for immediate download depending on the needs and requirements of the user.
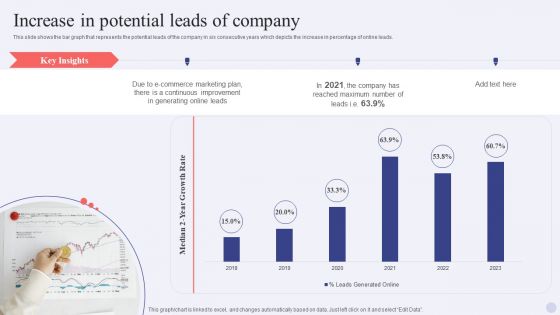
Electronic Commerce Systems Increase In Potential Leads Of Company Graphics PDF
This slide shows the bar graph that represents the potential leads of the company in six consecutive years which depicts the increase in percentage of online leads. Deliver an awe inspiring pitch with this creative Electronic Commerce Systems Increase In Potential Leads Of Company Graphics PDF bundle. Topics like E Commerce Marketing Plan, Generating Online Leads, Continuous Improvement can be discussed with this completely editable template. It is available for immediate download depending on the needs and requirements of the user.

Upward Arrow Graph Business PowerPoint Templates And PowerPoint Themes 0612
Upward Arrow Graph Business PowerPoint Templates And PowerPoint Themes Business-Microsoft Powerpoint Templates and Background with bars and red arrow
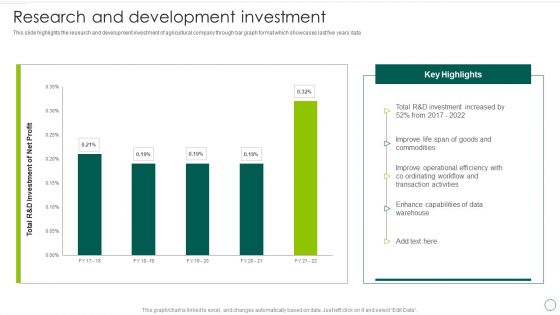
Food And Agro Company Outline Research And Development Investment Background PDF
This slide highlights the research and development investment of agricultural company through bar graph format which showcases last five years data. Deliver and pitch your topic in the best possible manner with this Food And Agro Company Outline Research And Development Investment Background PDF. Use them to share invaluable insights on Total R AND D Investment, Net Profit, 2017 TO 2022, Improve Operational Efficiency and impress your audience. This template can be altered and modified as per your expectations. So, grab it now.
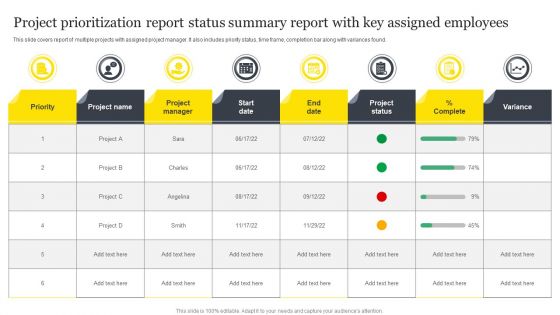
Project Prioritization Report Status Summary Report With Key Assigned Employees Elements PDF
This slide covers report of multiple projects with assigned project manager. It also includes priority status, time frame, completion bar along with variances found. Pitch your topic with ease and precision using this Project Prioritization Report Status Summary Report With Key Assigned Employees Elements PDF. This layout presents information on Priority, Project Manager, Project Status. It is also available for immediate download and adjustment. So, changes can be made in the color, design, graphics or any other component to create a unique layout.

Growth Graph Moving Up PowerPoint Templates And PowerPoint Themes 1012
Growth Graph Moving Up PowerPoint Templates And PowerPoint Themes 1012-This PowerPoint Template shows the Bar Graph with increasing percentage which signifies the Financial Growth. The Template signifies the concept of Team Work, Team Leader etc. The structure of our templates allows you to effectively highlight the key issues concerning the growth of your business.-Growth Graph Moving Up PowerPoint Templates And PowerPoint Themes 1012-This PowerPoint template can be used for presentations relating to-Business graph with rising arrow, success, business, arrows, marketing, finance
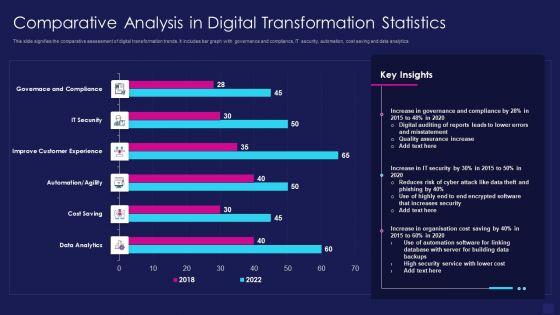
Comparative Analysis In Digital Transformation Statistics Graphics PDF
This slide signifies the comparative assessment of digital transformation trends. It includes bar graph with governance and compliance, IT security, automation, cost saving and data analytics. Showcasing this set of slides titled comparative analysis in digital transformation statistics graphics pdf. The topics addressed in these templates are data analytics, cost saving, improve customer experience. All the content presented in this PPT design is completely editable. Download it and make adjustments in color, background, font etc. as per your unique business setting.
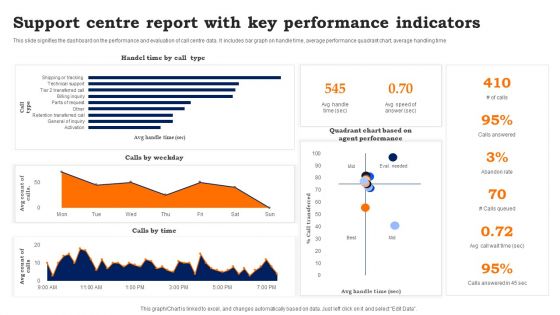
Support Centre Report With Key Performance Indicators Information PDF
This slide signifies the dashboard on the performance and evaluation of call centre data. It includes bar graph on handle time, average performance quadrant chart, average handling time. Showcasing this set of slides titled Support Centre Report With Key Performance Indicators Information PDF. The topics addressed in these templates are Support Centre Report, Key Performance Indicators. All the content presented in this PPT design is completely editable. Download it and make adjustments in color, background, font etc. as per your unique business setting.
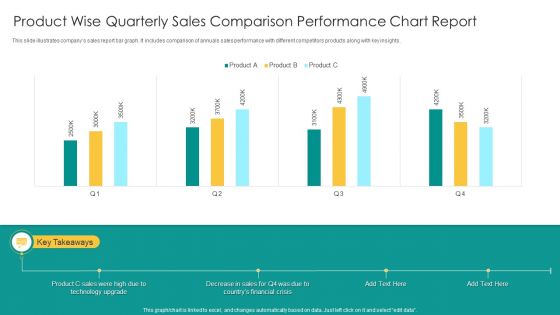
Product Wise Quarterly Sales Comparison Performance Chart Report Infographics PDF
This slide illustrates companys sales report bar graph. It includes comparison of annuals sales performance with different competitors products along with key insights. Showcasing this set of slides titled Product Wise Quarterly Sales Comparison Performance Chart Report Infographics PDF. The topics addressed in these templates are Product C Sales, Technology Upgrade, Financial Crisis. All the content presented in this PPT design is completely editable. Download it and make adjustments in color, background, font etc. as per your unique business setting.
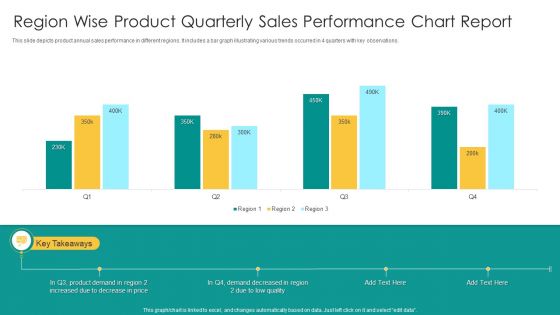
Region Wise Product Quarterly Sales Performance Chart Report Topics PDF
This slide depicts product annual sales performance in different regions. It includes a bar graph illustrating various trends occurred in 4 quarters with key observations. Showcasing this set of slides titled Region Wise Product Quarterly Sales Performance Chart Report Topics PDF. The topics addressed in these templates are Product Demand, Price, Low Quality. All the content presented in this PPT design is completely editable. Download it and make adjustments in color, background, font etc. as per your unique business setting.

Product Kick Off Strategy Sales Performance Over Last Three Years Formats PDF
This slide shows bar graph that demonstrating sales performance of top products over last three years along with region wise sales data. Deliver an awe inspiring pitch with this creative product kick off strategy sales performance over last three years formats pdf bundle. Topics like sales performance over last three years can be discussed with this completely editable template. It is available for immediate download depending on the needs and requirements of the user.

Go To Market Strategy For New Product Sales Performance Over Last Three Years Guidelines PDF
This slide shows bar graph that demonstrating sales performance of top products over last three years along with region wise sales data. Deliver an awe inspiring pitch with this creative go to market strategy for new product sales performance over last three years guidelines pdf bundle. Topics like sales performance over last three years can be discussed with this completely editable template. It is available for immediate download depending on the needs and requirements of the user.
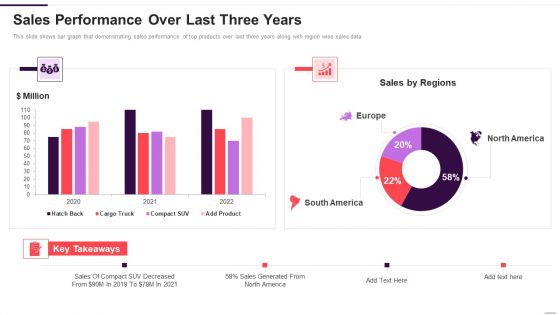
Implementation Plan For New Product Launch Sales Performance Over Last Three Years Guidelines PDF
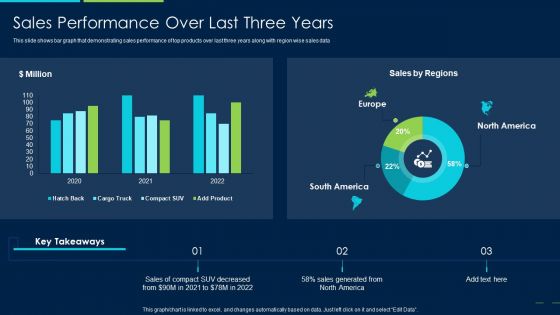
Marketing Strategy New Product Introduction Sales Performance Over Last Three Years Slides PDF
This slide shows bar graph that demonstrating sales performance of top products over last three years along with region wise sales data Deliver and pitch your topic in the best possible manner with this marketing strategy new product introduction sales performance over last three years slides pdf. Use them to share invaluable insights on sales performance over last three years and impress your audience. This template can be altered and modified as per your expectations. So, grab it now.

Approaches For New Product Release Sales Performance Over Last Three Years Graphics PDF
This slide shows bar graph that demonstrating sales performance of top products over last three years along with region wise sales data Deliver an awe inspiring pitch with this creative approaches for new product release sales performance over last three years graphics pdf bundle. Topics like sales performance over last three years can be discussed with this completely editable template. It is available for immediate download depending on the needs and requirements of the user.
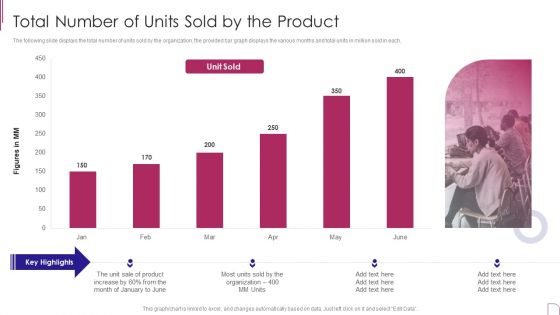
Yearly Product Performance Assessment Repor Total Number Of Units Sold By The Product Guidelines PDF
The following slide displays the total number of units sold by the organization, the provided bar graph displays the various months and total units in million sold in each.Deliver an awe inspiring pitch with this creative Yearly Product Performance Assessment Repor Total Number Of Units Sold By The Product Guidelines PDF bundle. Topics like Total Number, Units Sold, Product can be discussed with this completely editable template. It is available for immediate download depending on the needs and requirements of the user.
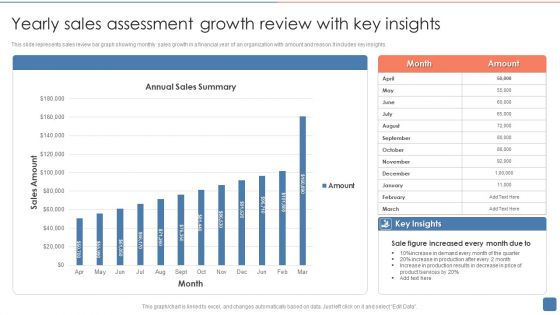
Yearly Sales Assessment Growth Review With Key Insights Infographics PDF
This slide represents sales review bar graph showing monthly sales growth in a financial year of an organization with amount and reason.It includes key insights. Showcasing this set of slides titled Yearly Sales Assessment Growth Review With Key Insights Infographics PDF. The topics addressed in these templates are Sale Figure, Demand, Services. All the content presented in this PPT design is completely editable. Download it and make adjustments in color, background, font etc. as per your unique business setting.

Business Graph Up PowerPoint Templates And PowerPoint Themes 1012
Business Graph Up PowerPoint Templates And PowerPoint Themes 1012-This PowerPoint Template shows the Bar Graph with increasing percentage which signifies the Financial Growth. The Template signifies the concept of Team Work, Team Leader etc. The structure of our templates allows you to effectively highlight the key issues concerning the growth of your business.-Business Graph Up PowerPoint Templates And PowerPoint Themes 1012-This PowerPoint template can be used for presentations relating to-Business graph, success, arrows, business, signs, shapes

Arrow Graph Business Success PowerPoint Templates And PowerPoint Themes 0712
Arrow Graph Business Success PowerPoint Templates And PowerPoint Themes 0712-Microsoft Powerpoint Templates and Background with bars and arrow
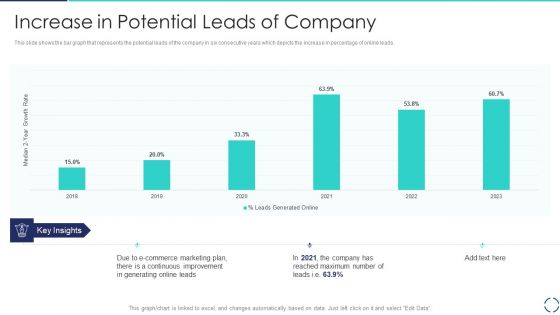
Optimizing E Business Promotion Plan Increase In Potential Leads Of Company Background PDF
This slide shows the bar graph that represents the potential leads of the company in six consecutive years which depicts the increase in percentage of online leads. Deliver an awe inspiring pitch with this creative Optimizing E Business Promotion Plan Increase In Potential Leads Of Company Background PDF bundle. Topics like Company, Increase Potential can be discussed with this completely editable template. It is available for immediate download depending on the needs and requirements of the user.

 Home
Home