Progress Bar

Projected Sales Volume Ppt PowerPoint Presentation Pictures
This is a projected sales volume ppt powerpoint presentation pictures. This is a five stage process. The stages in this process are business, strategy, marketing, analysis, liner process, bar graph.

Combo Chart Ppt PowerPoint Presentation File Visual Aids
This is a combo chart ppt powerpoint presentation file visual aids. This is a two stage process. The stages in this process are bar graph, business, marketing, finance, planning.

Clustered Column Line Ppt PowerPoint Presentation Inspiration Visual Aids
This is a clustered column line ppt powerpoint presentation inspiration visual aids. This is a four stage process. The stages in this process are business, marketing, strategy, planning, bar chart.

Combo Chart Ppt PowerPoint Presentation Inspiration Background
This is a combo chart ppt powerpoint presentation inspiration background. This is a three stage process. The stages in this process are product, bar graph, market size, growth, growth rate.

Combo Chart Ppt PowerPoint Presentation Show Deck
This is a combo chart ppt powerpoint presentation show deck. This is a three stage process. The stages in this process are growth rate, market size, product, bar graph, growth.

Stacked Area Clustered Column Ppt PowerPoint Presentation Show Guidelines
This is a stacked area clustered column ppt powerpoint presentation show guidelines. This is a four stage process. The stages in this process are in percentage, product, bar graph, growth, success.

Combo Chart Ppt PowerPoint Presentation Summary Slides
This is a combo chart ppt powerpoint presentation summary slides. This is a three stage process. The stages in this process are market size, product, growth rate, bar graph, success.

Stacked Area Clustered Column Ppt PowerPoint Presentation Summary Professional
This is a stacked area clustered column ppt powerpoint presentation summary professional. This is a three stage process. The stages in this process are product, bar graph, growth, success, in percentage.

Column Chart Ppt PowerPoint Presentation Layouts Tips
This is a column chart ppt powerpoint presentation layouts tips. This is a six stage process. The stages in this process are sales in percentage, financial year, bar graph, growth, success.

Combo Chart Ppt PowerPoint Presentation Inspiration Slide Portrait
This is a combo chart ppt powerpoint presentation inspiration slide portrait. This is a three stage process. The stages in this process are product, market size, bar chart, growth, success.

Clustered Column Line Ppt PowerPoint Presentation Pictures Example
This is a clustered column line ppt powerpoint presentation pictures example. This is a three stage process. The stages in this process are product, in percentage, bar graph, growth, success.

Column Chart Ppt PowerPoint Presentation Portfolio Slide Download
This is a column chart ppt powerpoint presentation portfolio slide download. This is a two stage process. The stages in this process are product, year, bar graph, success, business.

Competitor Revenue And Profit Template 1 Ppt PowerPoint Presentation Infographic Template Designs Download
This is a competitor revenue and profit template 1 ppt powerpoint presentation infographic template designs download. This is a five stage process. The stages in this process are revenue, profit, competitor, bar graph, growth.

Combo Chart Ppt PowerPoint Presentation Slides Show
This is a combo chart ppt powerpoint presentation slides show. This is a three stage process. The stages in this process are combo chart, market size, product, bar graph, growth.

Column Chart Ppt PowerPoint Presentation Gallery Slide Portrait
This is a column chart ppt powerpoint presentation gallery slide portrait. This is a two stage process. The stages in this process are sales in percentage, financial year, product, bar graph, growth.
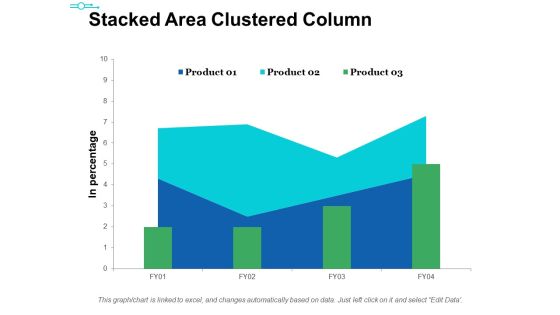
Stacked Area Clustered Column Ppt PowerPoint Presentation Ideas Themes
This is a stacked area clustered column ppt powerpoint presentation ideas themes. This is a three stage process. The stages in this process are product, in percentage, bar graph, area chart, growth.

Column Chart Ppt PowerPoint Presentation Icon Show
This is a column chart ppt powerpoint presentation icon show. This is a two stage process. The stages in this process are column chart, product, years, bar graph, growth.
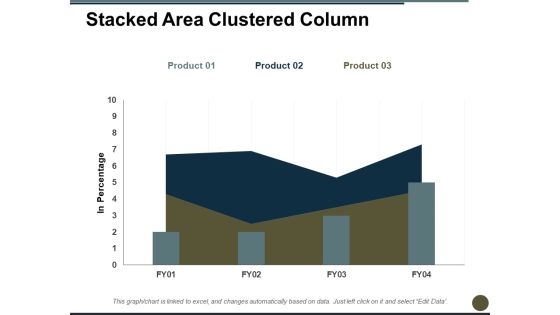
Stacked Area Clustered Column Ppt PowerPoint Presentation Professional Graphics
This is a stacked area clustered column ppt powerpoint presentation professional graphics. This is a three stage process. The stages in this process are in percentage, bar chart, product, growth, year.

Column Chart Ppt PowerPoint Presentation Model Graphics Download
This is a column chart ppt powerpoint presentation model graphics download. This is a two stage process. The stages in this process are product, financial year, sales in percentage, bar graph, success.
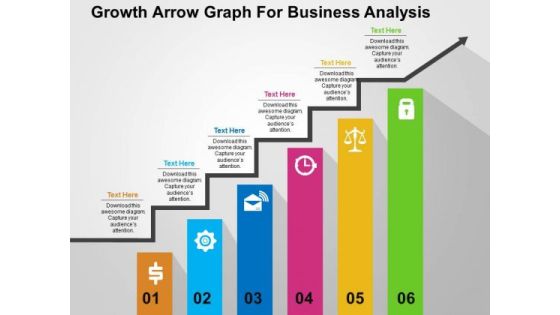
Growth Arrow Graph For Business Analysis PowerPoint Templates
Use this PowerPoint template containing growth arrow graph for business analysis. This PPT slide contains bar graph with icons. This slide is designed to attract the attention of your audience towards business plan evaluation.

Midstream Organic Growth Ppt PowerPoint Presentation Ideas Graphics Tutorials
This is a midstream organic growth ppt powerpoint presentation ideas graphics tutorials. This is a three stage process. The stages in this process are business, marketing, bar graph, management, financials.
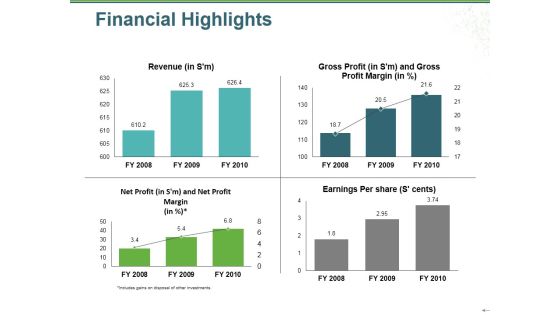
Financial Highlights Ppt PowerPoint Presentation Gallery Graphics Example
This is a financial highlights ppt powerpoint presentation gallery graphics example. This is a four stage process. The stages in this process are revenue, gross profit, net profit, earnings per share, bar graph.

Clustered Column Ppt PowerPoint Presentation Gallery Structure
This is a clustered column ppt powerpoint presentation gallery structure. This is a two stage process. The stages in this process are product, sales in percentage, financial year, bar graph, finance.

Clustered Column Line Ppt PowerPoint Presentation Professional
This is a clustered column line ppt powerpoint presentation professional. This is a three stage process. The stages in this process are clustered column line, product, bar graph, marketing, finance.
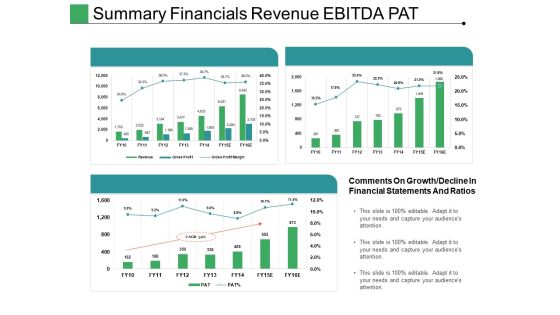
Summary Financials Revenue Ebitda Pat Ppt PowerPoint Presentation Ideas Tips
This is a summary financials revenue ebitda pat ppt powerpoint presentation ideas tips. This is a three stage process. The stages in this process are comments on growth, bar graph, growth, success, business.
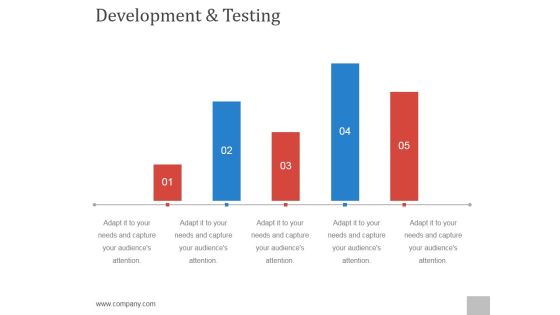
Development And Testing Ppt PowerPoint Presentation Background Designs
This is a development and testing ppt powerpoint presentation background designs. This is a five stage process. The stages in this process are step, business, growth, success, bar graph.

Pitch Deck For Entrepreneurs Raising Money For A New Business Ppt PowerPoint Presentation Complete Deck With Slides
This is a pitch deck for entrepreneurs raising money for a new business ppt powerpoint presentation complete deck with slides. This is a one stage process. The stages in this process are business, growth strategy, marketing, management, bar graph.

Data Analytics Ppt PowerPoint Presentation Icon Master Slide
This is a data analytics ppt powerpoint presentation icon master slide. This is a five stage process. The stages in this process are bar graph, growth, success, business, marketing.

Competitors Average Price Product Ppt PowerPoint Presentation Layouts Infographic Template
This is a competitors average price product ppt powerpoint presentation layouts infographic template. This is a five stage process. The stages in this process are company, bar graph, success, growth, business.

Scatter Chart Ppt PowerPoint Presentation Microsoft
This is a scatter chart ppt powerpoint presentation microsoft. This is a one stage process. The stages in this process are x values, scatter chart, bar graph, growth, business.

Line Chart Ppt PowerPoint Presentation Ideas Example
This is a line chart ppt powerpoint presentation ideas example. This is a two stage process. The stages in this process are sales in percentage, bar graph, business, marketing, growth.

Area Chart Ppt PowerPoint Presentation Summary Templates
This is a area chart ppt powerpoint presentation summary templates. This is a two stage process. The stages in this process are product, in percentage, bar graph, growth, business.

Profit After Tax Pat Ppt PowerPoint Presentation Inspiration Slide
This is a profit after tax pat ppt powerpoint presentation inspiration slide. This is a five stage process. The stages in this process are bar graph, business, marketing, growth, management.
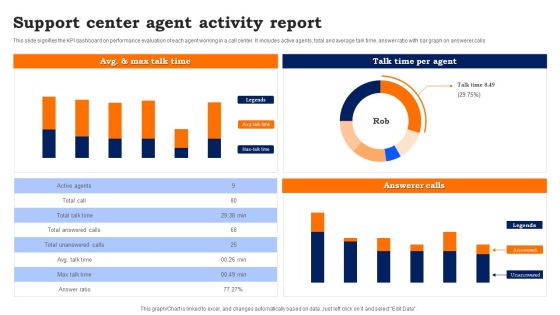
Support Center Agent Activity Report Guidelines PDF
This slide signifies the KPI dashboard on performance evaluation of each agent working in a call center. It includes active agents, total and average talk time, answer ratio with bar graph on answerer calls.
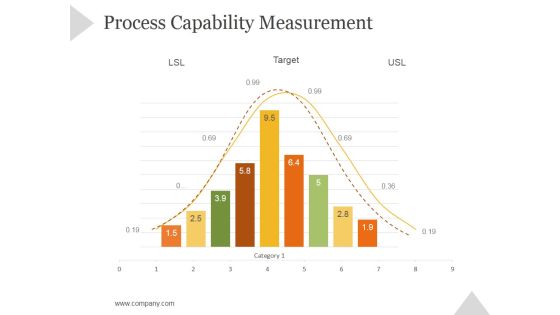
Process Capability Measurement Ppt PowerPoint Presentation Rules
This is a process capability measurement ppt powerpoint presentation rules. This is a nine stage process. The stages in this process are business, strategy, marketing, success, bar graph, growth strategy.
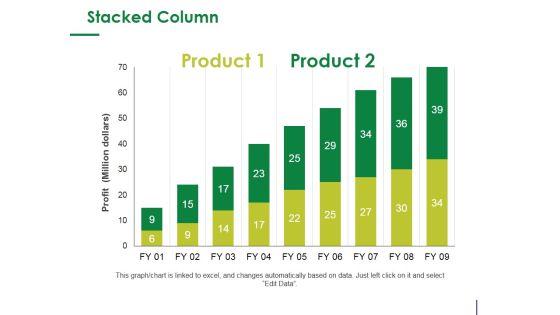
Stacked Column Ppt PowerPoint Presentation Infographic Template Design Ideas
This is a stacked column ppt powerpoint presentation infographic template design ideas. This is a two stage process. The stages in this process are product, profit, bar graph, growth, success.

Column Chart Ppt PowerPoint Presentation Slides Visual Aids
This is a column chart ppt powerpoint presentation slides visual aids. This is a six stage process. The stages in this process are bar graph, growth, success, sales in percentage, financial year.

Stacked Column Ppt PowerPoint Presentation Layouts Example
This is a stacked column ppt powerpoint presentation layouts example. This is a two stage process. The stages in this process are product, stacked column, bar graph, growth, success.

Clustered Column Line Ppt PowerPoint Presentation Infographic Template Pictures
This is a clustered column line ppt powerpoint presentation infographic template pictures. This is a three stage process. The stages in this process are product, in percentage, bar graph, growth, success.

Column Chart Ppt PowerPoint Presentation Pictures Graphic Images
This is a column chart ppt powerpoint presentation pictures graphic images. This is a two stage process. The stages in this process are product, years, growth, success, bar graph.

Combo Chart Ppt PowerPoint Presentation Pictures Summary
This is a combo chart ppt powerpoint presentation pictures summary. This is a three stage process. The stages in this process are product, market size, growth rate, bar graph, success.
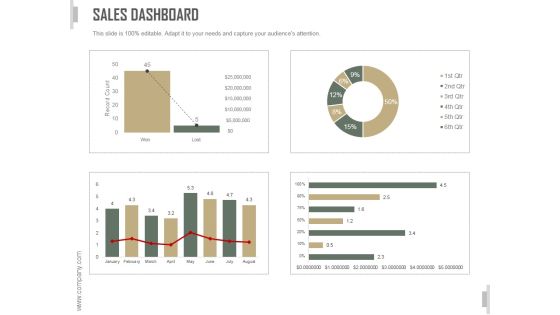
Sales Dashboard Slide Ppt PowerPoint Presentation Template
This is a sales dashboard slide ppt powerpoint presentation template. This is a three stage process. The stages in this process are business, strategy, marketing, analysis, bar graph, growth strategy.
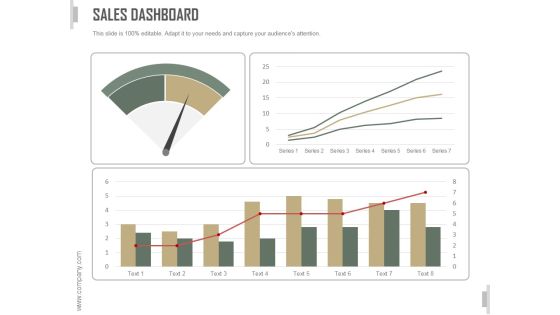
Sales Dashboard Ppt PowerPoint Presentation Design Templates
This is a sales dashboard ppt powerpoint presentation design templates. This is a four stage process. The stages in this process are business, strategy, marketing, analysis, bar graph, growth strategy.

0814 Bargraph Of Dollars Bundles With Arrow Graphic Image Graphics For PowerPoint
This unique image has backdrop of bar graph of dollars bundles with growth arrow. This image displays the concept of financial growth. Define the business growth with this suitable image. Use this image to make outstanding presentations

Combo Chart Ppt PowerPoint Presentation Shapes
This is a combo chart ppt powerpoint presentation shapes. This is a eight stage process. The stages in this process are combo chart, business, marketing, sales in percentage, bar graph.
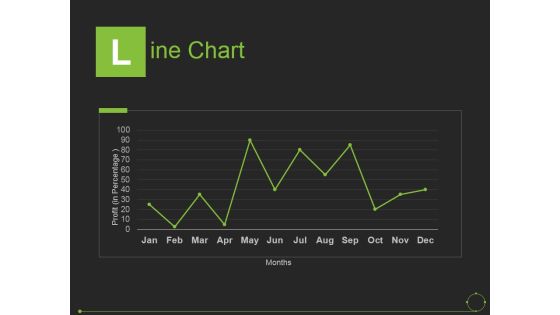
Line Chart Ppt PowerPoint Presentation File Graphics Tutorials
This is a line chart ppt powerpoint presentation file graphics tutorials. This is a one stage process. The stages in this process are months, line chart, bar graph, business, marketing.

Combo Chart Ppt PowerPoint Presentation Outline Background Image
This is a combo chart ppt powerpoint presentation outline background image. This is a four stage process. The stages in this process are combo chart, units sold, bar graph, business, marketing.
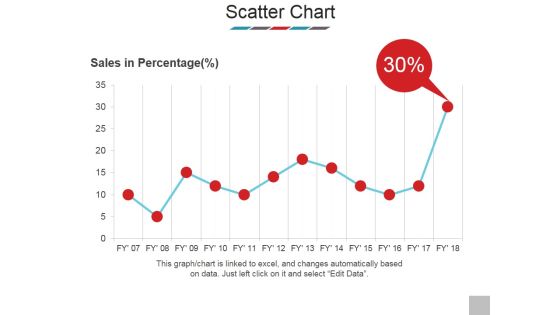
Scatter Chart Ppt PowerPoint Presentation Model Show
This is a scatter chart ppt powerpoint presentation model show. This is a one stage process. The stages in this process are sales in percentage, scatter chart, business, bar graph, marketing.

Competitor Analysis Competitor Revenue And Profit Graph Ppt PowerPoint Presentation Gallery Vector
This is a competitor analysis competitor revenue and profit graph ppt powerpoint presentation gallery vector. This is a five stage process. The stages in this process are bar graph, marketing, management, business, presentation.
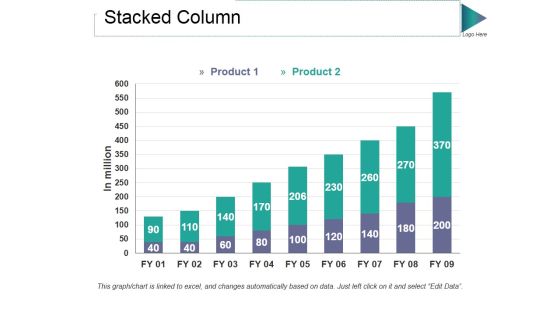
Stacked Column Ppt PowerPoint Presentation Styles Graphic Tips
This is a stacked column ppt powerpoint presentation styles graphic tips. This is a two stage process. The stages in this process are product, in million, bar graph, growth, success.

Budgeting Planned Actual Comparison Ppt PowerPoint Presentation Portfolio
This is a budgeting planned actual comparison ppt powerpoint presentation portfolio. This is a three stage process. The stages in this process are business, strategy, marketing, analysis, success, bar graph.

Competitor Revenue And Profit Ppt PowerPoint Presentation Layouts Vector
This is a competitor revenue and profit ppt powerpoint presentation layouts vector. This is a five stage process. The stages in this process are competitor, profit, revenue, bar graph, success.

High Low Close Chart Ppt PowerPoint Presentation Portfolio Topics
This is a high low close chart ppt powerpoint presentation portfolio topics. This is a three stage process. The stages in this process are product, market size, in years, success, bar graph.

Pareto Analysis Tamplate 2 Ppt PowerPoint Presentation Graphics
This is a pareto analysis tamplate 2 ppt powerpoint presentation graphics. This is a twelve stage process. The stages in this process are bar graph, finance, marketing, strategy, analysis, business.
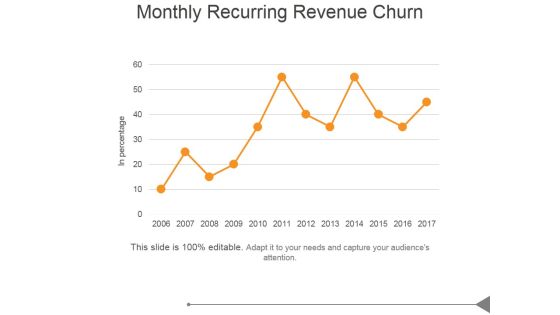
Monthly Recurring Revenue Churn Ppt PowerPoint Presentation Images
This is a monthly recurring revenue churn ppt powerpoint presentation images. This is a five stage process. The stages in this process are business, marketing, success, bar graph, growth.

Quarter Track Record Ppt PowerPoint Presentation File Clipart Images
This is a quarter track record ppt powerpoint presentation file clipart images. This is a two stage process. The stages in this process are bar graph, growth, success, business, marketing.

Clustered Column Ppt PowerPoint Presentation Pictures Graphics Template
This is a clustered column ppt powerpoint presentation pictures graphics template. This is a two stage process. The stages in this process are product, growth, success, business, bar graph.

Real Estate Home Price Index Ppt PowerPoint Presentation Example
This is a real estate home price index ppt powerpoint presentation example. This is a one stage process. The stages in this process are bar graph, business, marketing, success, management.
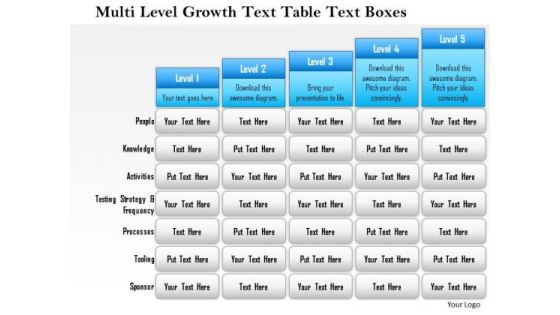
Business Framework Multi Level Growth Text Table Text Boxes 2 PowerPoint Presentation
Five staged text box style chart in bar graph design has been used to decorate this power point template slide. This diagram slide contains the multilevel growth concept. Use this PPT slide for financial growth and result analysis related topics.

Business Diagram Graph Of Sustainable Environment With Business Growth Presentation Template
This diagram displays bar graph with globes and growth arrow. This image depicts concepts of green environment and business growth .Use this diagram to present your views in a wonderful manner.

Combo Chart Ppt PowerPoint Presentation Show Influencers
This is a combo chart ppt powerpoint presentation show influencers. This is a three stage process. The stages in this process are product, bar graph, growth, growth rate, market size.

Crm Dashboard Deals By Expected Close Date Ppt PowerPoint Presentation Background Images
This is a crm dashboard deals by expected close date ppt powerpoint presentation background images. This is a five stage process. The stages in this process are bar graph, aug, sep, oct, growth.

Combo Chart Ppt PowerPoint Presentation Infographics Infographics
This is a combo chart ppt powerpoint presentation infographics infographics. This is a three stage process. The stages in this process are bar graph, growth, finance, marketing, strategy, business.

Crm Dashboard Deals By Expected Close Date Ppt PowerPoint Presentation Portfolio Icons
This is a crm dashboard deals by expected close date ppt powerpoint presentation portfolio icons. This is a three stage process. The stages in this process are bar graph, finance, marketing, strategy, business, analysis, growth.

Advertising Spent On Different Mediums Ppt PowerPoint Presentation Infographics Show
This is a advertising spent on different mediums ppt powerpoint presentation infographics show. This is a five stage process. The stages in this process are business, finance, marketing, strategy, bar graph, growth.
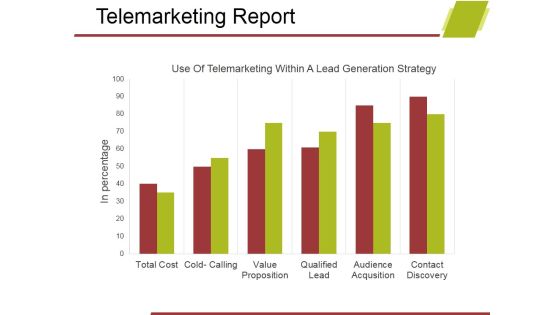
Telemarketing Report Template 1 Ppt PowerPoint Presentation Show Design Ideas
This is a telemarketing report template 1 ppt powerpoint presentation show design ideas. This is a six stage process. The stages in this process are business, bar graph, marketing, analysis, growth, strategy.
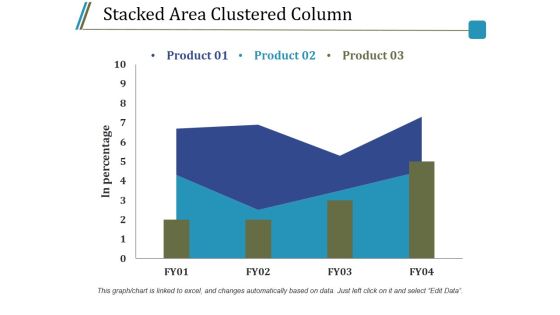
Stacked Area Clustered Column Ppt PowerPoint Presentation Model Guidelines
This is a stacked area clustered column ppt powerpoint presentation model guidelines. This is a three stage process. The stages in this process are product, in percentage, bar graph, growth, success.
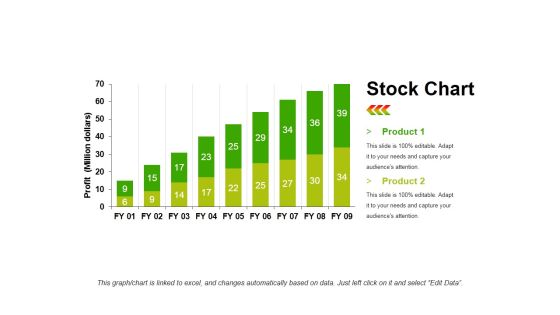
Stock Chart Template 1 Ppt PowerPoint Presentation Infographic Template Objects
This is a stock chart template 1 ppt powerpoint presentation infographic template objects. This is a two stage process. The stages in this process are product, profit, bar graph, growth, success.

Stacked Area Clustered Column Ppt PowerPoint Presentation File Background Designs
This is a stacked area clustered column ppt powerpoint presentation file background designs. This is a three stage process. The stages in this process are product, in percentage, growth, success, bar graph.

Clustered Column Line Ppt PowerPoint Presentation Icon Ideas
This is a clustered column line ppt powerpoint presentation icon ideas. This is a three stage process. The stages in this process are product, in percentage, bar graph, success, growth.

Clustered Column Template 1 Ppt PowerPoint Presentation Outline File Formats
This is a clustered column template 1 ppt powerpoint presentation outline file formats. This is a two stage process. The stages in this process are product, bar graph, success, growth, finance.

Clustered Column Template 2 Ppt PowerPoint Presentation Summary Smartart
This is a clustered column template 2 ppt powerpoint presentation summary smartart. This is a two stage process. The stages in this process are product, bar graph, in percentage, clustered column, growth.

Column Chart Ppt PowerPoint Presentation Infographics Deck
This is a column chart ppt powerpoint presentation infographics deck. This is a two stage process. The stages in this process are product, expenditure in, years, bar graph, growth.

Column Chart Ppt PowerPoint Presentation File Summary
This is a column chart ppt powerpoint presentation file summary. This is a two stage process. The stages in this process are product, dollars, in years, bar graph, growth.

Clustered Column Line Ppt PowerPoint Presentation Topics
This is a clustered column line ppt powerpoint presentation topics. This is a three stage process. The stages in this process are product, in percentage, growth, bar graph, business.

Clustered Column Ppt PowerPoint Presentation Icon Objects
This is a clustered column ppt powerpoint presentation icon objects. This is a two stage process. The stages in this process are clustered column, product, growth, finance, bar graph.

Global Communication For Business Growth PowerPoint Templates Ppt Backgrounds For Slides 0613
Raise the bar with our Globe Powerpoint Templates. They are programmed to take you to the next level. Our People Powerpoint Templates bring a lot to the table. Their alluring flavours will make your audience salivate.
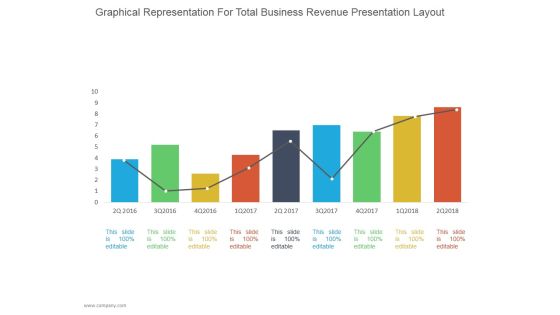
Graphical Representation For Total Business Revenue Ppt PowerPoint Presentation Diagrams
This is a graphical representation for total business revenue ppt powerpoint presentation diagrams. This is a nine stage process. The stages in this process are business, strategy, line chart, bar graph, marketing, management.

Cycle Time By Month Ppt PowerPoint Presentation Guidelines
This is a cycle time by month ppt powerpoint presentation guidelines. This is a twelve stage process. The stages in this process are business, strategy, marketing, process, arrow, finance, bar graph.

Column Chart Ppt PowerPoint Presentation Background Designs
This is a column chart ppt powerpoint presentation background designs. This is a two stage process. The stages in this process are bar graph, finance, marketing, strategy, analysis, business.

Crm Dashboard Current Lead Status Ppt PowerPoint Presentation Infographic Template Visual Aids
This is a crm dashboard current lead status ppt powerpoint presentation infographic template visual aids. This is a six stage process. The stages in this process are bar graph, finance, marketing, strategy, business, analysis.

Gap Between Current And Required Staff Ppt PowerPoint Presentation Infographic Template Microsoft
This is a gap between current and required staff ppt powerpoint presentation infographic template microsoft. This is a five stage process. The stages in this process are business, bar graph, finance, marketing, strategy, analysis.
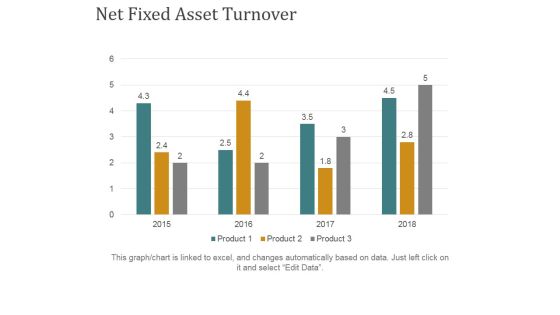
Net Fixed Asset Turnover Ppt PowerPoint Presentation Ideas Grid
This is a net fixed asset turnover ppt powerpoint presentation ideas grid. This is a four stage process. The stages in this process are business, finance, marketing, bar graph, strategy.

Competitor Analysis Graph Ppt PowerPoint Presentation Slides Elements
This is a competitor analysis graph ppt powerpoint presentation slides elements. This is a five stage process. The stages in this process are bar graph, finance, marketing, strategy, business.

Clustered Column Ppt PowerPoint Presentation File Slide
This is a clustered column ppt powerpoint presentation file slide. This is a two stage process. The stages in this process are product, financial year, sales in percentage, bar graph.

Clustered Column Ppt PowerPoint Presentation Slides Smartart
This is a clustered column ppt powerpoint presentation slides smartart. This is a two stage process. The stages in this process are product, sales in percentage, financial year, bar graph.
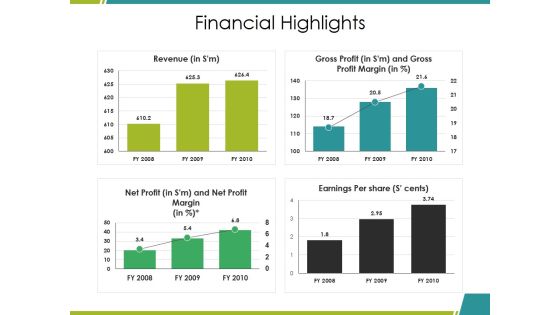
Financial Highlights Ppt PowerPoint Presentation Ideas Graphics Download
This is a financial highlights ppt powerpoint presentation ideas graphics download. This is a four stage process. The stages in this process are revenue, gross profit, net profit, earnings per share, bar graph.
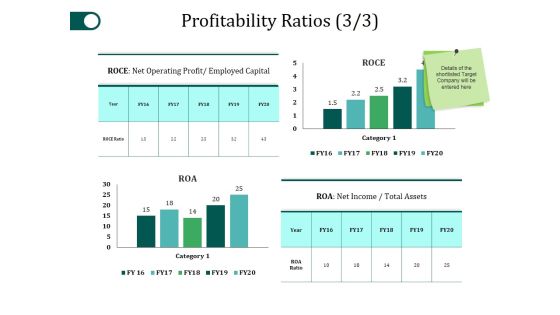
Profitability Ratios Template 3 Ppt PowerPoint Presentation Gallery Slide Portrait
This is a profitability ratios template 3 ppt powerpoint presentation gallery slide portrait. This is a four stage process. The stages in this process are category, roce, net income, business, bar graph.

Column Chart Ppt PowerPoint Presentation Layouts Graphics Example
This is a column chart ppt powerpoint presentation layouts graphics example. This is a two stage process. The stages in this process are product, year, bar graph, business, finance.

Competitor Revenue And Profit Ppt PowerPoint Presentation Model Templates
This is a competitor revenue and profit ppt powerpoint presentation model templates. This is a five stage process. The stages in this process are revenue, profit, competitor, bar graph, business.

Column Chart Ppt PowerPoint Presentation Infographics Guidelines
This is a column chart ppt powerpoint presentation infographics guidelines. This is a two stage process. The stages in this process are product, expenditure in, years, business, bar graph.

Column Chart Ppt PowerPoint Presentation Layouts Vector
This is a column chart ppt powerpoint presentation layouts vector. This is a two stage process. The stages in this process are product, column chart, bar graph, percentage, finance.

Stacked Area Clustered Column Ppt PowerPoint Presentation Gallery Gridlines
This is a stacked area clustered column ppt powerpoint presentation gallery gridlines. This is a three stage process. The stages in this process are bar graph, product, in percentage.

Stacked Area Clustered Column Ppt PowerPoint Presentation Summary Slides
This is a stacked area clustered column ppt powerpoint presentation summary slides. This is a three stage process. The stages in this process are product, in percentage, financial year, bar graph.
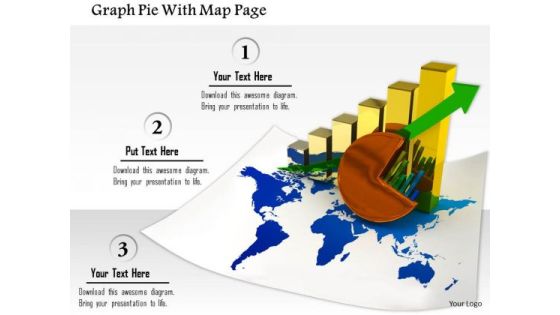
Stock Photo Graph Pie With Map Page PowerPoint Slide
This image slide contains business charts on world map. This image is designed with bar graph and pie chart on world map depicting global economy. Use this image slide to represent financial growth in any business presentation.
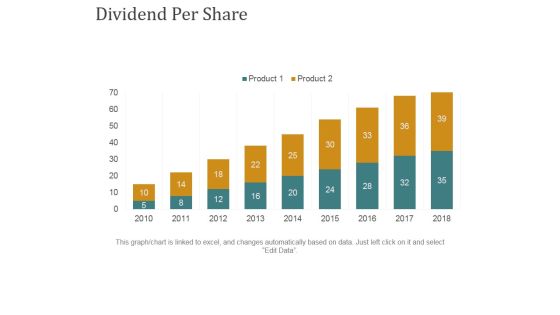
Dividend Per Share Ppt PowerPoint Presentation Summary Rules
This is a dividend per share ppt powerpoint presentation summary rules. This is a nine stage process. The stages in this process are business, bar graph, finance, marketing, strategy, growth.
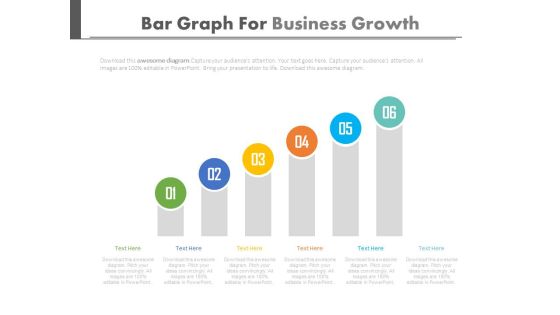
Setting Goals And Developing Strategies Powerpoint Slides
This PowerPoint template is useful for setting goals and developing strategies. This PPT background has a design of six steps bar graph. This PPT slide is suitable for topics like corporate strategic planning.
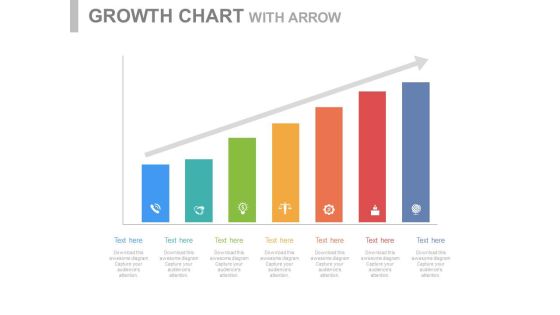
Steps For Developing Strategic Plan Powerpoint Slides
This PowerPoint template is useful for setting goals and developing strategies. This PPT background has a design of seven steps bar graph. This PPT slide is suitable for topics like corporate strategic planning.

Statistique Success Business PowerPoint Templates And PowerPoint Backgrounds 0811
Microsoft PowerPoint Template and Background with colorful bars and pie

Analysis Techniques Pareto Analysis Ppt PowerPoint Presentation Example
This is a analysis techniques pareto analysis ppt powerpoint presentation example. This is a ten stage process. The stages in this process are business, strategy, bar graph, line graph, process.

Comparison Of Prices Ppt PowerPoint Presentation Designs Download
This is a comparison of prices ppt powerpoint presentation designs download. This is a two stage process. The stages in this process are comparison of prices, marketing, in percentage, bar graph, business.

Portfolio Evaluation Ppt PowerPoint Presentation Infographics Objects
This is a portfolio evaluation ppt powerpoint presentation infographics objects. This is a two stage process. The stages in this process are business, finance, bar graph, pie chart, marketing, analysis, investment.

Financial Projection Graph Template 2 Ppt PowerPoint Presentation Infographic Template Gallery
This is a financial projection graph template 2 ppt powerpoint presentation infographic template gallery. This is a three stage process. The stages in this process are business, bar graph, finance, marketing, strategy, analysis.
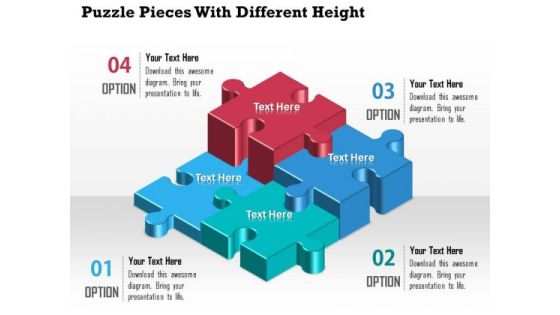
Business Diagram Puzzle Pieces With Different Height Presentation Template
A professional bar graph has been crafted with graphic of puzzles. All these puzzles are in different heights which shows the various levels of any data result representations. Use this diagram for your business result and data analysis related topics.
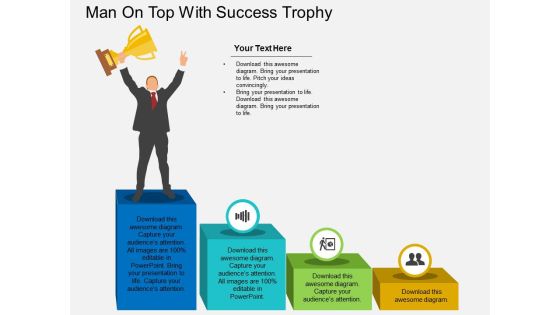
Man On Top With Success Trophy Powerpoint Template
This PowerPoint template has been designed with graphics man standing on top bar with trophy. This Professional may be used to display concept of win, success and strategy. Download this business slide to build impressive presentation.
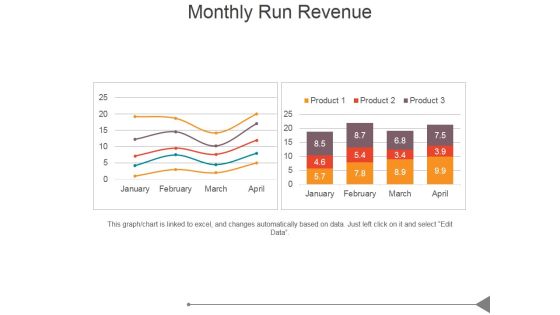
Monthly Run Revenue Ppt PowerPoint Presentation Design Ideas
This is a monthly run revenue ppt powerpoint presentation design ideas. This is a two stage process. The stages in this process are business, marketing, success, bar graph, growth.
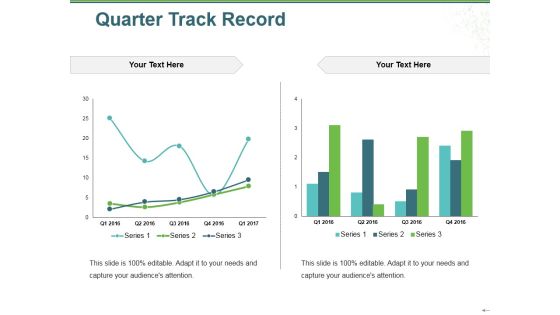
Quarter Track Record Ppt PowerPoint Presentation Gallery Images
This is a quarter track record ppt powerpoint presentation gallery images. This is a two stage process. The stages in this process are series, bar graph, growth, success, business.

Business Diagram Colored Graph For Business And Finance Data Analysis Presentation Template
This Power Point template has been designed with graphic of colored bar graph. Use this slide to represent five steps of any business process. Use this diagram for your business presentations and get exclusive comments on your efforts.
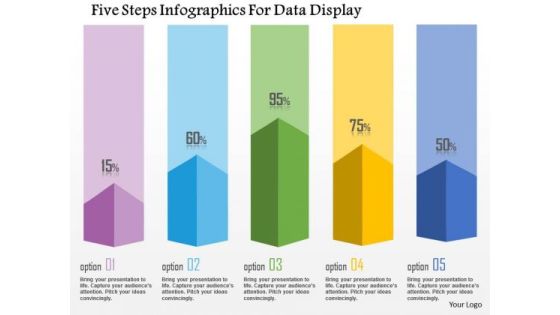
Business Diagram Five Steps Infographics For Data Display Presentation Template
This business diagram has been designed with graphic of five staged info graphics. This diagram can be used to display statistical information. Use this bar graph for your business and sales related presentations.

Show Your Creativity In Business PowerPoint Templates Ppt Backgrounds For Slides 0513
Raise The Bar With Our marketing Power Point Templates. They Are Programmed To Take You To The Next Level. Our spheres Power Point Templates Bring A Lot To The Table. Their Alluring Flavors Will Make Your Audience Salivate.

Business Diagram Four Steps With 3d Business Person Standing Over It PowerPoint Slide
This business diagram displays bar graph with business person standing on it. This Power Point template has been designed to display personal growth. You may use this diagram to impart professional appearance to your presentations.

Data Collection And Analysis Control Chart Ppt PowerPoint Presentation Example File
This is a data collection and analysis control chart ppt powerpoint presentation example file. This is a four stage process. The stages in this process are business, strategy, marketing, bar graph, growth strategy.

Clustered Column Line Ppt PowerPoint Presentation Slide
This is a clustered column line ppt powerpoint presentation slide. This is a three stage process. The stages in this process are bar graph, growth, finance, product, sales in percentage.

Competitors Average Price Product Ppt PowerPoint Presentation Inspiration Templates
This is a competitors average price product ppt powerpoint presentation inspiration templates. This is a five stage process. The stages in this process are business, finance, analysis, growth, investment, bar graph.

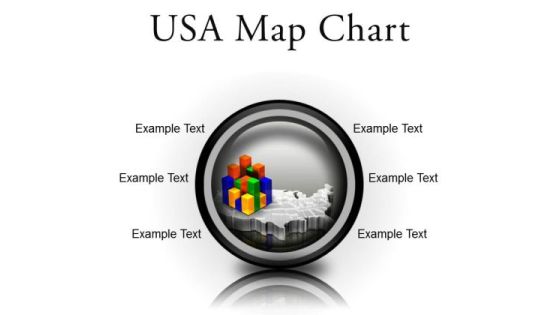
Usa Map Chart Americana PowerPoint Presentation Slides C
Microsoft PowerPoint Slides and Backgrounds with of a multicolored bar chart sitting on top of a transparent extruded map of the united states on a medium gray reflective surface
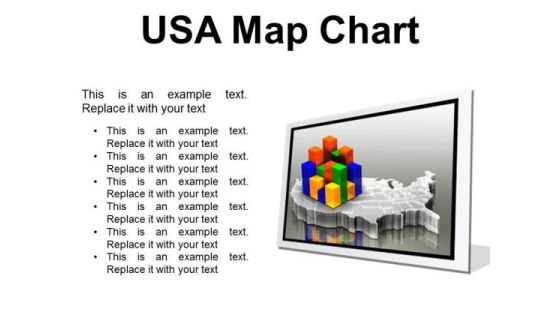
Usa Map Chart Americana PowerPoint Presentation Slides Cc
Microsoft PowerPoint Slides and Backgrounds with of a multicolored bar chart sitting on top of a transparent extruded map of the united states on a medium gray reflective surface
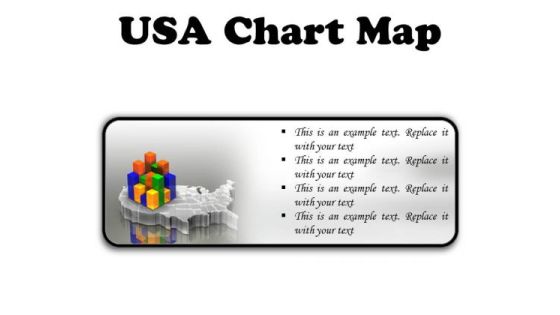
Usa Map Chart Americana PowerPoint Presentation Slides F
Microsoft PowerPoint Slides and Backgrounds with of a multicolored bar chart sitting on top of a transparent extruded map of the united states on a medium gray reflective surface
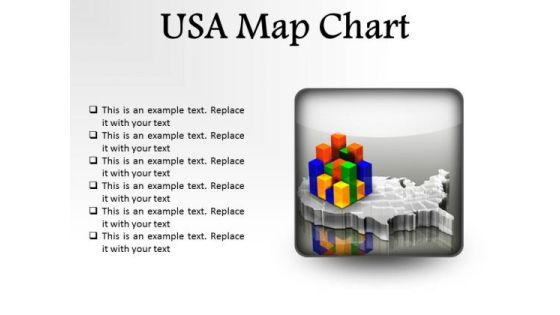
Usa Map Chart Americana PowerPoint Presentation Slides R
Microsoft PowerPoint Slides and Backgrounds with of a multicolored bar chart sitting on top of a transparent extruded map of the united states on a medium gray reflective surface
Usa Map Chart Americana PowerPoint Presentation Slides S
Microsoft PowerPoint Slides and Backgrounds with of a multicolored bar chart sitting on top of a transparent extruded map of the united states on a medium gray reflective surface

Fort With Light House PowerPoint Templates Ppt Backgrounds For Slides 0613
Raise the bar with our Nature Powerpoint Templates. They are programmed to take you to the next level. Our Environment Powerpoint Templates bring a lot to the table. Their alluring flavours will make your audience salivate.
 Home
Home