Progress Bar

Bar Graph Ppt PowerPoint Presentation Styles Picture
This is a bar graph ppt powerpoint presentation styles picture. This is a four stage process. The stages in this process are business, strategy, marketing, analysis, chart and graph, bar graph.

Bar Graph Ppt PowerPoint Presentation Summary Brochure
This is a bar graph ppt powerpoint presentation summary brochure. This is a four stage process. The stages in this process are business, market strategy, management, bar graph, product

Bar Graph Ppt PowerPoint Presentation Show Topics
This is a bar graph ppt powerpoint presentation show topics. This is a nine stage process. The stages in this process are business, finance, marketing, strategy, bar graph, growth.

Bar Chart Ppt PowerPoint Presentation Icon Information
This is a bar chart ppt powerpoint presentation icon information. This is a one stage process. The stages in this process are product, sales in percentage, financial years, bar graph, growth.

Bar Chart Ppt PowerPoint Presentation Background Designs
This is a bar chart ppt powerpoint presentation background designs. This is a twelve stage process. The stages in this process are bar graph, finance, marketing, strategy, analysis, investment.

Bar Graph Ppt PowerPoint Presentation Portfolio Outline
This is a bar graph ppt powerpoint presentation portfolio outline. This is a three stage process. The stages in this process are bar graph, finance, marketing, strategy, investment, business.

Bar Graph Ppt PowerPoint Presentation Pictures Tips
This is a bar graph ppt powerpoint presentation pictures tips. This is a five stage process. The stages in this process are bar graph, finance, marketing, strategy, analysis, business.

Bar Chart Ppt PowerPoint Presentation Icon Diagrams
This is a bar chart ppt powerpoint presentation icon diagrams. This is a two stage process. The stages in this process are bar chart, finance, analysis, business, marketing, strategy.

Performance Analysis Bar Graph Powerpoint Shapes
This is a performance analysis bar graph powerpoint shapes. This is a four stage process. The stages in this process are growth, finance, strategy, management, marketing.

Bar Graph Ppt PowerPoint Presentation Styles Model
This is a bar graph ppt powerpoint presentation styles model. This is a four stage process. The stages in this process are bar graph, finance, marketing, analysis, investment, business.

Bar Chart Ppt PowerPoint Presentation Outline Infographics
This is a bar chart ppt powerpoint presentation outline infographics. This is a two stage process. The stages in this process are bar chart, finance, marketing, strategy, analysis, business.

Bar Graph Ppt PowerPoint Presentation File Slides
This is a bar graph ppt powerpoint presentation file slides. This is a three stage process. The stages in this process are product, sales in percentage, bar graph, growth, success.

Bar Chart Ppt PowerPoint Presentation Styles Smartart
This is a bar chart ppt powerpoint presentation styles smartart. This is a two stage process. The stages in this process are bar chart, growth, finance, marketing, strategy, analysis.

Bar Graph Ppt PowerPoint Presentation Inspiration
This is a bar graph ppt powerpoint presentation inspiration. This is a five stage process. The stages in this process are bar graph, finance, marketing, strategy, investment, analysis, business, success.

Bar Graph Ppt PowerPoint Presentation Images
This is a bar graph ppt powerpoint presentation images. This is a four stage process. The stages in this process are business, strategy, marketing, analysis, success, growth.

Bar Graph Ppt PowerPoint Presentation Design Templates
This is a bar graph ppt powerpoint presentation design templates. This is a four stage process. The stages in this process are business, marketing, success, growth, years.

Bar Graph Ppt PowerPoint Presentation Tips
This is a bar graph ppt powerpoint presentation tips. This is a four stage process. The stages in this process are business, strategy, analysis, success, growth strategy, stair.

Bar Graph Ppt PowerPoint Presentation Gallery Outline
This is a bar graph ppt powerpoint presentation gallery outline. This is a five stage process. The stages in this process are business, marketing, strategy, growth, success.

Bar Graph Ppt PowerPoint Presentation Slide Download
This is a bar graph ppt powerpoint presentation slide download. This is a five stage process. The stages in this process are arrow, business, bargraph, growth, success.

Bar Graph Ppt PowerPoint Presentation Background Designs
This is a bar graph ppt powerpoint presentation background designs. This is a three stage process. The stages in this process are series, graph, growth, success, business.

Bar Graph Ppt PowerPoint Presentation Deck
This is a bar graph ppt powerpoint presentation deck. This is a five stage process. The stages in this process are percentage, process, strategy, success, marketing.

Bar Graph Ppt PowerPoint Presentation Clipart
This is a bar graph ppt powerpoint presentation clipart. This is a four stage process. The stages in this process are silhouettes, business, success, growth, stair.

Bar Graph Ppt PowerPoint Presentation Diagrams
This is a bar graph ppt powerpoint presentation diagrams. This is a nine stage process. The stages in this process are business, marketing, success, management, growth.

Product Development Analysis Bar Graph Powerpoint Themes
This is a product development analysis bar graph powerpoint themes. This is a five stage process. The stages in this process are business, growth, strategy, management, pretention.

Bar Chart Ppt PowerPoint Presentation Inspiration
This is a bar chart ppt powerpoint presentation inspiration. This is a nine stage process. The stages in this process are business, strategy, analysis, marketing, growth strategy.

Bar Chart Ppt PowerPoint Presentation Show Show
This is a bar chart ppt powerpoint presentation show show. This is a nine stage process. The stages in this process are business, marketing, chart, growth.

Bar Graph Ppt PowerPoint Presentation Outline Influencers
This is a bar graph ppt powerpoint presentation outline influencers. This is a four stage process. The stages in this process are business, marketing, management, growth.

Bar Chart Ppt PowerPoint Presentation File Skills
This is a bar chart ppt powerpoint presentation file skills. This is a nine stage process. The stages in this process are business, marketing, growth, finance, management.

Bar Graph Ppt PowerPoint Presentation Model Images
This is a bar graph ppt powerpoint presentation model images. This is a four stage process. The stages in this process are business, marketing, finance, growth, management.

Bar Graph Ppt PowerPoint Presentation Inspiration Microsoft
This is a bar graph ppt powerpoint presentation inspiration microsoft. This is a five stage process. The stages in this process are business, marketing, graph, management, growth.

Bar Graph Ppt PowerPoint Presentation Pictures Templates
This is a bar graph ppt powerpoint presentation pictures templates. This is a one stage process. The stages in this process are business, marketing, graph, management, growth.

Bar Graph Ppt PowerPoint Presentation Summary Inspiration
This is a bar graph ppt powerpoint presentation summary inspiration. This is a four stage process. The stages in this process are graph, business, marketing, growth, years.

Bar Graph Ppt PowerPoint Presentation Files
This is a bar graph ppt powerpoint presentation files. This is a five stage process. The stages in this process are business, graph, growth, success, management.

Bar Graph Ppt PowerPoint Presentation Ideas Topics
This is a bar graph ppt powerpoint presentation ideas topics. This is a six stage process. The stages in this process are graph, business, growth, success, marketing.

Bar Diagram Ppt PowerPoint Presentation Pictures Designs
This is a bar diagram ppt powerpoint presentation pictures designs. This is a five stage process. The stages in this process are business, marketing, growth, graph, success.

Bar Graph Ppt PowerPoint Presentation File Demonstration
This is a bar graph ppt powerpoint presentation file demonstration. This is a four stage process. The stages in this process are graph, year, success, growth, business.

Bar Chart Ppt PowerPoint Presentation Styles
This is a bar chart ppt powerpoint presentation styles. This is a nine stage process. The stages in this process are business, management, sales in percentage, growth.

Bar Graph Ppt PowerPoint Presentation Topics
This is a bar graph ppt powerpoint presentation topics. This is a five stage process. The stages in this process are business, strategy, icons, management.

Bar Graph Ppt PowerPoint Presentation Example
This is a bar graph ppt powerpoint presentation example. This is a five stage process. The stages in this process are graph, growth, icons, strategy, success.

Bar Graph Ppt PowerPoint Presentation Pictures Display
This is a bar graph ppt powerpoint presentation pictures display. This is a one stage process. The stages in this process are sales in percentage, financial year.

Bar Graph Ppt PowerPoint Presentation Outline Backgrounds
This is a bar graph ppt powerpoint presentation outline backgrounds. This is a five stage process. The stages in this process are planning, marketing, business, management, strategy.

Bar Graph Ppt Powerpoint Presentation Slides Example
This is a bar graph ppt powerpoint presentation slides example. This is a five stage process. The stages in this process are graph, business, marketing, finance.
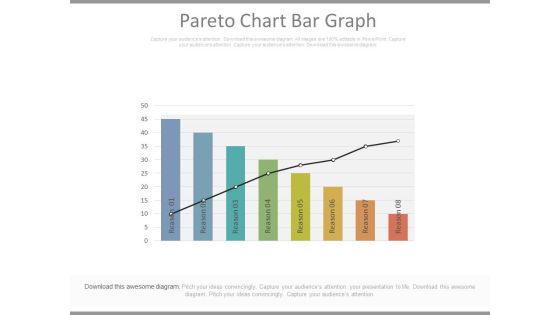
Pareto Chart Bar Graph Ppt Slides
This is a pareto chart bar graph ppt slides. This is a eight stage process. The stages in this process are business, marketing, success.\n
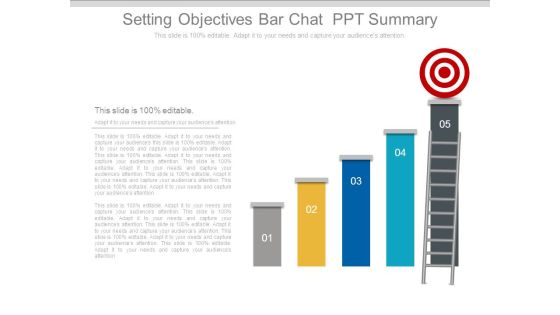
Setting Objectives Bar Chat Ppt Summary
This is a setting objectives bar chat ppt summary. This is a five stage process. The stages in this process are business, success, target, stair, growth, strategy, management.
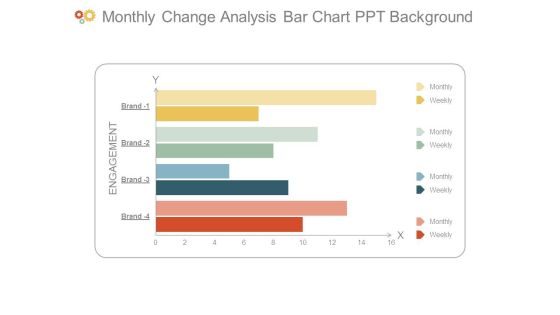
Monthly Change Analysis Bar Chart Ppt Background
This is a monthly change analysis bar chart ppt background. This is a four stage process. The stages in this process are engagement, monthly, weekly, brand.
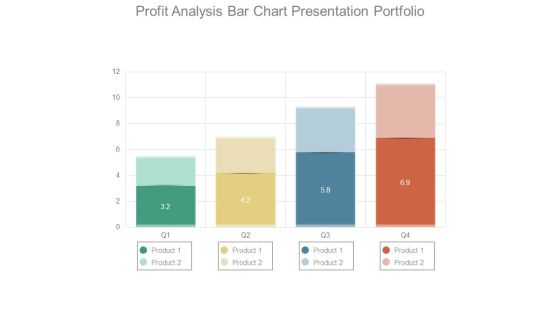
Profit Analysis Bar Chart Presentation Portfolio
This is a profit analysis bar chart presentation portfolio. This is a four stage process. The stages in this process are product.

Bar Chart For Data Analytics Ppt Examples
This is a bar chart for data analytics ppt examples. This is a five stage process. The stages in this process are category.

Data Analytics Bar Chart Ppt Sample Presentations
This is a data analytics bar chart ppt sample presentations. This is a five stage process. The stages in this process are category.

Clustered Bar Ppt PowerPoint Presentation File Inspiration
This is a clustered bar ppt powerpoint presentation file inspiration. This is a two stage process. The stages in this process are product, profit, growth, success, graph.

Bar Graph Ppt PowerPoint Presentation Backgrounds
This is a bar graph ppt powerpoint presentation backgrounds. This is a four stage process. The stages in this process are business, marketing, finance, growth, management.

Bar Graph Ppt PowerPoint Presentation Templates
This is a bar graph ppt powerpoint presentation templates. This is a four stage process. The stages in this process are arrows, business, marketing, strategy, growth, graphic.

Bar Graph Ppt PowerPoint Presentation Layout
This is a bar graph ppt powerpoint presentation layout. This is a three stage process. The stages in this process are business, marketing, management, analysis, growth.

Bar Graph Ppt PowerPoint Presentation Outline Slides
This is a bar graph ppt powerpoint presentation outline slides. This is a three stage process. The stages in this process are business, marketing, management, analysis, growth.

Bar Graph Ppt PowerPoint Presentation Ideas Professional
This is a bar graph ppt powerpoint presentation ideas professional. This is a five stage process. The stages in this process are business, marketing, growth, planning, process.

Bar Graph Ppt PowerPoint Presentation Gallery Maker
This is a bar graph ppt powerpoint presentation gallery maker. This is a six stage process. The stages in this process are business, marketing, growth, planning, management.

Bar Graph Ppt PowerPoint Presentation Portfolio Vector
This is a bar graph ppt powerpoint presentation portfolio vector. This is a nine stage process. The stages in this process are business, marketing, graph, finance, growth.

Bar Graph Ppt PowerPoint Presentation Gallery Portfolio
This is a bar graph ppt powerpoint presentation gallery portfolio. This is a five stage process. The stages in this process are business, marketing, graph, line chart, growth.

Bar Chart Ppt PowerPoint Presentation Microsoft
This is a bar chart ppt powerpoint presentation microsoft. This is a eleven stage process. The stages in this process are sales in percentage, fy, graph, success, business.

Bar Chart Ppt PowerPoint Presentation Model
This is a bar chart ppt powerpoint presentation model. This is a two stage process. The stages in this process are business, marketing, product, planning, management.

Bar Graph Ppt PowerPoint Presentation Portfolio Background
This is a bar graph ppt powerpoint presentation portfolio background. This is a four stage process. The stages in this process are sale, years, product.

Bar Graph Ppt PowerPoint Presentation Professional Show
This is a bar graph ppt powerpoint presentation professional show. This is a four stage process. The stages in this process are business, strategy, marketing, planning, finance.

Bar Chart Ppt PowerPoint Presentation Ideas
This is a bar chart ppt powerpoint presentation ideas. This is a nine stage process. The stages in this process are graph, in percentage, growth, business, marketing.

Bar Graph Ppt PowerPoint Presentation Slides Format
This is a bar graph ppt powerpoint presentation slides format. This is a two stage process. The stages in this process are business, marketing, growth, planning, sales plan.

Bar Graph Ppt PowerPoint Presentation Ideas Diagrams
This is a bar graph ppt powerpoint presentation ideas diagrams. This is a twelve stage process. The stages in this process are jan, feb, mar, apr, may, growth.

Bar Graph Ppt PowerPoint Presentation File Show
This is a bar graph ppt powerpoint presentation file show. This is a four stage process. The stages in this process are business, marketing, graph, growth, finance.
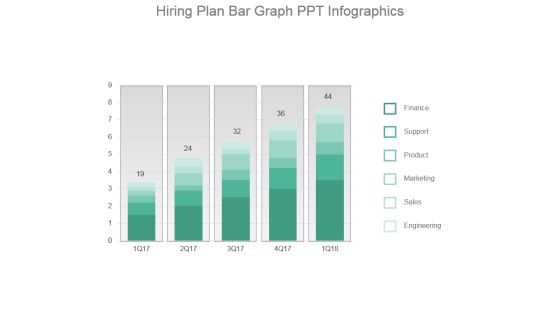
Hiring Plan Bar Graph Ppt Infographics
This is a hiring plan bar graph ppt infographics. This is a five stage process. The stages in this process are finance, support, product, marketing, sales, engineering.

Bar Graph Ppt PowerPoint Presentation Design Ideas
This is a bar graph ppt powerpoint presentation design ideas. This is a four stage process. The stages in this process are business, management, marketing, finance, year.

Bar Graph Ppt PowerPoint Presentation Template
This is a bar graph ppt powerpoint presentation template. This is a six stage process. The stages in this process are graph, business, marketing, finance.
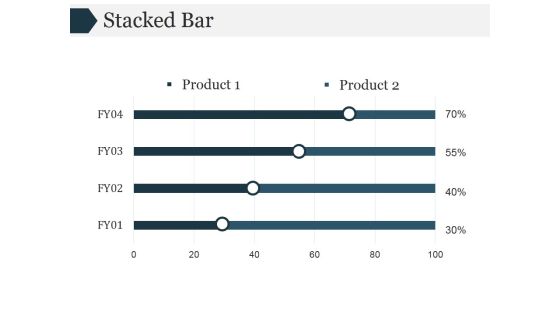
Stacked Bar Ppt PowerPoint Presentation Example File
This is a stacked bar ppt powerpoint presentation example file. This is a four stage process. The stages in this process are business, finance, investment, marketing, strategy, analysis.

Stacked Bar Ppt PowerPoint Presentation Topics
This is a stacked bar ppt powerpoint presentation topics. This is a two stage process. The stages in this process are product, planning, business, management, strategy.

Bar Graph Ppt PowerPoint Presentation Layouts Gridlines
This is a bar graph ppt powerpoint presentation layouts gridlines. this is a three stage process. The stages in this process are product, percentage, business, marketing, management.

Bar Graph Ppt Powerpoint Presentation Model Topics
This is a bar graph ppt powerpoint presentation model topics. This is a twelve stage process. The stages in this process are jan, feb, mar, mar, apr.

Bar Graph Ppt PowerPoint Presentation Icon
This is a bar graph ppt powerpoint presentation icon. This is a three stage process. The stages in this process are business, finance, marketing, strategy, analysis.

Stacked Bar Finance Ppt PowerPoint Presentation Microsoft
This is a stacked bar finance ppt powerpoint presentation microsoft. This is a two stage process. The stages in this process are finance, marketing, management, investment, analysis.

Bar Graph Ppt PowerPoint Presentation Themes
This is a bar graph ppt powerpoint presentation themes. This is a three stage process. The stages in this process are business, marketing, strategy, success, management.

Business Plan With Bar Graph Powerpoint Guide
This is a business plan with bar graph powerpoint guide. This is a four stage process. The stages in this process are sales, years, net profit, gross profit.

Bar Graph Ppt PowerPoint Presentation File Portfolio
This is a bar graph ppt powerpoint presentation file portfolio. This is a twelve stage process. The stages in this process are financial, marketing, management, business, strategy.

Bar Graph Ppt PowerPoint Presentation File Picture
This is a bar graph ppt powerpoint presentation file picture. This is a six stage process. The stages in this process are management, planning, marketing, business, strategy.
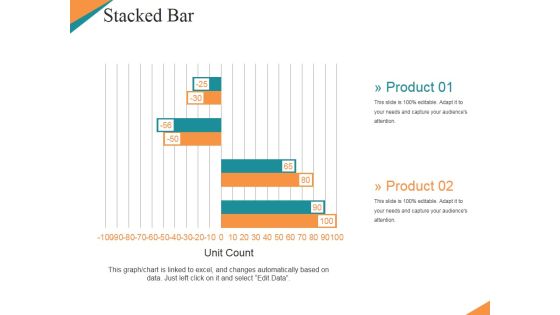
Stacked Bar Ppt PowerPoint Presentation Sample
This is a stacked bar ppt powerpoint presentation sample. This is a four stage process. The stages in this process are planning, management, strategy, marketing, business.

Bar Graph Ppt PowerPoint Presentation Ideas
This is a bar graph ppt powerpoint presentation ideas. This is a two stage process. The stages in this process are computer, graph, growth, success, social.

Bar Graph Ppt PowerPoint Presentation Inspiration Sample
This is a bar graph ppt powerpoint presentation inspiration sample. This is a four stage process. The stages in this process are business, pyramid, marketing, strategy, planning.

Bar Graph Ppt PowerPoint Presentation Layouts Pictures
This is a bar graph ppt powerpoint presentation layouts pictures. This is a four stage process. The stages in this process are fire, earthquake, axis title, in percentage.

Bar Graph Ppt PowerPoint Presentation Model Templates
This is a bar graph ppt powerpoint presentation model templates. This is a eight stage process. The stages in this process are graph, business, finance, growth, marketing.

Bar Chart Ppt PowerPoint Presentation Model Professional
This is a bar chart ppt powerpoint presentation model professional. This is a three stage process. The stages in this process are business, marketing, strategy, finance, growth.

Media Mix Optimization Bar Chart Ppt Slides
This is a media mix optimization bar chart ppt slides. This is a one stage process. The stages in this process are business, media, success.

Target Modelling Bar Chart Ppt Slides
This is a target modelling bar chart ppt slides. This is a six stage process. The stages in this process are arrows, business, success.

Bar Graph Ppt PowerPoint Presentation Shapes
This is a bar graph ppt powerpoint presentation shapes. This is a five stage process. The stages in this process are arrows, marketing, strategy, business, success.

Bar Graph Ppt PowerPoint Presentation Gallery Inspiration
This is a bar graph ppt powerpoint presentation gallery inspiration. This is a three stage process. The stages in this process are product, sales in percentage, finance, success.
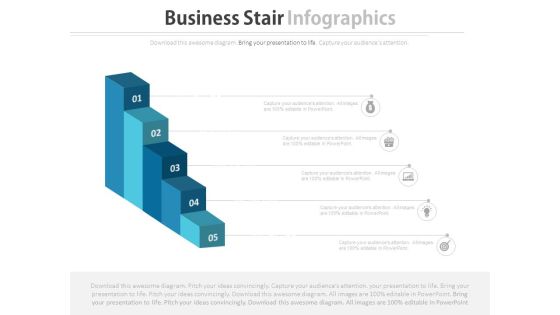
Five Steps Growth Bar Graph Powerpoint Template
This business template has been designed with five steps growth bar graph. This business diagram helps to bullet point your thoughts and ideas. Download this diagram to make interactive presentations.

Bar Graph For Business Growth Powerpoint Templates
This PowerPoint slide contains graphics bar chart. This slide helps to exhibit business growth analysis. Sparkling thoughts are swirling around in your head. Filter them through with this diagram slide.
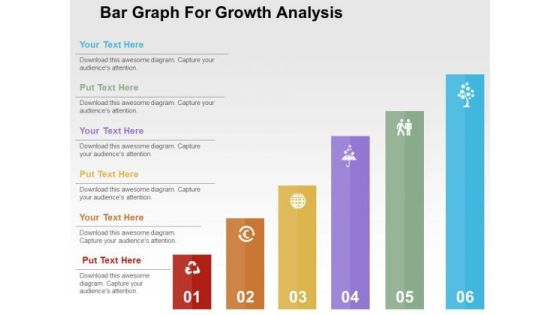
Bar Graph For Growth Analysis PowerPoint Template
This slide contains graphics bar chart. This slide helps to exhibit business growth analysis. Sparkling thoughts are swirling around in your head. Filter them through with this diagram slide.
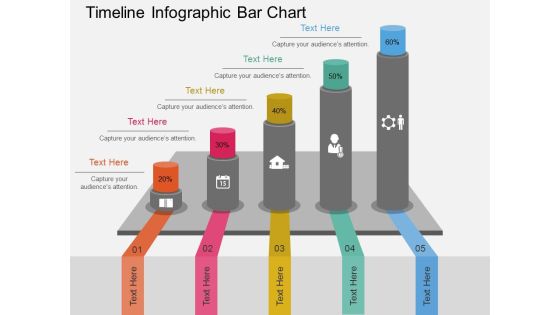
Timeline Infographic Bar Chart Powerpoint Template
This business diagram has been designed with timeline infographic bar chart. You may use this slide to display success and growth concepts. Make your mark with this unique slide and create an impression that will endure.

Bar Chart Ppt PowerPoint Presentation Layouts Visuals
This is a bar chart ppt powerpoint presentation layouts visuals. This is a two stage process. The stages in this process are business, strategy, marketing, planning, chart and graph.

Bar Graph Ppt PowerPoint Presentation Slides Deck
This is a bar graph ppt powerpoint presentation slides deck. This is a three stage process. The stages in this process are financial in years, product, sales in percentage.

Bar Graph Ppt PowerPoint Presentation Introduction
This is a bar graph ppt powerpoint presentation introduction. This is a eleven stage process. The stages in this process are management, marketing, business, fy, graph, sales in percentage.

Bar Graph On Tablet PowerPoint Templates
Create dynamic presentations with our professional template containing diagram of bar graph on computer tablet. You may use this slide to portray concepts like business, growth, success etc. Present your views using our innovative slide.
Business Concepts 3d Team Discussing Bar Graph
Put In A Dollop Of Our Business Concepts 3d Team Discussing Bar Graph Powerpoint Templates. Give Your Thoughts A Distinctive Flavor. Create Your Domain With Our marketing Powerpoint Templates. Rule Minds With Your Thoughts.
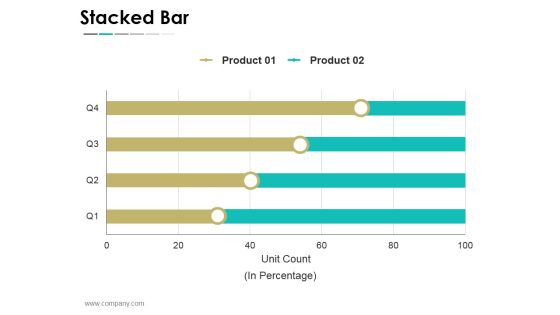
Stacked Bar Ppt PowerPoint Presentation Infographics Graphics
This is a stacked bar ppt powerpoint presentation infographics graphics. This is a four stage process. The stages in this process are business, strategy, marketing, success, unit count, in percentage.

Bar Graph Displaying Profit Growth Powerpoint Slides
This PowerPoint template has been designed with six point?s bar graph with icons. This PPT slide can be used to prepare presentations for marketing reports and also for financial data analysis. You can download finance PowerPoint template to prepare awesome presentations.

Bar Graph For Future Planning Powerpoint Template
This business diagram display bar graph for years 2015 and 2016. You may use this slide to display statistical analysis. This diagram provides an effective way of displaying information you can edit text, color, shade and style as per you need.
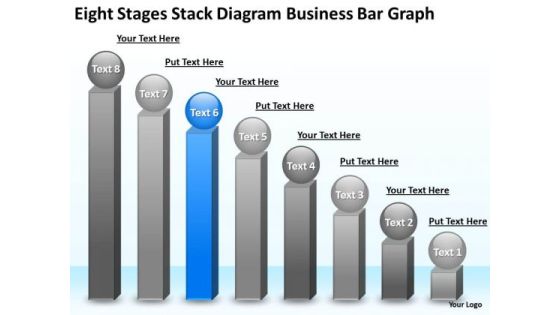
Business PowerPoint Presentations Bar Graph Plan Slides
We present our business powerpoint presentations bar graph plan Slides.Present our Business PowerPoint Templates because It will Raise the bar of your Thoughts. They are programmed to take you to the next level. Download our Spheres PowerPoint Templates because You can Channelise the thoughts of your team with our PowerPoint Templates and Slides. Urge them to focus on the goals you have set. Download our Competition PowerPoint Templates because Our PowerPoint Templates and Slides will let you Leave a lasting impression to your audiences. They possess an inherent longstanding recall factor. Present our Shapes PowerPoint Templates because It will get your audience in sync. Use our Success PowerPoint Templates because Our PowerPoint Templates and Slides will let you Leave a lasting impression to your audiences. They possess an inherent longstanding recall factor.Use these PowerPoint slides for presentations relating to bar, graph, statistics, economy, render, success, representation, diagram, graphic, achievment, obstruction, chevron, accounting, finances, energy eco, steps, figure, tall, barrier, strategy, ladder, up, planning, high, climb, stripes, growth, maintenance, profit, successful, repair, return, gradient, sustainability, financial, construction, upwards, increasing. The prominent colors used in the PowerPoint template are Blue, Gray, White.
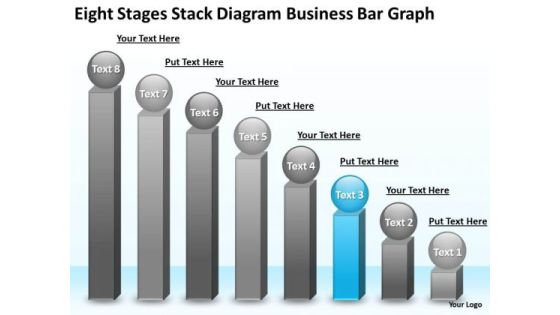
PowerPoint Presentations Bar Graph Business Plan Templates
We present our powerpoint presentations bar graph business plan templates.Use our Finance PowerPoint Templates because Our PowerPoint Templates and Slides are created by a hardworking bunch of busybees. Always flitting around with solutions gauranteed to please. Download our Leadership PowerPoint Templates because Our PowerPoint Templates and Slides are endowed to endure. Ideas conveyed through them will pass the test of time. Use our Business PowerPoint Templates because Your ideas provide food for thought. Our PowerPoint Templates and Slides will help you create a dish to tickle the most discerning palate. Use our Success PowerPoint Templates because Our PowerPoint Templates and Slides will provide you a launch platform. Give a lift off to your ideas and send them into orbit. Use our Spheres PowerPoint Templates because You can Bait your audience with our PowerPoint Templates and Slides. They will bite the hook of your ideas in large numbers.Use these PowerPoint slides for presentations relating to Concepts, Leadership, Success, Human, Achievement, Wink, Business, Ball, Three-Dimensional, Sign, Template, Diagram, Change, Character, Graphic, Stock, Development, Shape, Graph, Finances, Steps, Chart, Sphere, Examining, Up, Nice, Planning, Face, Growth, Person, Progress, Increases, Improvement, Image, Mimicry, Financial, Staircase. The prominent colors used in the PowerPoint template are Blue, Gray, Black.

Team With Bar Graph And Teamwork
This Power Point template has been designed with graphic of 3d team forming a pie chart. In this slide team is displaying data analysis and comparison. Use this editable slide to build innovative presentation for your viewers.
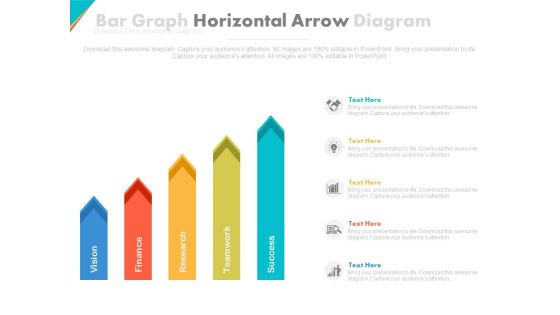
Five Horizontal Arrows Bar Graph Powerpoint Slides
This PowerPoint template contains five horizontal arrows bra graph. You may download this PPT slide design to display steps of strategic planning. You can easily customize this template to make it more unique as per your need.

CSR Projects Completion And Risk Progress Scorecard Microsoft PDF
This slide covers multiple projects under organizations corporate social responsibility with progress status. It includes 4 different projects along with task progress bar, cost incurred , open issues risks, total months, members and tasks count.Pitch your topic with ease and precision using this CSR Projects Completion And Risk Progress Scorecard Microsoft PDF. This layout presents information on System Development, Development Barrel, System Development. It is also available for immediate download and adjustment. So, changes can be made in the color, design, graphics or any other component to create a unique layout.

Progress Graph Finance PowerPoint Templates And PowerPoint Themes 0412
Microsoft Powerpoint Templates and Background with bar chart growth
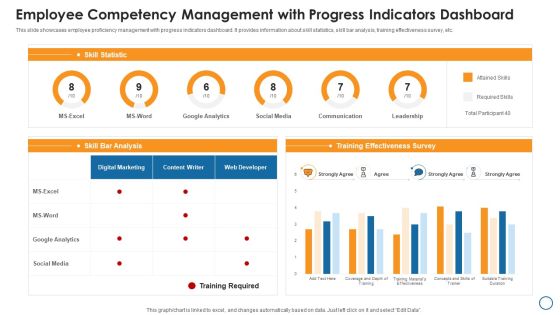
Employee Competency Management With Progress Indicators Dashboard Graphics PDF
This slide showcases employee proficiency management with progress indicators dashboard. It provides information about skill statistics, skill bar analysis, training effectiveness survey, etc. Showcasing this set of slides titled employee competency management with progress indicators dashboard graphics pdf. The topics addressed in these templates are google analytics, social media, survey. All the content presented in this PPT design is completely editable. Download it and make adjustments in color, background, font etc. as per your unique business setting.

Business Diagram Thermometer Graphics Indicating Progress Presentation Template
This power point template diagram has been designed with graphic of thermometer and bar graph. This PPT contains the concept of growth analysis. Use this PPT for business and marketing related presentations.

Project Prioritization Progress Scorecard With Assigned Employees Diagrams PDF
This slide covers report of multiple projects with assigned project manager. It also includes priority status, time frame, completion bar along with variances found. Pitch your topic with ease and precision using this Project Prioritization Progress Scorecard With Assigned Employees Diagrams PDF. This layout presents information on Project Prioritization, Progress Scorecard, Assigned Employees. It is also available for immediate download and adjustment. So, changes can be made in the color, design, graphics or any other component to create a unique layout.

Project Health And Completion Progress Scorecard Designs PDF
This slide covers health status for multiple projects in an organization based on different metrics. It includes metrics such as project details, time score, risk level, workload and time score with completion bar and assigned project leader.Pitch your topic with ease and precision using this Project Health And Completion Progress Scorecard Designs PDF. This layout presents information on Project Leader, Workload Score, Cost Score. It is also available for immediate download and adjustment. So, changes can be made in the color, design, graphics or any other component to create a unique layout.

Project Progress Summary Ppt PowerPoint Presentation Ideas Gridlines
This is a project progress summary ppt powerpoint presentation ideas gridlines. This is a two stage process. The stages in this process are status, high, low, cost, project.

Progress Measures Achieved In 2020 One Pager Documents
This slide covers the key strategic progress achieved in an academic year along with the fund expanded. Presenting you an exemplary Progress Measures Achieved In 2020 One Pager Documents. Our one-pager comprises all the must-have essentials of an inclusive document. You can edit it with ease, as its layout is completely editable. With such freedom, you can tweak its design and other elements to your requirements. Download this Progress Measures Achieved In 2020 One Pager Documents brilliant piece now.

Progress Measures Achieved In 2022 One Pager Documents
This slide covers the key strategic progress achieved in an academic year along with the fund expanded. Presenting you a fantastic Progress Measures Achieved In 2022 One Pager Documents. This piece is crafted on hours of research and professional design efforts to ensure you have the best resource. It is completely editable and its design allow you to rehash its elements to suit your needs. Get this Progress Measures Achieved In 2022 One Pager Documents A4 One-pager now.

Project Manager Icon Assessing Task Progress Diagrams PDF
Presenting Project Manager Icon Assessing Task Progress Diagrams PDF to dispense important information. This template comprises three stages. It also presents valuable insights into the topics including Project Manager, Icon Assessing, Task Progress. This is a completely customizable PowerPoint theme that can be put to use immediately. So, download it and address the topic impactfully.

Future Progress Curriculum In 2022 One Pager Documents
Presenting you a fantastic Future Progress Curriculum In 2022 One Pager Documents. This piece is crafted on hours of research and professional design efforts to ensure you have the best resource. It is completely editable and its design allow you to rehash its elements to suit your needs. Get this Future Progress Curriculum In 2022 One Pager Documents A4 One-pager now.

Project Strategic Projection Progress Status Assessment Sample PDF
Following slide demonstrates checklist which can be used by business to evaluate project planning assumptions progress. It includes key components such as tasks, description, pending tasks, in progress tasks and completed tasks. Pitch your topic with ease and precision using this Project Strategic Projection Progress Status Assessment Sample PDF. This layout presents information on Tasks, Description, Work Environment. It is also available for immediate download and adjustment. So, changes can be made in the color, design, graphics or any other component to create a unique layout.

Ppt Slide Lego Blocks Of Project Progress Consulting Firms
Break The Deadlock With Our PPT Slide Lego Blocks Of Project Progress Consulting Firms Powerpoint Templates. Let The Words Start To Flow. Assert Your Capability With Our Consulting Firms Powerpoint Templates. Give Your Thoughts That Decisive Touch.

Team Tracking Goals Accountability And Progress Pictures PDF
This template discusses the OKR tracker, which can be used to rapidly receive a summary of the teams recent work progress and achievements. It also includes details such as owner, assigned team, progress, and status report of the mentioned goals. Showcasing this set of slides titled Team Tracking Goals Accountability And Progress Pictures PDF. The topics addressed in these templates are Recurring Revenue, Reduce Customer, Increase Referral Sales. All the content presented in this PPT design is completely editable. Download it and make adjustments in color, background, font etc. as per your unique business setting.

Project Gantt Chart For Assessing Department Progress Brochure PDF
This slide represents the project Gantt chart that enables monitoring the progress status of departments. It covers the website team, mobile team, and marketing team. Showcasing this set of slides titled Project Gantt Chart For Assessing Department Progress Brochure PDF. The topics addressed in these templates are Third Party Integration, New Admin Console, Security Upgrade. All the content presented in this PPT design is completely editable. Download it and make adjustments in color, background, font etc. as per your unique business setting.
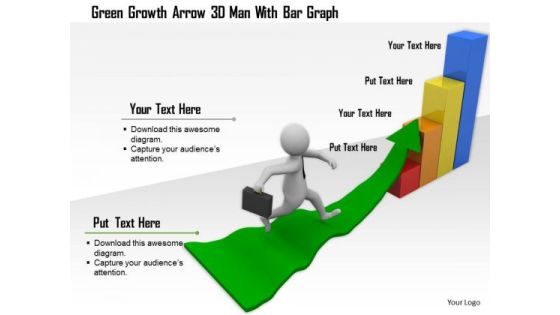
Green Growth Arrow 3d Man With Bar Graph
Our above image slide displays 3d man climbing on growth arrow. This conceptual image contains the concept of growth. We have also used graphic of bar graph which can be used to display business progress. Build an innovative presentation using this professional image slide.
 Home
Home