Program Metrics
Techniques For Effective Supply Chain Management Logistics Management Strategy Effectiveness Tracking Sheet Demonstration PDF
This slide covers the key performance indicator for tracking impact of new logistics management strategy. It includes metrics such as shipping time, order accuracy, lead time, capacity utilization, customer backorder rate, inventory turnover, etc. There are so many reasons you need a Techniques For Effective Supply Chain Management Logistics Management Strategy Effectiveness Tracking Sheet Demonstration PDF. The first reason is you cannot spend time making everything from scratch, Thus, Slidegeeks has made presentation templates for you too. You can easily download these templates from our website easily.

Human Resource Service Delivery Kpis Ppt PowerPoint Presentation File Example File PDF
This slide focuses on the metrics that are used for measuring the efficiency of human resource service delivery which focuses on self-service, first contact, second line, service level agreement resolution rate and employee satisfaction, etc. that helps in service delivery level. Presenting human resource service delivery kpis ppt powerpoint presentation file example file pdf to dispense important information. This template comprises five stages. It also presents valuable insights into the topics including human resource, monitoring, workforce. This is a completely customizable PowerPoint theme that can be put to use immediately. So, download it and address the topic impactfully.
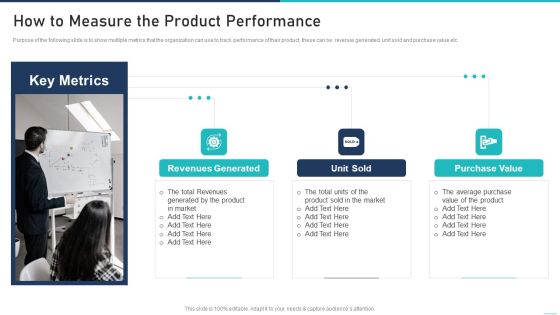
Generic Growth Playbook How To Measure The Product Performance Topics PDF
Purpose of the following slide is to show multiple metrics that the organization can use to track performance of their product, these can be revenue generated, unit sold and purchase value etc.This is a generic growth playbook how to measure the product performance topics pdf template with various stages. Focus and dispense information on three stages using this creative set, that comes with editable features. It contains large content boxes to add your information on topics like revenues generated, purchase value, generated by the product You can also showcase facts, figures, and other relevant content using this PPT layout. Grab it now.

Playbook For Sales Growth Strategies How To Measure The Product Performance Mockup PDF
Purpose of the following slide is to show multiple metrics that the organization can use to track performance of their product, these can be revenue generated, unit sold and purchase value etc. This is a Playbook For Sales Growth Strategies How To Measure The Product Performance Mockup PDF template with various stages. Focus and dispense information on three stages using this creative set, that comes with editable features. It contains large content boxes to add your information on topics like Revenues Generated, Unit Sold, Purchase Value. You can also showcase facts, figures, and other relevant content using this PPT layout. Grab it now.

Promoting Growth Internal Operations Techniques Playbook How To Measure The Product Performance Ideas PDF
Purpose of the following slide is to show multiple metrics that the organization can use to track performance of their product, these can be revenue generated, unit sold and purchase value etc. This is a Promoting Growth Internal Operations Techniques Playbook How To Measure The Product Performance Ideas PDF template with various stages. Focus and dispense information on three stages using this creative set, that comes with editable features. It contains large content boxes to add your information on topics like Unit Sold, Revenues Generated, Purchase Value. You can also showcase facts, figures, and other relevant content using this PPT layout. Grab it now.

Timeline Indicating Performance Enhancement Plan For Workplace Efficiency Information PDF
This slide represents timeline indicating improvement plan for workplace efficiency which can benefit organizations in increasing productivity and performance yield of workforce. It includes information about improvement goals, current position of company, metrics to measure, feedback process, teamwork, organizing, etc. Showcasing this set of slides titled Timeline Indicating Performance Enhancement Plan For Workplace Efficiency Information PDF. The topics addressed in these templates are Teamwork, Process Development, Organizing Workplace. All the content presented in this PPT design is completely editable. Download it and make adjustments in color, background, font etc. as per your unique business setting.

KPI Dashboard To Monitor Beauty Care Products Sales Performance Ppt Outline Example Topics PDF
This slide shows the key performance indicators dashboard which can be used to analyze current financial position of cosmetic business. It includes metrics such as sales, expenses, profit, cash in hand, etc. Showcasing this set of slides titled KPI Dashboard To Monitor Beauty Care Products Sales Performance Ppt Outline Example Topics PDF. The topics addressed in these templates are Accounts Receivable, Profit Margin, Expense. All the content presented in this PPT design is completely editable. Download it and make adjustments in color, background, font etc. as per your unique business setting.

KPI Dashboard To Track Beauty Care Products Sales Performance Ppt Outline Pictures PDF
This slide shows the key performance indicators dashboard which can be used to analyze current financial position of cosmetic business. It includes metrics such as sales, expenses, profit, cash in hand, etc. Showcasing this set of slides titled KPI Dashboard To Track Beauty Care Products Sales Performance Ppt Outline Pictures PDF. The topics addressed in these templates are Sales Number, Total Sales, Total Profit, Cost. All the content presented in this PPT design is completely editable. Download it and make adjustments in color, background, font etc. as per your unique business setting.
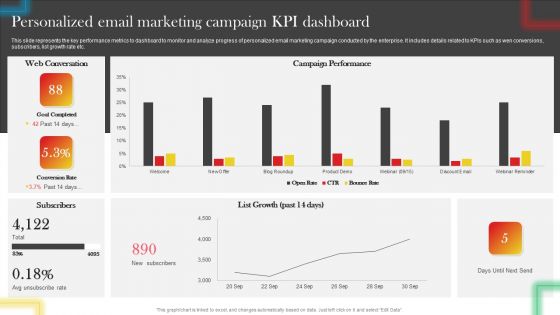
Personalized Email Marketing Campaign KPI Dashboard Inspiration PDF
This slide represents the key performance metrics to dashboard to monitor and analyze progress of personalized email marketing campaign conducted by the enterprise. It includes details related to KPIs such as wen conversions, subscribers, list growth rate etc. If your project calls for a presentation, then Slidegeeks is your go-to partner because we have professionally designed, easy-to-edit templates that are perfect for any presentation. After downloading, you can easily edit Personalized Email Marketing Campaign KPI Dashboard Inspiration PDF and make the changes accordingly. You can rearrange slides or fill them with different images. Check out all the handy templates

Comparative Assessment Of Sales Performance With Competitors Infographics PDF
This slide shows the comparative assessment of sales performance with competitors on the basis of certain metrics such as lead qualification rate, marketing effectiveness, sales forecast accuracy, pipeline thickness, etc. Presenting Comparative Assessment Of Sales Performance With Competitors Infographics PDF to provide visual cues and insights. Share and navigate important information on five stages that need your due attention. This template can be used to pitch topics like Industry Benchmark, Marketing Effectiveness, Sales Forecast Accuracy. In addtion, this PPT design contains high resolution images, graphics, etc, that are easily editable and available for immediate download.

Go To Market Approach For New Product KPI Dashboard To Monitor Sales Performance Clipart PDF
This slide shows sales performance monitoring dashboard. Metrics included in the dashboard are sales revenue, sales growth, average revenue per unit, customer lifetime value and customer acquisition cost.Deliver and pitch your topic in the best possible manner with this Go To Market Approach For New Product KPI Dashboard To Monitor Sales Performance Clipart PDF Use them to share invaluable insights on Kpi Dashboard To Monitor Sales Performance and impress your audience. This template can be altered and modified as per your expectations. So, grab it now.

New Product Sales Strategy And Marketing KPI Dashboard To Monitor Sales Performance Information PDF
This slide shows sales performance monitoring dashboard. Metrics included in the dashboard are sales revenue, sales growth, average revenue per unit, customer lifetime value and customer acquisition cost. Deliver an awe inspiring pitch with this creative New Product Sales Strategy And Marketing KPI Dashboard To Monitor Sales Performance Information PDF bundle. Topics like Sales Revenue, Monthly Sales Growth, Sales Country Performance can be discussed with this completely editable template. It is available for immediate download depending on the needs and requirements of the user.

KPI Dashboard Of Real Estate Customer Relationship Management Pictures PDF
This slide represents the dashboard generated through CRM software used in a real estate company. It shows details related to key performance metrics such as leads by source, closed and pending transactions, projected monthly sales volume etc. Showcasing this set of slides titled KPI Dashboard Of Real Estate Customer Relationship Management Pictures PDF. The topics addressed in these templates are Projected Monthly Sales Volume, Leads By Source, Annual Commissions. All the content presented in this PPT design is completely editable. Download it and make adjustments in color, background, font etc. as per your unique business setting.

Action Plan To Enhance Client Service Issue 1 Increasing Average Response Time Ideas PDF
This slide provides an overview of major KPIs of customer service team. The metrics covered are average response time and first call resolution. Take your projects to the next level with our ultimate collection of Action Plan To Enhance Client Service Issue 1 Increasing Average Response Time Ideas PDF. Slidegeeks has designed a range of layouts that are perfect for representing task or activity duration, keeping track of all your deadlines at a glance. Tailor these designs to your exact needs and give them a truly corporate look with your own brand colors they will make your projects stand out from the rest.

Action Plan To Enhance Client Service Issue 3 Declining Customer Retention Rate Guidelines PDF
This slide provides an overview of major KPIs of customer service team. The metrics covered are customer satisfaction and retention. Find a pre designed and impeccable Action Plan To Enhance Client Service Issue 3 Declining Customer Retention Rate Guidelines PDF. The templates can ace your presentation without additional effort. You can download these easy to edit presentation templates to make your presentation stand out from others. So, what are you waiting for Download the template from Slidegeeks today and give a unique touch to your presentation.
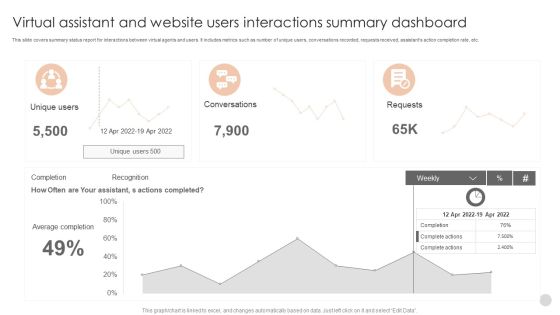
Virtual Assistant And Website Users Interactions Summary Dashboard Formats PDF
This slide covers summary status report for interactions between virtual agents and users. It includes metrics such as number of unique users, conversations recorded, requests received, assistants action completion rate, etc.Showcasing this set of slides titled Virtual Assistant And Website Users Interactions Summary Dashboard Formats PDF. The topics addressed in these templates are Actions Completed, Conversations, Complete Actions. All the content presented in this PPT design is completely editable. Download it and make adjustments in color, background, font etc. as per your unique business setting.
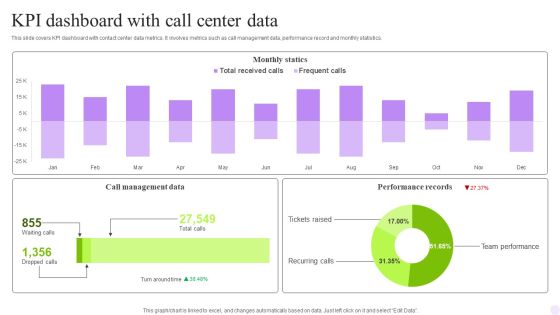
KPI Dashboard With Call Center Data Rules PDF
This slide covers contact center performance metrics KPI dashboard. It involves details such as number of total calls, average answer speed, abandon rate, data of agents performance and call abandon rate by departments. Pitch your topic with ease and precision using this KPI Dashboard With Call Center Data Rules PDF. This layout presents information on Monthly Statics, Management Data, Performance Records. It is also available for immediate download and adjustment. So, changes can be made in the color, design, graphics or any other component to create a unique layout.
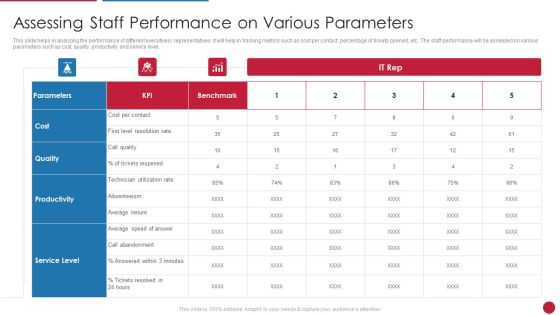
Facilitating IT Intelligence Architecture Assessing Staff Performance On Various Parameters Structure PDF
This slide helps in analyzing the performance of different executives representatives. It will help in tracking metrics such as cost per contact, percentage of tickets opened, etc. The staff performance will be assessed on various parameters such as cost, quality, productivity and service level. Deliver and pitch your topic in the best possible manner with this Facilitating IT Intelligence Architecture Assessing Staff Performance On Various Parameters Structure PDF Use them to share invaluable insights on Absenteeism, Productivity, Parameters and impress your audience. This template can be altered and modified as per your expectations. So, grab it now.
Development And Operations KPI Dashboard With Central Processing Unit Statistics Icons PDF
This slide covers devops KPI metrics dashboard with central processing unit statistics about input output statistics , network traffic volume under during recorded sessions. Further, this template includes numbers of sessions with waiting time.Showcasing this set of slides titled Development And Operations KPI Dashboard With Central Processing Unit Statistics Icons PDF The topics addressed in these templates are Central Processing, Output Statistics, Resource Limits All the content presented in this PPT design is completely editable. Download it and make adjustments in color, background, font etc. as per your unique business setting.

Action Plan To Enhance Client Service Track Kpis To Evaluate Team Performance Download PDF
The following slide depicts key metrics to evaluate support team performance. Major KPIs covered are customer satisfaction score, first contact resolution, employee engagement and negative response rate From laying roadmaps to briefing everything in detail, our templates are perfect for you. You can set the stage with your presentation slides. All you have to do is download these easy to edit and customizable templates. Action Plan To Enhance Client Service Track Kpis To Evaluate Team Performance Download PDF will help you deliver an outstanding performance that everyone would remember and praise you for. Do download this presentation today.
Monthly Retail Stock Performance Dashboard Icons PDF
This slide shows monthly inventory performance of retail products for analyzing monthly in stock an out-stock with their values. It include metrics like current inventory available, current inventory value and closing monthly stock etc. Showcasing this set of slides titled Monthly Retail Stock Performance Dashboard Icons PDF. The topics addressed in these templates are Current Inventory Available, Current Inventory Value. All the content presented in this PPT design is completely editable. Download it and make adjustments in color, background, font etc. as per your unique business setting.

Stock Performance Warehouse Management Dashboard Brochure PDF
This slide shows inventory performance management dashboard for analyzing all warehouse related expenses. It include metrics such as inventory carrying cost, inventory supply days and product stock details etc. Showcasing this set of slides titled Stock Performance Warehouse Management Dashboard Brochure PDF. The topics addressed in these templates are Inventory Supply Days, Inventory Carrying Cost, Inventory Turnover. All the content presented in this PPT design is completely editable. Download it and make adjustments in color, background, font etc. as per your unique business setting.

Real Time Analytics Dashboard To Measure Marketing Campaign Performance Information PDF
The purpose of this slide is to outline analytics dashboard to evaluate the success rate of marketing campaign performance. It provides information about metrics such as clicks, impressions, spend, conversions, site audit score, audience growth, etc. Pitch your topic with ease and precision using this Real Time Analytics Dashboard To Measure Marketing Campaign Performance Information PDF. This layout presents information on Real Time Analytics Dashboard To Measure Marketing Campaign Performance. It is also available for immediate download and adjustment. So, changes can be made in the color, design, graphics or any other component to create a unique layout.

Service Promotion Plan Kpis To Monitor Quarterly Marketing Performance Diagrams PDF
This slide shows various metrics which can be used by marketing manager to track performance. These key performance indicators are customer acquisition cost, sales growth, new leads, website traffic, etc. Make sure to capture your audiences attention in your business displays with our gratis customizable Service Promotion Plan Kpis To Monitor Quarterly Marketing Performance Diagrams PDF. These are great for business strategies, office conferences, capital raising or task suggestions. If you desire to acquire more customers for your tech business and ensure they stay satisfied, create your own sales presentation with these plain slides.
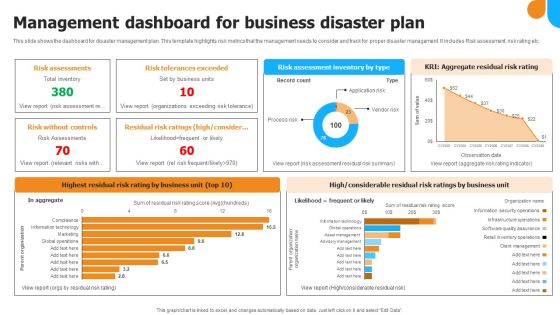
Management Dashboard For Business Disaster Plan Infographics PDF
This slide shows the dashboard for disaster management plan. This template highlights risk metrics that the management needs to consider and track for proper disaster management. It includes Risk assessment, risk rating etc. Showcasing this set of slides titled Management Dashboard For Business Disaster Plan Infographics PDF Graphics. The topics addressed in these templates are Risk Assessments, Risk Tolerances Exceeded, Risk Without Controls. All the content presented in this PPT design is completely editable. Download it and make adjustments in color, background, font etc. as per your unique business setting.

Measuring Ab Testing Solution With Saas Company KPI Dashboard Guidelines PDF
The purpose of this slide is to showcase SaaS metrics dashboard which can assist the corporations to make changes in product to improve user experience. It covers information about weighted satisfaction score, positive satisfaction rating, etc. Pitch your topic with ease and precision using this Measuring Ab Testing Solution With Saas Company KPI Dashboard Guidelines PDF. This layout presents information on Lifetime Value Customer, Positive Satisfaction Rating, Save Widget, Weighted Satisfaction Score. It is also available for immediate download and adjustment. So, changes can be made in the color, design, graphics or any other component to create a unique layout.
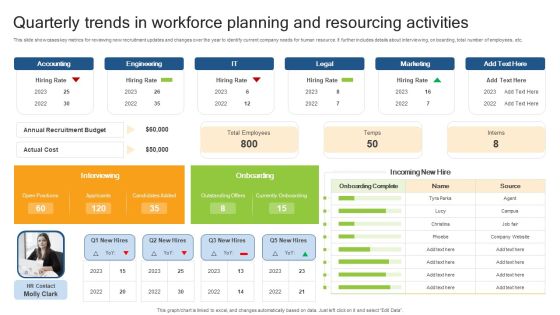
Quarterly Trends In Workforce Planning And Resourcing Activities Professional PDF
This slide showcases key metrics for reviewing new recruitment updates and changes over the year to identify current company needs for human resource. It further includes details about interviewing, on boarding, total number of employees, etc. Showcasing this set of slides titled Quarterly Trends In Workforce Planning And Resourcing Activities Professional PDF. The topics addressed in these templates are Accounting, Engineering, Legal. All the content presented in this PPT design is completely editable. Download it and make adjustments in color, background, font etc. as per your unique business setting.
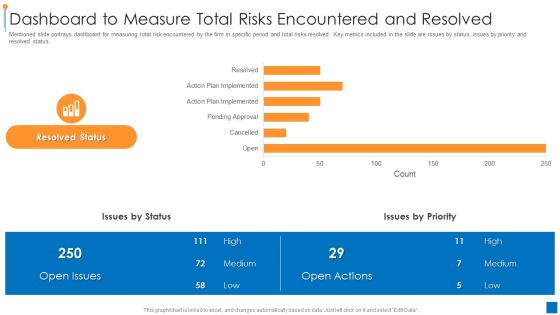
International Organization Standardization 270001 Dashboard To Measure Total Risks Encountered And Resolved Demonstration PDF
Mentioned slide portrays dashboard for measuring total risk encountered by the firm in specific period and total risks resolved. Key metrics included in the slide are issues by status, issues by priority and resolved status. Deliver and pitch your topic in the best possible manner with this international organization standardization 270001 dashboard to measure total risks encountered and resolved demonstration pdf. Use them to share invaluable insights on dashboard to measure total risks encountered and resolved and impress your audience. This template can be altered and modified as per your expectations. So, grab it now.

Plant Safety Measures Dashboard With Incidents Work Accidents And Near Misses Template PDF
This slide showcases dashboard to monitor plant safety measures performance indicators. Key metrics covered are incident and injury type, root cause, location, contributing factor, employees at risk and investigation. Pitch your topic with ease and precision using this Plant Safety Measures Dashboard With Incidents Work Accidents And Near Misses Template PDF. This layout presents information on Plant Safety Measures Dashboard, Incidents Work Accidents. It is also available for immediate download and adjustment. So, changes can be made in the color, design, graphics or any other component to create a unique layout.

Product Development Status Icon With Bulb Ideas PDF
The following slide showcases dashboard that helps to track key performance indicators of product development. Key metrics covered overall progress, planning, design, development, testing, risks, summary, average handle time, overdue tasks, upcoming deadlines and projected launch date. Showcasing this set of slides titled Product Development Status Icon With Bulb Ideas PDF. The topics addressed in these templates are Design, Development, Planning. All the content presented in this PPT design is completely editable. Download it and make adjustments in color, background, font etc. as per your unique business setting.
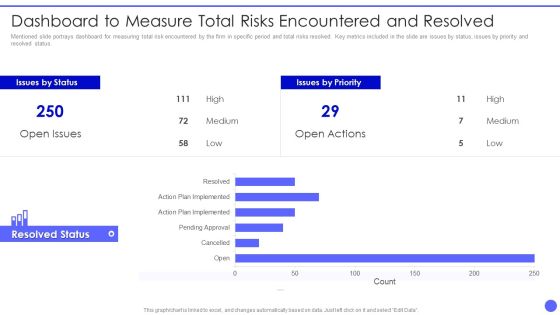
Info Safety And ISO 27001 Dashboard To Measure Total Risks Encountered Slides PDF
Mentioned slide portrays dashboard for measuring total risk encountered by the firm in specific period and total risks resolved. Key metrics included in the slide are issues by status, issues by priority and resolved status. Deliver an awe inspiring pitch with this creative Info Safety And ISO 27001 Dashboard To Measure Total Risks Encountered Slides PDF bundle. Topics like Issues by Status, Resolved Status, High, Medium, Low can be discussed with this completely editable template. It is available for immediate download depending on the needs and requirements of the user.
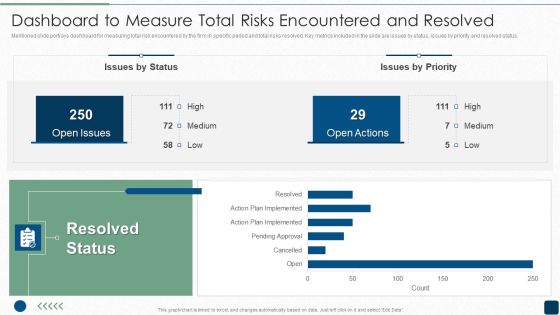
ISO 27001 Certification Procedure Dashboard To Measure Total Risks Encountered And Resolved Topics PDF
Mentioned slide portrays dashboard for measuring total risk encountered by the firm in specific period and total risks resolved. Key metrics included in the slide are issues by status, issues by priority and resolved status.Deliver and pitch your topic in the best possible manner with this ISO 27001 Certification Procedure Dashboard To Measure Total Risks Encountered And Resolved Topics PDF. Use them to share invaluable insights on Resolved Status, Open Issues, Open Actions and impress your audience. This template can be altered and modified as per your expectations. So, grab it now.

Dashboard To Measure Performance Of Social Media Marketing Strategies Pictures PDF
This following slide displays the key metrics that can help an organization to measure effectiveness of social media strategies. These can be leads generated, leads by region, web traffic targets etc.Slidegeeks is one of the best resources for PowerPoint templates. You can download easily and regulate Dashboard To Measure Performance Of Social Media Marketing Strategies Pictures PDF for your personal presentations from our wonderful collection. A few clicks is all it takes to discover and get the most relevant and appropriate templates. Use our Templates to add a unique zing and appeal to your presentation and meetings. All the slides are easy to edit and you can use them even for advertisement purposes.
Employee Training And Development Plan Performance Tracking Dashboard Portrait PDF
Mentioned slide outlines key performance indicator KPI dashboard which can be used by organization to monitor training and development strategies. The major metrics covered in the template are cost per participant, per hour, number of trainees , etc. Showcasing this set of slides titled Employee Training And Development Plan Performance Tracking Dashboard Portrait PDF. The topics addressed in these templates are Employee Training, Development Plan Performance, Tracking Dashboard. All the content presented in this PPT design is completely editable. Download it and make adjustments in color, background, font etc. as per your unique business setting.

Organic Business Growth Strategies Dashboard For Measuring Success Of Our Marketing Efforts Diagrams PDF
Purpose of the following slide is to display a dashboard to help analyze the marketing efforts through essential metrics such as the revenue generated, average revenue generated per unit etc. Deliver an awe inspiring pitch with this creative Organic Business Growth Strategies Dashboard For Measuring Success Of Our Marketing Efforts Diagrams PDF bundle. Topics like Average Revenue, Customer Lifetime Value, Customer Acquisition Cost can be discussed with this completely editable template. It is available for immediate download depending on the needs and requirements of the user.

Digital Performance In Shared Business Services Back Office Functions Formats PDF
Following slide provides information regarding performance measure utilized by organizations for various back office function which benefits them to drive better productivity and efficiency. Share service center, digital performance metrics and key highlights are demonstrated in this slide. Pitch your topic with ease and precision using this Digital Performance In Shared Business Services Back Office Functions Formats PDF. This layout presents information on Volume Productivity, Service, Maturity. It is also available for immediate download and adjustment. So, changes can be made in the color, design, graphics or any other component to create a unique layout.

E Mail Marketing Performance Goals Achieved Survey Analysis Sample PDF
The purpose of this slide is to illustrate the survey outcomes in order to measure the effectiveness of e-mail campaigns. Certain metrics include an increase in ROI, conversions, list growth, etc. Pitch your topic with ease and precision using this E Mail Marketing Performance Goals Achieved Survey Analysis Sample PDF. This layout presents information on E Mail Marketing Performance, Goals Achieved Survey Analysis. It is also available for immediate download and adjustment. So, changes can be made in the color, design, graphics or any other component to create a unique layout.
Google Adwords Strategic Campaign Performance Tracking Dashboard Icons PDF
This slide showcases KPI dashboard for real time tracking of performance metrics for google adwords campaign. It includes elements such as cost interactions, impressions, device, etc. Showcasing this set of slides titled Google Adwords Strategic Campaign Performance Tracking Dashboard Icons PDF. The topics addressed in these templates are Campaign Performance Device, Interaction Rate Cost Device, Daily Cost Device. All the content presented in this PPT design is completely editable. Download it and make adjustments in color, background, font etc. as per your unique business setting.

Dashboard To Measure Performance Of E Commerce Marketing Strategies Structure PDF
This following slide displays the key metrics that can help an organization to measure effectiveness of e-commerce strategies. These can be revenue generated using e-commerce platform, conversion rates etc.Create an editable Dashboard To Measure Performance Of E Commerce Marketing Strategies Structure PDF that communicates your idea and engages your audience. Whether you are presenting a business or an educational presentation, pre-designed presentation templates help save time. Dashboard To Measure Performance Of E Commerce Marketing Strategies Structure PDF is highly customizable and very easy to edit, covering many different styles from creative to business presentations. Slidegeeks has creative team members who have crafted amazing templates. So, go and get them without any delay.

Online Marketing Techniques For Acquiring Clients Dashboard To Measure Performance Information PDF
This following slide displays the key metrics that can help an organization to measure effectiveness of social media strategies. These can be leads generated, leads by region, web traffic targets etc. Take your projects to the next level with our ultimate collection of Online Marketing Techniques For Acquiring Clients Dashboard To Measure Performance Information PDF. Slidegeeks has designed a range of layouts that are perfect for representing task or activity duration, keeping track of all your deadlines at a glance. Tailor these designs to your exact needs and give them a truly corporate look with your own brand colors they will make your projects stand out from the rest.
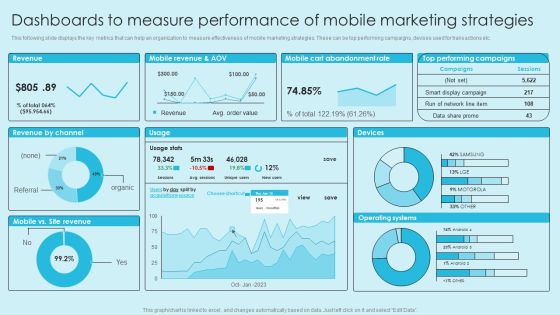
Online Marketing Techniques For Acquiring Clients Dashboards To Measure Performance Of Mobile Marketing Diagrams PDF
This following slide displays the key metrics that can help an organization to measure effectiveness of mobile marketing strategies. These can be top performing campaigns, devises used for transactions etc. Find a pre designed and impeccable Online Marketing Techniques For Acquiring Clients Dashboards To Measure Performance Of Mobile Marketing Diagrams PDF. The templates can ace your presentation without additional effort. You can download these easy to edit presentation templates to make your presentation stand out from others. So, what are you waiting for. Download the template from Slidegeeks today and give a unique touch to your presentation.

Implementing Digital Marketing Dashboard To Measure Performance Of Social Media Professional PDF
This following slide displays the key metrics that can help an organization to measure effectiveness of social media strategies. These can be leads generated, leads by region, web traffic targets etc. Want to ace your presentation in front of a live audience Our Implementing Digital Marketing Dashboard To Measure Performance Of Social Media Professional PDF can help you do that by engaging all the users towards you. Slidegeeks experts have put their efforts and expertise into creating these impeccable powerpoint presentations so that you can communicate your ideas clearly. Moreover, all the templates are customizable, and easy-to-edit and downloadable. Use these for both personal and commercial use.
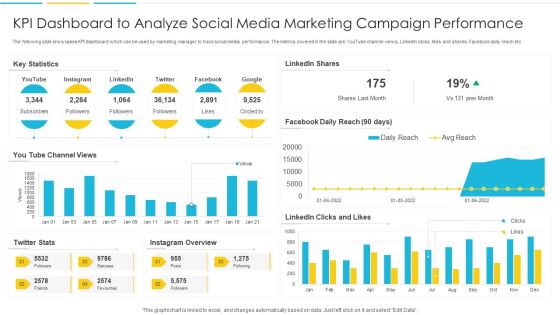
KPI Dashboard To Analyze Social Media Marketing Campaign Performance Rules PDF
The following slide showcases KPI dashboard which can be used by marketing manager to track social media performance. The metrics covered in the slide are YouTube channel views, LinkedIn clicks, likes and shares, Facebook daily reach etc. Pitch your topic with ease and precision using this KPI Dashboard To Analyze Social Media Marketing Campaign Performance Rules PDF. This layout presents information on Dashboard, Marketing, Analyze. It is also available for immediate download and adjustment. So, changes can be made in the color, design, graphics or any other component to create a unique layout.

Marketing KPI Dashboard With Lead To Conversion Structure PDF
The following slide showcases KPI dashboard which can be used to monitor the performance of marketing campaign. The key metrics mentioned in the slide are average daily impressions, cost per click, leads to conversion rate, cost per conversion etc. Showcasing this set of slides titled Marketing KPI Dashboard With Lead To Conversion Structure PDF. The topics addressed in these templates are Impressions, Optimization, Cost. All the content presented in this PPT design is completely editable. Download it and make adjustments in color, background, font etc. as per your unique business setting.

Execution Of Effective Paid Media Advertising Strategies Kpi Dashboard To Analyze Paid Marketing Campaigns Formats PDF
This slide showcases the parameters that would help the business organization to evaluate paid media marketing performance. It includes metrics such as cost per acquisition CPA, monthly conversion by channel, ad impressions, daily paid social clicks, etc. There are so many reasons you need a Execution Of Effective Paid Media Advertising Strategies Kpi Dashboard To Analyze Paid Marketing Campaigns Formats PDF. The first reason is you cannot spend time making everything from scratch, Thus, Slidegeeks has made presentation templates for you too. You can easily download these templates from our website easily.

Brand Awareness Measuring Kpi Dashboard Brand And Equity Evaluation Techniques Ideas PDF
Mentioned slide showcases KPI dashboard that can be used to check the financial performance of a brand. Metrics covered in the dashboard are return on assets, working capital ratio, return on equity etc.From laying roadmaps to briefing everything in detail, our templates are perfect for you. You can set the stage with your presentation slides. All you have to do is download these easy-to-edit and customizable templates. Brand Awareness Measuring Kpi Dashboard Brand And Equity Evaluation Techniques Ideas PDF will help you deliver an outstanding performance that everyone would remember and praise you for. Do download this presentation today.
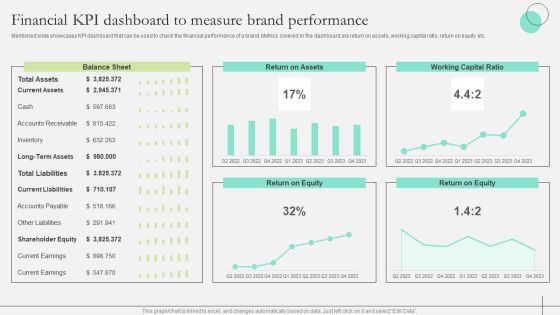
Comprehensive Guide To Strengthen Brand Equity Financial KPI Dashboard Measure Brand Structure PDF
Mentioned slide showcases KPI dashboard that can be used to check the financial performance of a brand. Metrics covered in the dashboard are return on assets, working capital ratio, return on equity etc. Take your projects to the next level with our ultimate collection of Comprehensive Guide To Strengthen Brand Equity Financial KPI Dashboard Measure Brand Structure PDF. Slidegeeks has designed a range of layouts that are perfect for representing task or activity duration, keeping track of all your deadlines at a glance. Tailor these designs to your exact needs and give them a truly corporate look with your own brand colors they will make your projects stand out from the rest
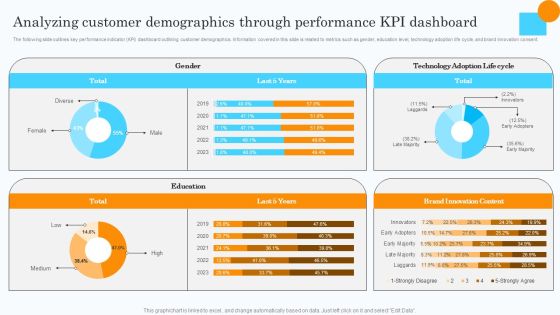
Market Research Assessment Of Target Market Requirements Analyzing Customer Demographics Clipart PDF
The following slide outlines key performance indicator KPI dashboard outlining customer demographics. Information covered in this slide is related to metrics such as gender, education level, technology adoption life cycle, and brand innovation consent. There are so many reasons you need a Market Research Assessment Of Target Market Requirements Analyzing Customer Demographics Clipart PDF. The first reason is you cannot spend time making everything from scratch, Thus, Slidegeeks has made presentation templates for you too. You can easily download these templates from our website easily.

Analyzing Customer Demographics Through Performance KPI Dashboard Graphics PDF
The following slide outlines key performance indicator KPI dashboard outlining customer demographics. Information covered in this slide is related to metrics such as gender, education level, technology adoption life cycle, and brand innovation consent. Find a pre designed and impeccable Analyzing Customer Demographics Through Performance KPI Dashboard Graphics PDF. The templates can ace your presentation without additional effort. You can download these easy to edit presentation templates to make your presentation stand out from others. So, what are you waiting for Download the template from Slidegeeks today and give a unique touch to your presentation.
Kpis To Test And Iterate Customer Segmentation Ppt Icon Professional PDF
This slide presents various metrics for test and monitor effectiveness of customer segmentation and change marketing strategy with changed customer requirements. It highlights KPIs such as cohort segmentation, user churn segmentation, customer lifetime value segmentation, etc. The best PPT templates are a great way to save time, energy, and resources. Slidegeeks have 100 percent editable powerpoint slides making them incredibly versatile. With these quality presentation templates, you can create a captivating and memorable presentation by combining visually appealing slides and effectively communicating your message. Download Kpis To Test And Iterate Customer Segmentation Ppt Icon Professional PDF from Slidegeeks and deliver a wonderful presentation.

Iot And Digital Twin To Reduce Costs Post Covid Hype Cycle For Transforming Supply Chain Functions Portrait PDF
This slide shows the hype cycle for transforming supply chain functions which depicts the advancement in technological expectations with the time. Deliver an awe inspiring pitch with this creative iot and digital twin to reduce costs post covid hype cycle for transforming supply chain functions portrait pdf bundle. Topics like risk management, center of excellence, diagnostic analytics, descriptive analytics, metrics and measures can be discussed with this completely editable template. It is available for immediate download depending on the needs and requirements of the user.
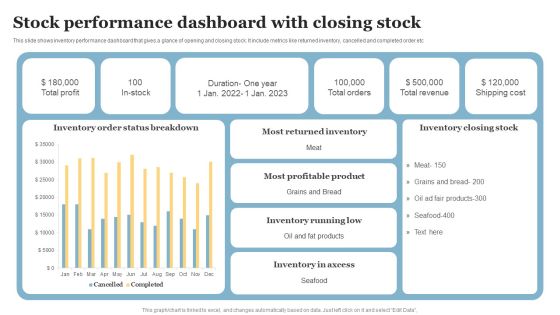
Stock Performance Dashboard With Closing Stock Diagrams PDF
This slide shows inventory performance dashboard that gives a glance of opening and closing stock. It include metrics like returned inventory, cancelled and completed order etc. Pitch your topic with ease and precision using this Stock Performance Dashboard With Closing Stock Diagrams PDF. This layout presents information on Most Returned Inventory, Most Profitable Product, Inventory Running Low. It is also available for immediate download and adjustment. So, changes can be made in the color, design, graphics or any other component to create a unique layout.
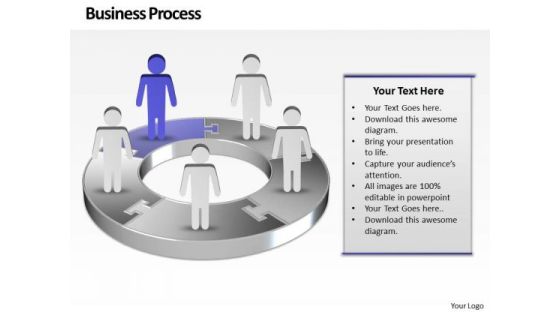
Ppt Purple Men Standing On Free Concept Pie PowerPoint Presentation Chart Templates
PPT purple men standing on free concept pie powerpoint presentation chart Templates-Use this Circular Arrow diagram to show activities that are related to the business plan metrics and monitor the results to determine if the business plan is proceeding as planned.-PPT purple men standing on free concept pie powerpoint presentation chart Templates-3d, arrow, background, blue, chart, circle, circular, clipart, colorful, connection, continuity, cycle, cyclic, diagram, direction, flow, graph, icon, illustration, isolated, loop, motion, process, progress, recycle, ring, round, step, sticker, symbol, teamwork, template, turn, vector

Ppt Team Effort Person Standing Yellow Piece Of Chart PowerPoint Ks2 Templates
PPT team effort person standing yellow piece of chart PowerPoint ks2 Templates-Use this Circular Arrow diagram to show activities that are related to the business plan metrics and monitor the results to determine if the business plan is proceeding as planned. You can apply other 3D Styles and shapes to the slide to enhance your presentations.-PPT team effort person standing yellow piece of chart PowerPoint ks2 Templates-arrow, bar, business, businessman, candidate, cartoon, character, chart, circle, circular, client, communication, company, concept, diagram, finance, financial, flow, growth, human, illustration, increase, information, iteration, man, market, marketing, process, processing, profit, sales, statistics, stats, success, target
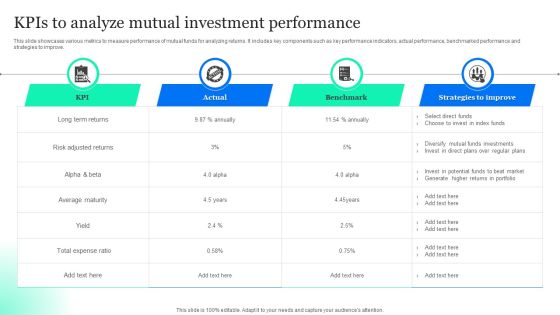
Kpis To Analyze Mutual Investment Performance Pictures PDF
This slide showcases various metrics to measure performance of mutual funds for analyzing returns. It includes key components such as key performance indicators, actual performance, benchmarked performance and strategies to improve. Pitch your topic with ease and precision using this Kpis To Analyze Mutual Investment Performance Pictures PDF. This layout presents information on Select Direct Funds, Choose Invest Index Funds, Diversify Mutual Funds. It is also available for immediate download and adjustment. So, changes can be made in the color, design, graphics or any other component to create a unique layout.

Dashboard To Measure Performance Of E Commerce Retail Business Growth Marketing Techniques Icons PDF
This following slide displays the key metrics that can help an organization to measure effectiveness of e-commerce strategies. These can be revenue generated using e-commerce platform, conversion rates etc. If your project calls for a presentation, then Slidegeeks is your go to partner because we have professionally designed, easy to edit templates that are perfect for any presentation. After downloading, you can easily edit Dashboard To Measure Performance Of E Commerce Retail Business Growth Marketing Techniques Icons PDF and make the changes accordingly. You can rearrange slides or fill them with different images. Check out all the handy templates
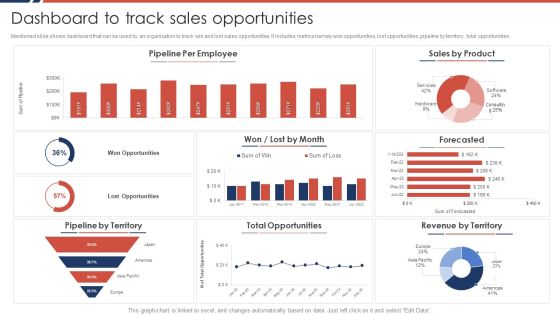
Effective Sales Plan For New Product Introduction In Market Dashboard To Track Sales Opportunities Formats PDF
Mentioned slide shows dashboard that can be used by an organization to track win and lost sales opportunities. It includes metrics namely won opportunities, lost opportunities, pipeline by territory, total opportunities.Deliver an awe inspiring pitch with this creative Effective Sales Plan For New Product Introduction In Market Dashboard To Track Sales Opportunities Formats PDF bundle. Topics like Pipeline Employee, Total Opportunities, Revenue Territory can be discussed with this completely editable template. It is available for immediate download depending on the needs and requirements of the user.

CRM System Deployment Plan CRM Dashboard For Tracking Sales Pipeline Pictures PDF
This slide covers the CRM KPI dashboard for monitoring lead status in the sales funnel. It includes metrics such as open pipeline value, open pipeline by product package, pipeline value forecast, etc. Deliver an awe inspiring pitch with this creative CRM System Deployment Plan CRM Dashboard For Tracking Sales Pipeline Pictures PDF bundle. Topics like Pipeline Value Forecast, Open Pipeline Value, Branding can be discussed with this completely editable template. It is available for immediate download depending on the needs and requirements of the user.
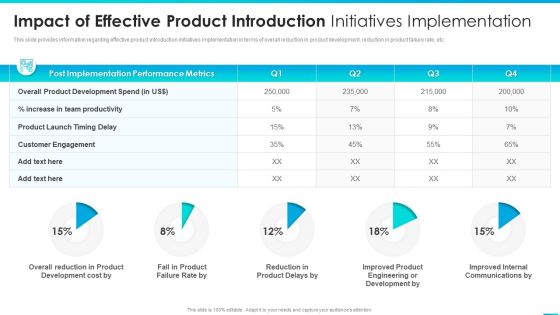
Managing Successful Product Launch To Market Impact Of Effective Product Introduction Initiatives Implementation Designs PDF
This slide provides information regarding effective product introduction initiatives implementation in terms of overall reduction in product development, reduction in product failure rate, etc. Deliver and pitch your topic in the best possible manner with this managing successful product launch to market impact of effective product introduction initiatives implementation designs pdf. Use them to share invaluable insights on customer engagement, product development, post implementation, performance metrics and impress your audience. This template can be altered and modified as per your expectations. So, grab it now.
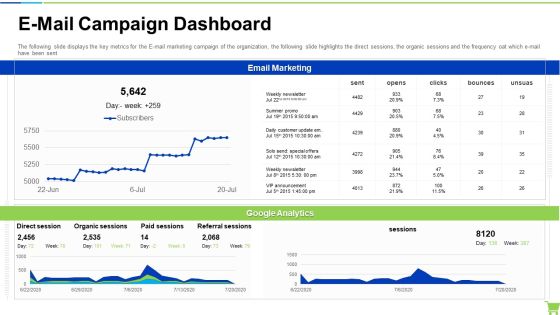
Developing And Controlling B2b Marketing Plan E-Mail Campaign Dashboard Portrait PDF
The following slide displays the key metrics for the E mail marketing campaign of the organization, the following slide highlights the direct sessions, the organic sessions and the frequency oat which e-mail have been sent. Deliver and pitch your topic in the best possible manner with this developing and controlling b2b marketing plan e-mail campaign dashboard portrait pdf. Use them to share invaluable insights on email marketing, google analytics and impress your audience. This template can be altered and modified as per your expectations. So, grab it now.
 Home
Home