Program Management Dashboard
Improving Buyer Journey Through Strategic Customer Engagement Social Media Engagement Tracking Dashboard Structure PDF
This slide showcases a dashboard highlighting the customer engagement through social sites. it includes KPIs such as total website traffics, site revenue, fans count and followers Find highly impressive Improving Buyer Journey Through Strategic Customer Engagement Social Media Engagement Tracking Dashboard Structure PDF on Slidegeeks to deliver a meaningful presentation. You can save an ample amount of time using these presentation templates. No need to worry to prepare everything from scratch because Slidegeeks experts have already done a huge research and work for you. You need to download Improving Buyer Journey Through Strategic Customer Engagement Social Media Engagement Tracking Dashboard Structure PDF for your upcoming presentation. All the presentation templates are 100 percent editable and you can change the color and personalize the content accordingly. Download now
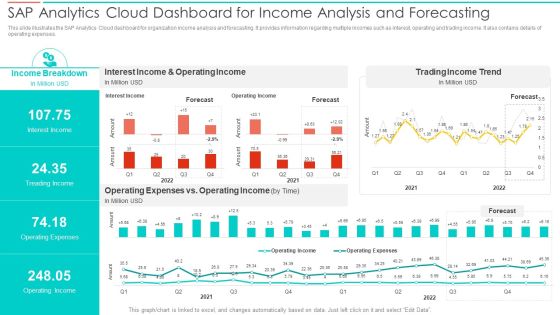
SAC Planning And Implementation SAP Analytics Cloud Dashboard For Income Analysis Summary PDF
This slide illustrates the SAP Analytics Cloud dashboard for organization income analysis and forecasting. It provides information regarding multiple incomes such as interest, operating and trading income. It also contains details of operating expenses. Deliver an awe inspiring pitch with this creative SAC Planning And Implementation SAP Analytics Cloud Dashboard For Income Analysis Summary PDF bundle. Topics like Income Breakdown, Interest Income, Operating Income, Trading Income Trend can be discussed with this completely editable template. It is available for immediate download depending on the needs and requirements of the user.
Net Promoter Score Dashboard Net Promoter Score Tracker Ppt Graphics PDF
Deliver and pitch your topic in the best possible manner with this net promoter score dashboard net promoter score tracker ppt graphics pdf. Use them to share invaluable insights on net promoter score tracker, detractors, passives, promoters and impress your audience. This template can be altered and modified as per your expectations. So, grab it now.
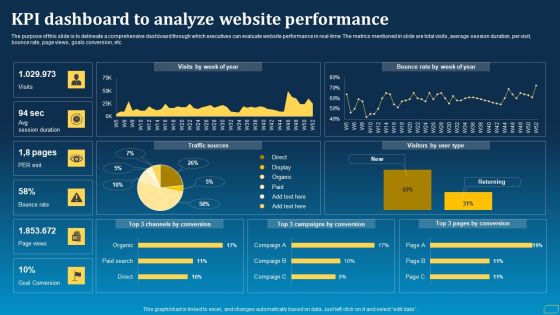
Direct Marketing Techniques To Enhance Business Presence KPI Dashboard To Analyze Website Performance Background PDF
The purpose of this slide is to delineate a comprehensive dashboard through which executives can evaluate website performance in real-time. The metrics mentioned in slide are total visits, average session duration, per visit, bounce rate, page views, goals conversion, etc. Crafting an eye catching presentation has never been more straightforward. Let your presentation shine with this tasteful yet straightforward Direct Marketing Techniques To Enhance Business Presence KPI Dashboard To Analyze Website Performance Background PDF template. It offers a minimalistic and classy look that is great for making a statement. The colors have been employed intelligently to add a bit of playfulness while still remaining professional. Construct the ideal Direct Marketing Techniques To Enhance Business Presence KPI Dashboard To Analyze Website Performance Background PDF that effortlessly grabs the attention of your audience. Begin now and be certain to wow your customers.

Direct Marketing Techniques To Enhance Business Presence Social Media Marketing Dashboard To Evaluate Rules PDF
The purpose of this slide is to highlight key performance indicator KPI dashboard which will assist marketers to analyze company performance across social media platforms. The kpis outlined in slide are social media followers, page likes, etc. Make sure to capture your audiences attention in your business displays with our gratis customizable Direct Marketing Techniques To Enhance Business Presence Social Media Marketing Dashboard To Evaluate Rules PDF. These are great for business strategies, office conferences, capital raising or task suggestions. If you desire to acquire more customers for your tech business and ensure they stay satisfied, create your own sales presentation with these plain slides.
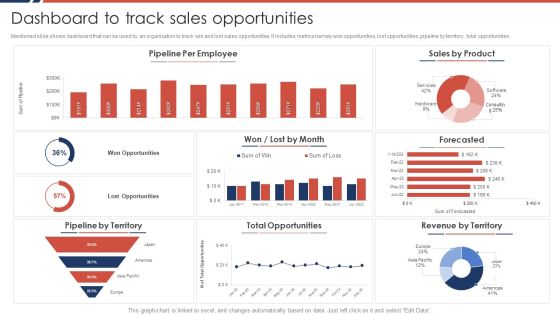
Effective Sales Plan For New Product Introduction In Market Dashboard To Track Sales Opportunities Formats PDF
Mentioned slide shows dashboard that can be used by an organization to track win and lost sales opportunities. It includes metrics namely won opportunities, lost opportunities, pipeline by territory, total opportunities.Deliver an awe inspiring pitch with this creative Effective Sales Plan For New Product Introduction In Market Dashboard To Track Sales Opportunities Formats PDF bundle. Topics like Pipeline Employee, Total Opportunities, Revenue Territory can be discussed with this completely editable template. It is available for immediate download depending on the needs and requirements of the user.
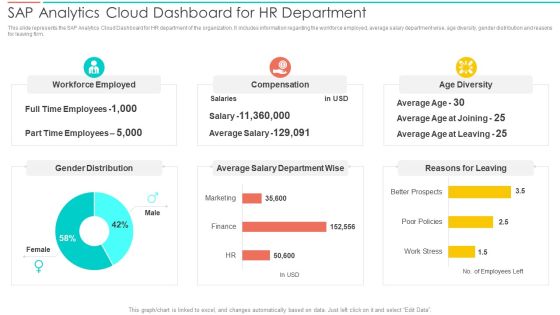
SAC Planning And Implementation SAP Analytics Cloud Dashboard For Hr Department Inspiration PDF
This slide represents the SAP Analytics Cloud Dashboard for HR department of the organization. It includes information regarding the workforce employed, average salary department wise, age diversity, gender distribution and reasons for leaving firm. Deliver and pitch your topic in the best possible manner with this SAC Planning And Implementation SAP Analytics Cloud Dashboard For Hr Department Inspiration PDF. Use them to share invaluable insights on Workforce Employed, Compensation, Age Diversity and impress your audience. This template can be altered and modified as per your expectations. So, grab it now.

Sales Performance Monitoring Dashboard With Customer Details Ppt Infographics Themes PDF
This slide illustrates sales performance tracking dashboard with critical information. It provides information about customer details, invoice, earnings, leads, pending delivery, revenue, etc. Pitch your topic with ease and precision using this Sales Performance Monitoring Dashboard With Customer Details Ppt Infographics Themes PDF. This layout presents information on Todays Revenue, Today Delivered, Pending Delivery, Total Leads. It is also available for immediate download and adjustment. So, changes can be made in the color, design, graphics or any other component to create a unique layout.
Enterprise SMS Marketing Subscribers Tracking Dashboard Ppt PowerPoint Presentation File Slides PDF
This slide represents the key metrics dashboard to monito and track the SMS marketing subscribers of the enterprise. It includes details related to KPIs such as total subscribers, new subscribers, total unsubscribes etc. Do you have an important presentation coming up Are you looking for something that will make your presentation stand out from the rest Look no further than Enterprise SMS Marketing Subscribers Tracking Dashboard Ppt PowerPoint Presentation File Slides PDF. With our professional designs, you can trust that your presentation will pop and make delivering it a smooth process. And with Slidegeeks, you can trust that your presentation will be unique and memorable. So why wait Grab Enterprise SMS Marketing Subscribers Tracking Dashboard Ppt PowerPoint Presentation File Slides PDF today and make your presentation stand out from the rest.
Enterprise SMS Marketing Subscribers Tracking Dashboard Ppt PowerPoint Presentation Diagram PDF
This slide represents the key metrics dashboard to monito and track the SMS marketing subscribers of the enterprise. It includes details related to KPIs such as total subscribers, new subscribers, total unsubscribes etc. Do you have an important presentation coming up Are you looking for something that will make your presentation stand out from the rest Look no further than Enterprise SMS Marketing Subscribers Tracking Dashboard Ppt PowerPoint Presentation Diagram PDF. With our professional designs, you can trust that your presentation will pop and make delivering it a smooth process. And with Slidegeeks, you can trust that your presentation will be unique and memorable. So why wait Grab Enterprise SMS Marketing Subscribers Tracking Dashboard Ppt PowerPoint Presentation Diagram PDF today and make your presentation stand out from the rest.

Lead Scoring Model Lead Scoring Dashboard Engagement Ppt Inspiration Ideas PDF
Deliver and pitch your topic in the best possible manner with this lead scoring model lead scoring dashboard engagement ppt inspiration ideas pdf. Use them to share invaluable insights on profile, engagement and impress your audience. This template can be altered and modified as per your expectations. So, grab it now.

Net Promoter Score Dashboard Net Promoter Score For Broadband Mobile Providers Ppt Inspiration Design Inspiration PDF
Deliver an awe-inspiring pitch with this creative net promoter score dashboard net promoter score for broadband mobile providers ppt inspiration design inspiration pdf bundle. Topics like detractors, passives, promoters can be discussed with this completely editable template. It is available for immediate download depending on the needs and requirements of the user.

Using Social Media Platforms To Enhance Dashboard For Monitoring Social Media Traffic Structure PDF
This slide shows dashboard for tracking social media traffic. It provides details about sessions, bounce rate, average time on platform, pages per visit, clicks, goals, goal conversion rate, Facebook, Instagram, YouTube, Snapchat, etc. If you are looking for a format to display your unique thoughts, then the professionally designed Using Social Media Platforms To Enhance Dashboard For Monitoring Social Media Traffic Structure PDF is the one for you. You can use it as a Google Slides template or a PowerPoint template. Incorporate impressive visuals, symbols, images, and other charts. Modify or reorganize the text boxes as you desire. Experiment with shade schemes and font pairings. Alter, share or cooperate with other people on your work. Download Using Social Media Platforms To Enhance Dashboard For Monitoring Social Media Traffic Structure PDF and find out how to give a successful presentation. Present a perfect display to your team and make your presentation unforgettable.

Cloud Dashboard For Tracking Project Sprints Ppt PowerPoint Presentation File Layouts PDF
The following slide depicts cloud dashboard for monitoring project sprints. It provides information about sprint blockers, resolved issues, under performers, sprint health, releases, sprint burndown, etc. If you are looking for a format to display your unique thoughts, then the professionally designed Cloud Dashboard For Tracking Project Sprints Ppt PowerPoint Presentation File Layouts PDF is the one for you. You can use it as a Google Slides template or a PowerPoint template. Incorporate impressive visuals, symbols, images, and other charts. Modify or reorganize the text boxes as you desire. Experiment with shade schemes and font pairings. Alter, share or cooperate with other people on your work. Download Cloud Dashboard For Tracking Project Sprints Ppt PowerPoint Presentation File Layouts PDF and find out how to give a successful presentation. Present a perfect display to your team and make your presentation unforgettable.

Top SEO Techniques Seo Reporting Dashboard To Evaluate Website Rank Ideas PDF
The purpose of this slide is to outline mobile search engine optimization SEO reporting dashboard. It covers different metrics such as web traffic overview, total views, content overview, goal value and conversion etc. If you are looking for a format to display your unique thoughts, then the professionally designed Top SEO Techniques Seo Reporting Dashboard To Evaluate Website Rank Ideas PDF is the one for you. You can use it as a Google Slides template or a PowerPoint template. Incorporate impressive visuals, symbols, images, and other charts. Modify or reorganize the text boxes as you desire. Experiment with shade schemes and font pairings. Alter, share or cooperate with other people on your work. Download Top SEO Techniques Seo Reporting Dashboard To Evaluate Website Rank Ideas PDF and find out how to give a successful presentation. Present a perfect display to your team and make your presentation unforgettable.

Agriculture Marketing Strategy To Improve Revenue Performance Dashboard Depicting Production Global Food Market Brochure PDF
This slide provides an overview of the dashboard that exhibits the situation of the global food market. It includes production, import, exports information for wheat, maize, rice and soybean. If you are looking for a format to display your unique thoughts, then the professionally designed Agriculture Marketing Strategy To Improve Revenue Performance Dashboard Depicting Production Global Food Market Brochure PDF is the one for you. You can use it as a Google Slides template or a PowerPoint template. Incorporate impressive visuals, symbols, images, and other charts. Modify or reorganize the text boxes as you desire. Experiment with shade schemes and font pairings. Alter, share or cooperate with other people on your work. Download Agriculture Marketing Strategy To Improve Revenue Performance Dashboard Depicting Production Global Food Market Brochure PDF and find out how to give a successful presentation. Present a perfect display to your team and make your presentation unforgettable.

Categories Of Segmenting And Profiling Customers Customer Demographics Segmentation Dashboard Guidelines PDF
This slide showcases a dashboard for segmenting customers based on demographics factors. It includes key components such as make population by age, female population by age, number of male customers and number of female customers. If you are looking for a format to display your unique thoughts, then the professionally designed Categories Of Segmenting And Profiling Customers Customer Demographics Segmentation Dashboard Guidelines PDF is the one for you. You can use it as a Google Slides template or a PowerPoint template. Incorporate impressive visuals, symbols, images, and other charts. Modify or reorganize the text boxes as you desire. Experiment with shade schemes and font pairings. Alter, share or cooperate with other people on your work. Download Categories Of Segmenting And Profiling Customers Customer Demographics Segmentation Dashboard Guidelines PDF and find out how to give a successful presentation. Present a perfect display to your team and make your presentation unforgettable.
Effective Lead Generation For Higher Conversion Rates Dashboard For Tracking Leads Generated From Various Guidelines PDF
This slide covers the KPI dashboard for tracking metrics such as leads, ACV wins, customer acquisition cost, click-through rate, and cost per conversion. It also includes leads per various campaigns such as social media, paid marketing, email marketing, etc. If you are looking for a format to display your unique thoughts, then the professionally designed Effective Lead Generation For Higher Conversion Rates Dashboard For Tracking Leads Generated From Various Guidelines PDF is the one for you. You can use it as a Google Slides template or a PowerPoint template. Incorporate impressive visuals, symbols, images, and other charts. Modify or reorganize the text boxes as you desire. Experiment with shade schemes and font pairings. Alter, share or cooperate with other people on your work. Download Effective Lead Generation For Higher Conversion Rates Dashboard For Tracking Leads Generated From Various Guidelines PDF and find out how to give a successful presentation. Present a perfect display to your team and make your presentation unforgettable.

Dashboard To Identify Brand At Declining Stage With Low Sales Demonstration PDF
This slide covers dashboard to track brand with lowest sales. The purpose of this template is to provide information based on revenue generated annually along with total units sold. It includes tracking based on monthly revenue, unit sales, etc. If you are looking for a format to display your unique thoughts, then the professionally designed Dashboard To Identify Brand At Declining Stage With Low Sales Demonstration PDF is the one for you. You can use it as a Google Slides template or a PowerPoint template. Incorporate impressive visuals, symbols, images, and other charts. Modify or reorganize the text boxes as you desire. Experiment with shade schemes and font pairings. Alter, share or cooperate with other people on your work. Download Dashboard To Identify Brand At Declining Stage With Low Sales Demonstration PDF and find out how to give a successful presentation. Present a perfect display to your team and make your presentation unforgettable.
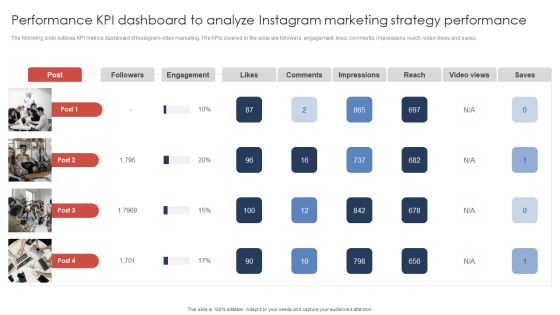
Performance Kpi Dashboard To Analyze Instagram Marketing Strategy Performance Microsoft PDF
The following slide outlines KPI metrics dashboard of Instagram video marketing. The KPIs covered in the slide are followers, engagement, likes, comments, impressions, reach, video views and saves. Find highly impressive Performance Kpi Dashboard To Analyze Instagram Marketing Strategy Performance Microsoft PDF on Slidegeeks to deliver a meaningful presentation. You can save an ample amount of time using these presentation templates. No need to worry to prepare everything from scratch because Slidegeeks experts have already done a huge research and work for you. You need to download Performance Kpi Dashboard To Analyze Instagram Marketing Strategy Performance Microsoft PDF for your upcoming presentation. All the presentation templates are 100 percent editable and you can change the color and personalize the content accordingly. Download now.

Techniques To Optimize UX Dashboard Depicting Performance Metrics Of Customer Clipart PDF
This slide showcases dashboard depicting major customer service KPIs. The performance metrics covered are search exit rate, CSAT, average first response time, tickets solved, etc. Formulating a presentation can take up a lot of effort and time, so the content and message should always be the primary focus. The visuals of the PowerPoint can enhance the presenters message, so our Techniques To Optimize UX Dashboard Depicting Performance Metrics Of Customer Clipart PDF was created to help save time. Instead of worrying about the design, the presenter can concentrate on the message while our designers work on creating the ideal templates for whatever situation is needed. Slidegeeks has experts for everything from amazing designs to valuable content, we have put everything into Techniques To Optimize UX Dashboard Depicting Performance Metrics Of Customer Clipart PDF.

Dashboard For Cloud Storage Tracking Ppt PowerPoint Presentation File Layouts PDF
This slide represents the dashboard for cloud storage tracking by covering details of users, available workspaces, shared files, downloads, uploads, and moves. If you are looking for a format to display your unique thoughts, then the professionally designed Dashboard For Cloud Storage Tracking Ppt PowerPoint Presentation File Layouts PDF is the one for you. You can use it as a Google Slides template or a PowerPoint template. Incorporate impressive visuals, symbols, images, and other charts. Modify or reorganize the text boxes as you desire. Experiment with shade schemes and font pairings. Alter, share or cooperate with other people on your work. Download Dashboard For Cloud Storage Tracking Ppt PowerPoint Presentation File Layouts PDF and find out how to give a successful presentation. Present a perfect display to your team and make your presentation unforgettable.
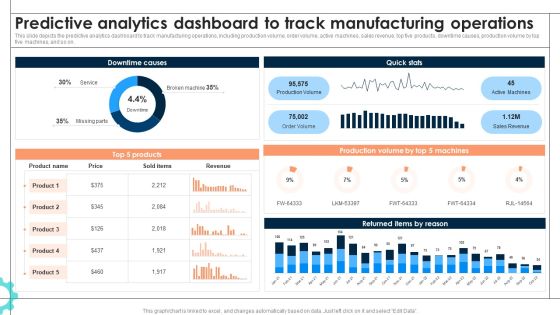
Intelligent Manufacturing Predictive Analytics Dashboard To Track Manufacturing Operations Information PDF
This slide depicts the predictive analytics dashboard to track manufacturing operations, including production volume, order volume, active machines, sales revenue, top five products, downtime causes, production volume by top five machines, and so on. If you are looking for a format to display your unique thoughts, then the professionally designed Intelligent Manufacturing Predictive Analytics Dashboard To Track Manufacturing Operations Information PDF is the one for you. You can use it as a Google Slides template or a PowerPoint template. Incorporate impressive visuals, symbols, images, and other charts. Modify or reorganize the text boxes as you desire. Experiment with shade schemes and font pairings. Alter, share or cooperate with other people on your work. Download Intelligent Manufacturing Predictive Analytics Dashboard To Track Manufacturing Operations Information PDF and find out how to give a successful presentation. Present a perfect display to your team and make your presentation unforgettable.
Product Branding To Enhance Product Branding Performance Tracking Dashboard Graphics PDF
This slide provides information regarding product branding performance tracking dashboard in terms of revenues, new customers, customer satisfaction rate. If you are looking for a format to display your unique thoughts, then the professionally designed Product Branding To Enhance Product Branding Performance Tracking Dashboard Graphics PDF is the one for you. You can use it as a Google Slides template or a PowerPoint template. Incorporate impressive visuals, symbols, images, and other charts. Modify or reorganize the text boxes as you desire. Experiment with shade schemes and font pairings. Alter, share or cooperate with other people on your work. Download Product Branding To Enhance Product Branding Performance Tracking Dashboard Graphics PDF and find out how to give a successful presentation. Present a perfect display to your team and make your presentation unforgettable.
Maximizing Brand Growth With Umbrella Branding Activities Corporate Branding Performance Tracking Dashboard Summary PDF
This slide provides information regarding corporate branding performance tracking dashboard in terms of leads, conversion metrics, web traffic, etc. If you are looking for a format to display your unique thoughts, then the professionally designed Maximizing Brand Growth With Umbrella Branding Activities Corporate Branding Performance Tracking Dashboard Summary PDF is the one for you. You can use it as a Google Slides template or a PowerPoint template. Incorporate impressive visuals, symbols, images, and other charts. Modify or reorganize the text boxes as you desire. Experiment with shade schemes and font pairings. Alter, share or cooperate with other people on your work. Download Maximizing Brand Growth With Umbrella Branding Activities Corporate Branding Performance Tracking Dashboard Summary PDF and find out how to give a successful presentation. Present a perfect display to your team and make your presentation unforgettable.

Iot Integration In Manufacturing Predictive Analytics Dashboard To Track Manufacturing Operations Background PDF
This slide depicts the predictive analytics dashboard to track manufacturing operations, including production volume, order volume, active machines, sales revenue, top five products, downtime causes, production volume by top five machines, and so on. If you are looking for a format to display your unique thoughts, then the professionally designed Iot Integration In Manufacturing Predictive Analytics Dashboard To Track Manufacturing Operations Background PDF is the one for you. You can use it as a Google Slides template or a PowerPoint template. Incorporate impressive visuals, symbols, images, and other charts. Modify or reorganize the text boxes as you desire. Experiment with shade schemes and font pairings. Alter, share or cooperate with other people on your work. Download Iot Integration In Manufacturing Predictive Analytics Dashboard To Track Manufacturing Operations Background PDF and find out how to give a successful presentation. Present a perfect display to your team and make your presentation unforgettable.
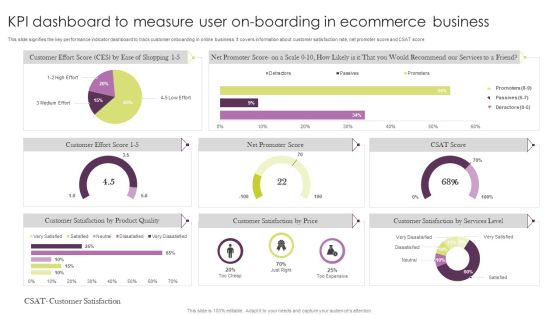
KPI Dashboard To Measure User On Boarding In Ecommerce Business Microsoft PDF
This slide signifies the key performance indicator dashboard to track customer onboarding in online business. It covers information about customer satisfaction rate, net promoter score and CSAT score. Showcasing this set of slides titled KPI Dashboard To Measure User On Boarding In Ecommerce Business Microsoft PDF. The topics addressed in these templates are User Boarding Icon, Develop Ecommerce Business. All the content presented in this PPT design is completely editable. Download it and make adjustments in color, background, font etc. as per your unique business setting.

Guide To Develop And Estimate Brand Value Financial KPI Dashboard To Measure Brand Performance Formats PDF
Mentioned slide showcases KPI dashboard that can be used to check the financial performance of a brand. Metrics covered in the dashboard are return on assets, working capital ratio, return on equity etc.Coming up with a presentation necessitates that the majority of the effort goes into the content and the message you intend to convey. The visuals of a PowerPoint presentation can only be effective if it supplements and supports the story that is being told. Keeping this in mind our experts created Guide To Develop And Estimate Brand Value Financial KPI Dashboard To Measure Brand Performance Formats PDF to reduce the time that goes into designing the presentation. This way, you can concentrate on the message while our designers take care of providing you with the right template for the situation.
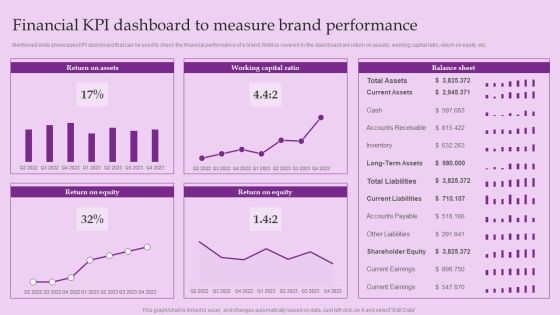
Financial KPI Dashboard To Measure Brand Performance Brand And Equity Evaluation Techniques Elements PDF
Mentioned slide showcases KPI dashboard that can be used to check the financial performance of a brand. Metrics covered in the dashboard are return on assets, working capital ratio, return on equity etc.Coming up with a presentation necessitates that the majority of the effort goes into the content and the message you intend to convey. The visuals of a PowerPoint presentation can only be effective if it supplements and supports the story that is being told. Keeping this in mind our experts created Financial KPI Dashboard To Measure Brand Performance Brand And Equity Evaluation Techniques Elements PDF to reduce the time that goes into designing the presentation. This way, you can concentrate on the message while our designers take care of providing you with the right template for the situation.
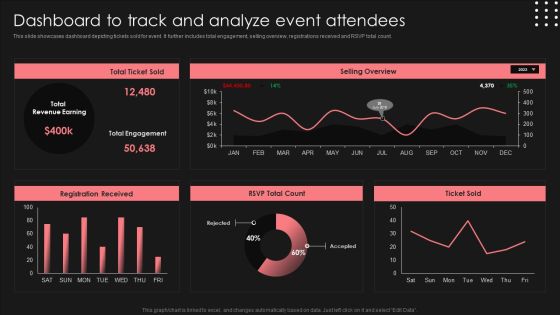
Positive Impact Of Effective Dashboard To Track And Analyze Event Attendees Elements PDF
This slide showcases dashboard depicting tickets sold for event. It further includes total engagement, selling overview, registrations received and RSVP total count. Formulating a presentation can take up a lot of effort and time, so the content and message should always be the primary focus. The visuals of the PowerPoint can enhance the presenters message, so our Positive Impact Of Effective Dashboard To Track And Analyze Event Attendees Elements PDF was created to help save time. Instead of worrying about the design, the presenter can concentrate on the message while our designers work on creating the ideal templates for whatever situation is needed. Slidegeeks has experts for everything from amazing designs to valuable content, we have put everything intoPositive Impact Of Effective Dashboard To Track And Analyze Event Attendees Elements PDF.
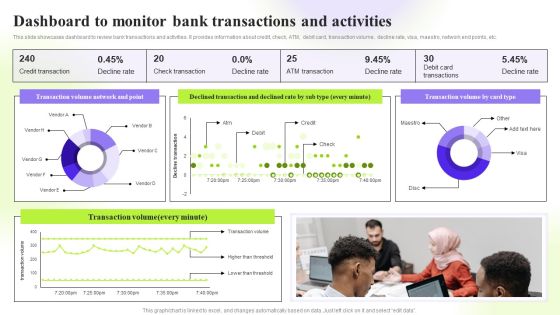
Techniques To Monitor Transactions Dashboard To Monitor Bank Transactions And Activities Introduction PDF
This slide showcases dashboard to review bank transactions and activities. It provides information about credit, check, ATM, debit card, transaction volume, decline rate, visa, maestro, network end points, etc. Find highly impressive Techniques To Monitor Transactions Dashboard To Monitor Bank Transactions And Activities Introduction PDF on Slidegeeks to deliver a meaningful presentation. You can save an ample amount of time using these presentation templates. No need to worry to prepare everything from scratch because Slidegeeks experts have already done a huge research and work for you. You need to download Techniques To Monitor Transactions Dashboard To Monitor Bank Transactions And Activities Introduction PDF for your upcoming presentation. All the presentation templates are 100 percent editable and you can change the color and personalize the content accordingly. Download now.

Customer Segmentation Dashboard To Monitor Results Ppt PowerPoint Presentation File Deck PDF
The following slide showcases a dashboard to monitor customer segmentation based on similar traits and characteristics. It highlights elements such as total customer in each segments, segments description, segment characteristics and search customer by ID. Formulating a presentation can take up a lot of effort and time, so the content and message should always be the primary focus. The visuals of the PowerPoint can enhance the presenters message, so our Customer Segmentation Dashboard To Monitor Results Ppt PowerPoint Presentation File Deck PDF was created to help save time. Instead of worrying about the design, the presenter can concentrate on the message while our designers work on creating the ideal templates for whatever situation is needed. Slidegeeks has experts for everything from amazing designs to valuable content, we have put everything into Customer Segmentation Dashboard To Monitor Results Ppt PowerPoint Presentation File Deck PDF.
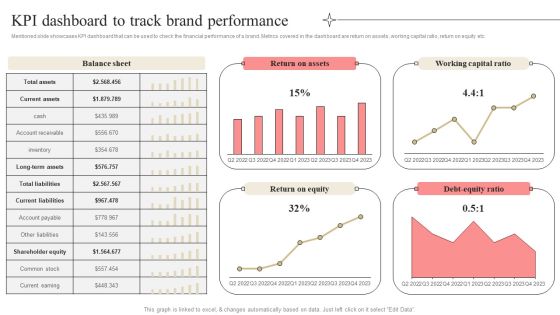
Developing Market Leading Businesses KPI Dashboard To Track Brand Performance Summary PDF
Mentioned slide showcases KPI dashboard that can be used to check the financial performance of a brand. Metrics covered in the dashboard are return on assets, working capital ratio, return on equity etc. Coming up with a presentation necessitates that the majority of the effort goes into the content and the message you intend to convey. The visuals of a PowerPoint presentation can only be effective if it supplements and supports the story that is being told. Keeping this in mind our experts created Developing Market Leading Businesses KPI Dashboard To Track Brand Performance Summary PDF to reduce the time that goes into designing the presentation. This way, you can concentrate on the message while our designers take care of providing you with the right template for the situation.

Lean Manufacturing Dashboard Showcasing Production Progress Ppt PowerPoint Presentation File Model PDF
This slide represents lean manufacturing dashboard showcasing production progress. It covers production volume, order volume, downtime, returned item etc. Formulating a presentation can take up a lot of effort and time, so the content and message should always be the primary focus. The visuals of the PowerPoint can enhance the presenters message, so our Lean Manufacturing Dashboard Showcasing Production Progress Ppt PowerPoint Presentation File Model PDF was created to help save time. Instead of worrying about the design, the presenter can concentrate on the message while our designers work on creating the ideal templates for whatever situation is needed. Slidegeeks has experts for everything from amazing designs to valuable content, we have put everything into Lean Manufacturing Dashboard Showcasing Production Progress Ppt PowerPoint Presentation File Model PDF

People Engagement Performance Dashboard With Variables Growth Ppt Summary Example PDF
This slide shows a People Engagement Performance Dashboard with variables such as engagement score, recognition rate, satisfaction rate, company knowledge rate and other key metrics of employee engagement. Deliver and pitch your topic in the best possible manner with this people engagement performance dashboard with variables growth ppt summary example pdf. Use them to share invaluable insights on 10 key metrics of employee engagement, employee engagement score and impress your audience. This template can be altered and modified as per your expectations. So, grab it now.

People Engagement Performance Dashboard With Variables Ppt Gallery Example File PDF
This slide shows a People Engagement Performance Dashboard with variables such as engagement score, recognition rate, satisfaction rate, company knowledge rate and other key metrics of employee engagement. Deliver and pitch your topic in the best possible manner with this people engagement performance dashboard with variables ppt gallery example file pdf. Use them to share invaluable insights on personal growth, employee engagement score, employee engagement metrics and impress your audience. This template can be altered and modified as per your expectations. So, grab it now.

Deploying AML Transaction Monitoring Dashboard For Monitoring Fraud And Money Rules PDF
This slide showcases dashboard for monitoring fraudulent and money laundering transactions. It provides information about legitimacy, total transaction, unusual transactions, bank, client, investigation, in peer review, etc. Do you have an important presentation coming up Are you looking for something that will make your presentation stand out from the rest Look no further than Deploying AML Transaction Monitoring Dashboard For Monitoring Fraud And Money Rules PDF. With our professional designs, you can trust that your presentation will pop and make delivering it a smooth process. And with Slidegeeks, you can trust that your presentation will be unique and memorable. So why wait Grab Deploying AML Transaction Monitoring Dashboard For Monitoring Fraud And Money Rules PDF today and make your presentation stand out from the rest.

Deploying Revitalization Strategy Enhance Product And Service Sales Product Reposition Dashboard Highlighting Brochure PDF
This slide highlights the product reposition dashboard which showcases market share in regions, emerging markets, after repositioning planned vs actual sales and product revenue by month. Do you have an important presentation coming up Are you looking for something that will make your presentation stand out from the rest Look no further than Deploying Revitalization Strategy Enhance Product And Service Sales Product Reposition Dashboard Highlighting Brochure PDF. With our professional designs, you can trust that your presentation will pop and make delivering it a smooth process. And with Slidegeeks, you can trust that your presentation will be unique and memorable. So why wait Grab Deploying Revitalization Strategy Enhance Product And Service Sales Product Reposition Dashboard Highlighting Brochure PDF today and make your presentation stand out from the rest.

BPM Tools Application To Increase Banking Dashboard To Determine Total Loans Information PDF
Mentioned slide portrays banking dashboard providing information on total loans and deposits by region and by district. Formulating a presentation can take up a lot of effort and time, so the content and message should always be the primary focus. The visuals of the PowerPoint can enhance the presenters message, so our BPM Tools Application To Increase Banking Dashboard To Determine Total Loans Information PDF was created to help save time. Instead of worrying about the design, the presenter can concentrate on the message while our designers work on creating the ideal templates for whatever situation is needed. Slidegeeks has experts for everything from amazing designs to valuable content, we have put everything into BPM Tools Application To Increase Banking Dashboard To Determine Total Loans Information PDF.
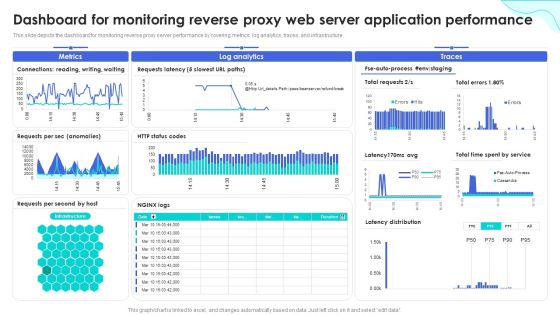
Reverse Proxy Web Server Dashboard For Monitoring Reverse Proxy Web Server Guidelines PDF
This slide depicts the dashboard for monitoring reverse proxy server performance by covering metrics, log analytics, traces, and infrastructure. Find highly impressive Reverse Proxy Web Server Dashboard For Monitoring Reverse Proxy Web Server Guidelines PDF on Slidegeeks to deliver a meaningful presentation. You can save an ample amount of time using these presentation templates. No need to worry to prepare everything from scratch because Slidegeeks experts have already done a huge research and work for you. You need to download Reverse Proxy Web Server Dashboard For Monitoring Reverse Proxy Web Server Guidelines PDF for your upcoming presentation. All the presentation templates are 100 percent editable and you can change the color and personalize the content accordingly. Download now.

BPR To Develop Operational Effectiveness Dashboard To Determine Sales Profit And Conversions Slides PDF
This slide focuses on dashboard to determine sales profits and conversions that also includes revenues, profits, number of orders placed, total customers, procured items that will help company to measure the overall business performance. Formulating a presentation can take up a lot of effort and time, so the content and message should always be the primary focus. The visuals of the PowerPoint can enhance the presenters message, so our BPR To Develop Operational Effectiveness Dashboard To Determine Sales Profit And Conversions Slides PDF was created to help save time. Instead of worrying about the design, the presenter can concentrate on the message while our designers work on creating the ideal templates for whatever situation is needed. Slidegeeks has experts for everything from amazing designs to valuable content, we have put everything into BPR To Develop Operational Effectiveness Dashboard To Determine Sales Profit And Conversions Slides PDF.

Employee Health And Safety Workplace Safety Dashboard Highlighting Injury Severity And Costs Sample PDF
This slide highlights the dashboard which showcase the critical incidents, incident cost, injury consequence, type of incident and severity level of the injury. Formulating a presentation can take up a lot of effort and time, so the content and message should always be the primary focus. The visuals of the PowerPoint can enhance the presenters message, so our Employee Health And Safety Workplace Safety Dashboard Highlighting Injury Severity And Costs Sample PDF was created to help save time. Instead of worrying about the design, the presenter can concentrate on the message while our designers work on creating the ideal templates for whatever situation is needed. Slidegeeks has experts for everything from amazing designs to valuable content, we have put everything into Employee Health And Safety Workplace Safety Dashboard Highlighting Injury Severity And Costs Sample PDF.

Utilizing Twitter For Social Media Dashboard For Twitter Marketing Campaign Mockup PDF
This slide depicts the dashboard for twitter marketing campaign providing information regarding average engagement rate, hashtag and links clicks, impressions and followers gained. Formulating a presentation can take up a lot of effort and time, so the content and message should always be the primary focus. The visuals of the PowerPoint can enhance the presenters message, so our Utilizing Twitter For Social Media Dashboard For Twitter Marketing Campaign Mockup PDF was created to help save time. Instead of worrying about the design, the presenter can concentrate on the message while our designers work on creating the ideal templates for whatever situation is needed. Slidegeeks has experts for everything from amazing designs to valuable content, we have put everything into Utilizing Twitter For Social Media Dashboard For Twitter Marketing Campaign Mockup PDF.
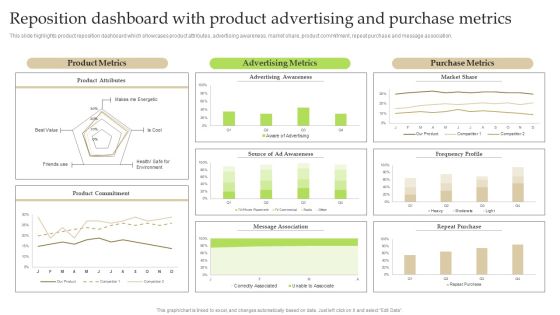
Reposition Dashboard With Product Advertising And Purchase Metrics Ppt PowerPoint Presentation File Show PDF
This slide highlights product reposition dashboard which showcases product attributes, advertising awareness, market share, product commitment, repeat purchase and message association. Formulating a presentation can take up a lot of effort and time, so the content and message should always be the primary focus. The visuals of the PowerPoint can enhance the presenters message, so our Reposition Dashboard With Product Advertising And Purchase Metrics Ppt PowerPoint Presentation File Show PDF was created to help save time. Instead of worrying about the design, the presenter can concentrate on the message while our designers work on creating the ideal templates for whatever situation is needed. Slidegeeks has experts for everything from amazing designs to valuable content, we have put everything into Reposition Dashboard With Product Advertising And Purchase Metrics Ppt PowerPoint Presentation File Show PDF
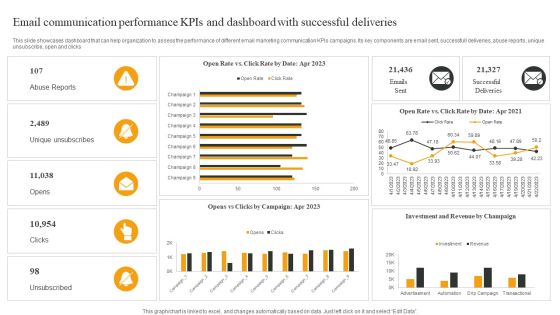
Email Communication Performance Kpis And Dashboard With Successful Deliveries Elements PDF
This slide showcases dashboard that can help organization to assess the performance of different email marketing communication KPIs campaigns. Its key components are email sent, successfull deliveries, abuse reports, unique unsubscribe, open and clicks. Showcasing this set of slides titled Email Communication Performance Kpis And Dashboard With Successful Deliveries Elements PDF. The topics addressed in these templates are Abuse Reports, Unique Unsubscribes, Opens. All the content presented in this PPT design is completely editable. Download it and make adjustments in color, background, font etc. as per your unique business setting.
Integrating AI To Enhance Dashboard For Tracking Impact Of Supply Chain Automation Themes PDF
This slide covers the dashboard for back-end tracking of overall impact automation. It include KPIs such as retailer capacity, warehouse capacity, truck efficiency, time to reach warehouse, sustainability, etc. Do you have an important presentation coming up Are you looking for something that will make your presentation stand out from the rest Look no further than Integrating AI To Enhance Dashboard For Tracking Impact Of Supply Chain Automation Themes PDF. With our professional designs, you can trust that your presentation will pop and make delivering it a smooth process. And with Slidegeeks, you can trust that your presentation will be unique and memorable. So why wait Grab Integrating AI To Enhance Dashboard For Tracking Impact Of Supply Chain Automation Themes PDF today and make your presentation stand out from the rest.
Optimizing Marketing Analytics To Enhance Organizational Growth Website Landing Page KPI Tracking Dashboard Graphics PDF
This slide covers a dashboard for analysing the metrics of the website landing page. It includes KPIs such as conversions, conversion rate, sessions, bounce rate, engagement sickness, etc. Do you have an important presentation coming up Are you looking for something that will make your presentation stand out from the rest Look no further than Optimizing Marketing Analytics To Enhance Organizational Growth Website Landing Page KPI Tracking Dashboard Graphics PDF. With our professional designs, you can trust that your presentation will pop and make delivering it a smooth process. And with Slidegeeks, you can trust that your presentation will be unique and memorable. So why wait Grab Optimizing Marketing Analytics To Enhance Organizational Growth Website Landing Page KPI Tracking Dashboard Graphics PDF today and make your presentation stand out from the rest.
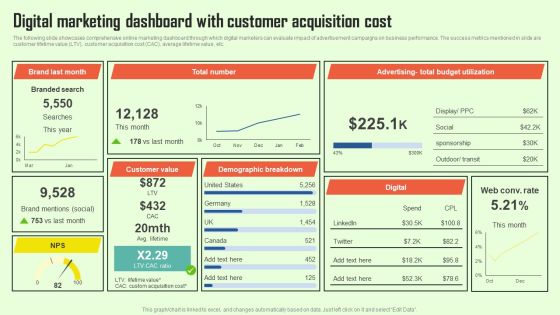
Increasing Consumer Engagement With Database Digital Marketing Dashboard With Customer Infographics PDF
The following slide showcases comprehensive online marketing dashboard through which digital marketers can evaluate impact of advertisement campaigns on business performance. The success metrics mentioned in slide are customer lifetime value LTV, customer acquisition cost CAC, average lifetime value, etc. Make sure to capture your audiences attention in your business displays with our gratis customizable Increasing Consumer Engagement With Database Digital Marketing Dashboard With Customer Infographics PDF. These are great for business strategies, office conferences, capital raising or task suggestions. If you desire to acquire more customers for your tech business and ensure they stay satisfied, create your own sales presentation with these plain slides.
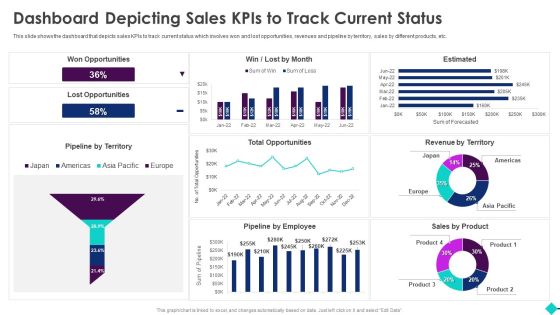
Sales Process Automation For Revenue Growth Dashboard Depicting Sales Kpis To Track Current Status Introduction PDF
This slide shows the dashboard that depicts sales KPIs to track current status which involves won and lost opportunities, revenues and pipeline by territory, sales by different products, etc.Deliver and pitch your topic in the best possible manner with this Sales Process Automation For Revenue Growth Dashboard Depicting Sales Kpis To Track Current Status Introduction PDF. Use them to share invaluable insights on Marketing Effectiveness, Forecast Accuracy, Pipeline Thickness and impress your audience. This template can be altered and modified as per your expectations. So, grab it now.

Creating New Product Launch Campaign Strategy Dashboard To Measure Sales Rep Performance Introduction PDF
This slide illustrates sales representative performance measurement dashboard with key metrics such as average first contact resolution rate, occupancy rate, NPS and top agents by solved tickets. Make sure to capture your audiences attention in your business displays with our gratis customizable Creating New Product Launch Campaign Strategy Dashboard To Measure Sales Rep Performance Introduction PDF. These are great for business strategies, office conferences, capital raising or task suggestions. If you desire to acquire more customers for your tech business and ensure they stay satisfied, create your own sales presentation with these plain slides.
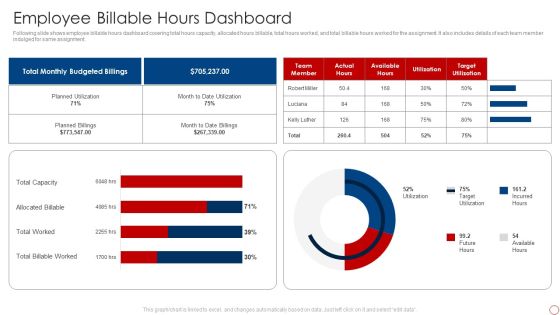
Kpis For Evaluating Business Sustainability Employee Billable Hours Dashboard Professional PDF
Following slide shows employee billable hours dashboard covering total hours capacity, allocated hours billable, total hours worked, and total billable hours worked for the assignment. It also includes details of each team member indulged for same assignment. Deliver and pitch your topic in the best possible manner with this Kpis For Evaluating Business Sustainability Employee Billable Hours Dashboard Professional PDF. Use them to share invaluable insights on Total Billable Worked, Total Worked, Allocated Billable, Total Capacity and impress your audience. This template can be altered and modified as per your expectations. So, grab it now.

Lean Production Techniques To Enhance Operational Effectiveness Metric Dashboard To Monitor Lean Manufacturing Topics PDF
This slide represents metric dashboard to monitor lean manufacturing process. It includes production time, downtime, manufacturing cost, rework quality etc. Present like a pro with Lean Production Techniques To Enhance Operational Effectiveness Metric Dashboard To Monitor Lean Manufacturing Topics PDF Create beautiful presentations together with your team, using our easy to use presentation slides. Share your ideas in real time and make changes on the fly by downloading our templates. So whether you are in the office, on the go, or in a remote location, you can stay in sync with your team and present your ideas with confidence. With Slidegeeks presentation got a whole lot easier. Grab these presentations today.
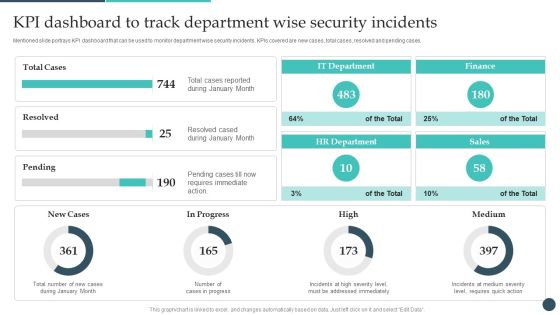
Safety Breach Response Playbook KPI Dashboard To Track Department Wise Rules PDF
Mentioned slide portrays KPI dashboard that can be used to monitor department wise security incidents. KPIs covered are new cases, total cases, resolved and pending cases. Present like a pro with Safety Breach Response Playbook KPI Dashboard To Track Department Wise Rules PDF Create beautiful presentations together with your team, using our easy-to-use presentation slides. Share your ideas in real-time and make changes on the fly by downloading our templates. So whether youre in the office, on the go, or in a remote location, you can stay in sync with your team and present your ideas with confidence. With Slidegeeks presentation got a whole lot easier. Grab these presentations today.

Cloud Data Transformation Dashboard Indicating Project And Provision Status Formats PDF
This slide showcase data migration best practices dashboard indicating overall project and provision status. It contains information about contains user, group and resource provision status. Showcasing this set of slides titled Cloud Data Transformation Dashboard Indicating Project And Provision Status Formats PDF. The topics addressed in these templates are Data Migration Status, Overall Project Status, Group Provision Status. All the content presented in this PPT design is completely editable. Download it and make adjustments in color, background, font etc. as per your unique business setting.

Deploying Banking Transaction Dashboard To Monitor Bank Transactions And Activities Summary PDF
This slide showcases dashboard to review bank transactions and activities. It provides information about credit, check, ATM, debit card, transaction volume, decline rate, visa, maestro, network end points, etc. Do you have an important presentation coming up Are you looking for something that will make your presentation stand out from the rest Look no further than Deploying Banking Transaction Dashboard To Monitor Bank Transactions And Activities Summary PDF. With our professional designs, you can trust that your presentation will pop and make delivering it a smooth process. And with Slidegeeks, you can trust that your presentation will be unique and memorable. So why wait Grab Deploying Banking Transaction Dashboard To Monitor Bank Transactions And Activities Summary PDF today and make your presentation stand out from the rest.

Formulating Money Laundering Dashboard To Monitor Bank Transactions And Activities Clipart PDF
This slide showcases dashboard to review bank transactions and activities. It provides information about credit, check, ATM, debit card, transaction volume, decline rate, visa, maestro, network end points, etc. Do you have an important presentation coming up Are you looking for something that will make your presentation stand out from the rest Look no further than Formulating Money Laundering Dashboard To Monitor Bank Transactions And Activities Clipart PDF. With our professional designs, you can trust that your presentation will pop and make delivering it a smooth process. And with Slidegeeks, you can trust that your presentation will be unique and memorable. So why wait Grab Formulating Money Laundering Dashboard To Monitor Bank Transactions And Activities Clipart PDF today and make your presentation stand out from the rest.

Creating Transaction Monitoring Dashboard To Monitor Bank Transactions And Activities Information PDF
This slide showcases dashboard to review bank transactions and activities. It provides information about credit, check, ATM, debit card, transaction volume, decline rate, visa, maestro, network end points, etc. Do you have an important presentation coming up Are you looking for something that will make your presentation stand out from the rest Look no further than Creating Transaction Monitoring Dashboard To Monitor Bank Transactions And Activities Information PDF. With our professional designs, you can trust that your presentation will pop and make delivering it a smooth process. And with Slidegeeks, you can trust that your presentation will be unique and memorable. So why wait Grab Creating Transaction Monitoring Dashboard To Monitor Bank Transactions And Activities Information PDF today and make your presentation stand out from the rest.

Dashboard To Track Results Of Performance Marketing Ad Campaigns Ppt PowerPoint Presentation File Layouts PDF
This slide showcases dashboard that can help marketers to track and evaluate the outcomes of performance marketing ad campaigns. Its key elements are impressions, clicks, conversions, click through rate, cost per conversion, revenue per click etc. Do you have an important presentation coming up Are you looking for something that will make your presentation stand out from the rest Look no further than Dashboard To Track Results Of Performance Marketing Ad Campaigns Ppt PowerPoint Presentation File Layouts PDF. With our professional designs, you can trust that your presentation will pop and make delivering it a smooth process. And with Slidegeeks, you can trust that your presentation will be unique and memorable. So why wait Grab Dashboard To Track Results Of Performance Marketing Ad Campaigns Ppt PowerPoint Presentation File Layouts PDF today and make your presentation stand out from the rest.
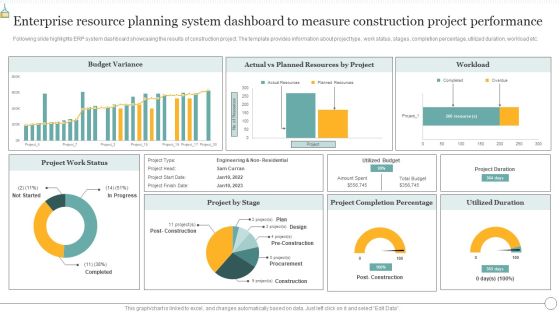
Enterprise Resource Planning System Dashboard To Measure Construction Project Performance Download PDF
Following slide highlights ERP system dashboard showcasing the results of construction project. The template provides information about project type, work status, stages, completion percentage, utilized duration, workload etc. Showcasing this set of slides titled Enterprise Resource Planning System Dashboard To Measure Construction Project Performance Download PDF. The topics addressed in these templates are Project By Stage, Project Completion, Planned Resources. All the content presented in this PPT design is completely editable. Download it and make adjustments in color, background, font etc. as per your unique business setting.

Critical Initiatives To Deploy Product And Customer Performance Tracking Dashboard Guidelines PDF
This slide provides information regarding dashboard utilized by firm to monitor performance of products offered and customer associated. The performance is tracked through revenues generated, new customer acquired, customer satisfaction, sales comparison, etc. Do you have an important presentation coming up Are you looking for something that will make your presentation stand out from the rest Look no further than Critical Initiatives To Deploy Product And Customer Performance Tracking Dashboard Guidelines PDF. With our professional designs, you can trust that your presentation will pop and make delivering it a smooth process. And with Slidegeeks, you can trust that your presentation will be unique and memorable. So why wait Grab Critical Initiatives To Deploy Product And Customer Performance Tracking Dashboard Guidelines PDF today and make your presentation stand out from the rest.

 Home
Home