Program Management Dashboard

Dashboard To Monitor International Footprint Of Supply Chain Operations Brochure PDF
This slide depicts a dashboard that will be used by managers to monitor the global footprint of supply chain operations. Major key performance indicators include total global emissions, time frame, allocation, electricity, etc. Showcasing this set of slides titled Dashboard To Monitor International Footprint Of Supply Chain Operations Brochure PDF. The topics addressed in these templates are Electricity, Footprint Emissions, Allocation. All the content presented in this PPT design is completely editable. Download it and make adjustments in color, background, font etc. as per your unique business setting.

Procedure Dashboard Indicating Integration Of Home Activities With Automation Ppt PowerPoint Presentation File Files PDF
This slide shows process dashboard indicating integration of home activities with automation which contains temperature, average humidity, intensity of light, bedroom, kitchen and dining. It can be beneficial for households who have transformed their homes into smart integrated systems and manage various priorities in one touch.Showcasing this set of slides titled Procedure Dashboard Indicating Integration Of Home Activities With Automation Ppt PowerPoint Presentation File Files PDF. The topics addressed in these templates are Average Humidity, Temperature, Intensity Light. All the content presented in this PPT design is completely editable. Download it and make adjustments in color, background, font etc. as per your unique business setting.

Method To Introduce New Product Offerings In The Industry Product Portfolio Monitoring Dashboard Template PDF
Mentioned slide shows a dashboard that can be used by a product manager to monitor different product portfolios developed and offered by the organization. KPIs included are portfolio budget, issues across portfolios and portfolio risks by impact. Deliver and pitch your topic in the best possible manner with this Method To Introduce New Product Offerings In The Industry Product Portfolio Monitoring Dashboard Template PDF. Use them to share invaluable insights on Portfolio Risks, Portfolio Budget and impress your audience. This template can be altered and modified as per your expectations. So, grab it now.

Business Threats Landscape Dashboard With Cyber Attacks Analysis Ppt Summary Brochure PDF
This slide illustrates risk landscape dashboard with cyber attacks analysis which contains malware attack frequency, country wise attacks, top 10 attacks, etc. It can assist IT managers in analyzing top threats so that they can be dealt with proper efficiency. Pitch your topic with ease and precision using this Business Threats Landscape Dashboard With Cyber Attacks Analysis Ppt Summary Brochure PDF. This layout presents information on Malware Attack Frequency, Every Minute, Every Second. It is also available for immediate download and adjustment. So, changes can be made in the color, design, graphics or any other component to create a unique layout.

Business Vendor Performance Dashboard KPI With Top Supplier For Manufacturing Business Information PDF
Following slide contains executive dashboard which provide managers to track and monitor trends over a period of time. This include elements such as revenue, top products, top supplier, top customer, revenue trends annually, etc. Showcasing this set of slides titled Business Vendor Performance Dashboard KPI With Top Supplier For Manufacturing Business Information PDF. The topics addressed in these templates are Customers, Product, Sales. All the content presented in this PPT design is completely editable. Download it and make adjustments in color, background, font etc. as per your unique business setting.
SFA Dashboard To Track Performance Ppt PowerPoint Presentation Icon Example File PDF
This Slide visually represents sales force automation dashboard to track performance which can be utilized by marketing managers to streamline the process of automated selling. It includes information about sales pipeline, competitors, opportunities, key competitors, etc. Pitch your topic with ease and precision using this sfa dashboard to track performance ppt powerpoint presentation icon example file pdf. This layout presents information on sales pipeline, sales pipeline by sales rep, key competitors, forecast by month, key opportunities. It is also available for immediate download and adjustment. So, changes can be made in the color, design, graphics or any other component to create a unique layout.

Project Drivers Kpi Dashboard With Digital Marketing Metrics Ppt PowerPoint Presentation File Clipart PDF
This slide outlines the digital marketing project drivers dashboard which includes components such as growth, No. orders, revenue and EBITDA margin. It also provides information about the website traffic, conversion rate and new customers which can assist managers to track digital marketing performance. Showcasing this set of slides titled Project Drivers Kpi Dashboard With Digital Marketing Metrics Ppt PowerPoint Presentation File Clipart PDF. The topics addressed in these templates are Website Traffic, Conversion Rate, New Customers. All the content presented in this PPT design is completely editable. Download it and make adjustments in color, background, font etc. as per your unique business setting.

Business Operational Expenditure Dashboard Indicating Revenue And Costs Metrics Pictures PDF
This slide shows operating expenses OPEX dashboard indicating revenue and costs metrics which can be referred by companies to manage various operating expenses of various departments. It contains information about cost center, revenue per company, company code, etc. Pitch your topic with ease and precision using this Business Operational Expenditure Dashboard Indicating Revenue And Costs Metrics Pictures PDF. This layout presents information on Business Operational, Costs Metrics, Revenue. It is also available for immediate download and adjustment. So, changes can be made in the color, design, graphics or any other component to create a unique layout.

Product Portfolios And Strategic Dashboard To Measure Business Performance Portrait PDF
This slide illustrates a dashboard that can be used by a product manager to measure the business performance. Metrics covered in the dashboard are revenue, launches, cash flow, EPS, average revenue by product and average cost by phase. Do you have an important presentation coming up Are you looking for something that will make your presentation stand out from the rest Look no further than Product Portfolios And Strategic Dashboard To Measure Business Performance Portrait PDF. With our professional designs, you can trust that your presentation will pop and make delivering it a smooth process. And with Slidegeeks, you can trust that your presentation will be unique and memorable. So why wait Grab Product Portfolios And Strategic Dashboard To Measure Business Performance Portrait PDF today and make your presentation stand out from the rest.

Alternative Distribution Advertising Platform Online Multichannel Marketing Campaign Dashboard Elements PDF
This slide covers the RACE planning model which will be used by our company for prioritizing and managing digital marketing activities. Deliver an awe inspiring pitch with this creative alternative distribution advertising platform online multichannel marketing campaign dashboard elements pdf bundle. Topics like source, campaign, traffic, enquiries, rate can be discussed with this completely editable template. It is available for immediate download depending on the needs and requirements of the user.

Amalgamation Marketing Pitch Deck Online Multichannel Marketing Campaign Dashboard Themes PDF
This slide covers the RACE planning model which will be used by our company for prioritizing and managing digital marketing activities. Deliver an awe inspiring pitch with this creative amalgamation marketing pitch deck online multichannel marketing campaign dashboard themes pdf bundle. Topics like source, campaign, traffic, enquiries, rate can be discussed with this completely editable template. It is available for immediate download depending on the needs and requirements of the user.

Kpi Dashboard For Monitoring Status Of Nonprofit Advertising Strategy Portrait PDF
This slide brings forth dashboard which assists project managers in tracking the status of marketing plans and activities for timely decision making. The key performance indicators are project title, tag, responsibility, date assigned, project team, progress, deadline and status Pitch your topic with ease and precision using this Kpi Dashboard For Monitoring Status Of Nonprofit Advertising Strategy Portrait PDF. This layout presents information on Tag, Responsibility, Date Assigned. It is also available for immediate download and adjustment. So, changes can be made in the color, design, graphics or any other component to create a unique layout.

Tactical Approach To Vendor Relationship Dashboard Depicting Procurement Quality Kpis Graphics PDF
This slide covers the dashboard that depicts procurement quality metrics such as ordered value, supplier rejection rate, emergency purchase rate, spend under management, supplier quality rating, etc.Deliver an awe inspiring pitch with this creative Tactical Approach To Vendor Relationship Dashboard Depicting Procurement Quality Kpis Graphics PDF bundle. Topics like Dashboard Depicting Procurement Quality Kpis can be discussed with this completely editable template. It is available for immediate download depending on the needs and requirements of the user.

Market Evaluation Of IT Industry Financial Dashboard To Track Organization Expenses Clipart PDF
The following slide showcases KPI dashboard which can be used by finance managers to evaluate financial health of company. Revenue, expenses, net profit, bills receivable, bills payable, quick ratio, current ratio are some of the major metrics which are outlined in the slide. Do you have an important presentation coming up Are you looking for something that will make your presentation stand out from the rest Look no further than Market Evaluation Of IT Industry Financial Dashboard To Track Organization Expenses Clipart PDF. With our professional designs, you can trust that your presentation will pop and make delivering it a smooth process. And with Slidegeeks, you can trust that your presentation will be unique and memorable. So why wait Grab Market Evaluation Of IT Industry Financial Dashboard To Track Organization Expenses Clipart PDF today and make your presentation stand out from the rest.

Business Diagram Dashboard With Pointer And Text Boxes For Process Control Presentation Template
This business diagram displays graphic of dashboard with pointer and text boxes. This slide helps to depict concept of business process and management. Present your views using this innovative slide and be assured of leaving a lasting impression.

KPI Metrics Dashboard To Measure Success Of Customer Churn Prevention Strategies Diagrams PDF
Mentioned slide outlines a key performance indicator KPI dashboard which will assist managers to showcase the result of customer attrition prevention strategies. The KPIs are risky customers, retention rate, monthly recurring revenue MRR, churn risk by location and income, etc. This KPI Metrics Dashboard To Measure Success Of Customer Churn Prevention Strategies Diagrams PDF is perfect for any presentation, be it in front of clients or colleagues. It is a versatile and stylish solution for organizing your meetings. The KPI Metrics Dashboard To Measure Success Of Customer Churn Prevention Strategies Diagrams PDF features a modern design for your presentation meetings. The adjustable and customizable slides provide unlimited possibilities for acing up your presentation. Slidegeeks has done all the homework before launching the product for you. So, do not wait, grab the presentation templates today

KPI Metrics Dashboard Highlighting Employee Retention Rate Developing Employee Retention Techniques Sample PDF
The purpose of this slide is to exhibit a key performance indicator KPI dashboard through which managers can analyze the monthly employee retention rate. The metrics covered in the slide are active employees, new candidates hired, internal, exit, employee turnover rate, etc.Do you have to make sure that everyone on your team knows about any specific topic I yes, then you should give KPI Metrics Dashboard Highlighting Employee Retention Rate Developing Employee Retention Techniques Sample PDF a try. Our experts have put a lot of knowledge and effort into creating this impeccable KPI Metrics Dashboard Highlighting Employee Retention Rate Developing Employee Retention Techniques Sample PDF. You can use this template for your upcoming presentations, as the slides are perfect to represent even the tiniest detail. You can download these templates from the Slidegeeks website and these are easy to edit. So grab these today.

Dashboard To Analyze Flexible Working Strategies Impact On Employees Performance Professional PDF
The following slide delineates a key performance indicator KPI dashboard through which managers can evaluate the success of a flexible working policy on workforce performance. The major KPIs are absenteeism rate, overall labor effectiveness etc. If you are looking for a format to display your unique thoughts, then the professionally designed Dashboard To Analyze Flexible Working Strategies Impact On Employees Performance Professional PDF is the one for you. You can use it as a Google Slides template or a PowerPoint template. Incorporate impressive visuals, symbols, images, and other charts. Modify or reorganize the text boxes as you desire. Experiment with shade schemes and font pairings. Alter, share or cooperate with other people on your work. Download Dashboard To Analyze Flexible Working Strategies Impact On Employees Performance Professional PDF and find out how to give a successful presentation. Present a perfect display to your team and make your presentation unforgettable.

Enhancing Digital Visibility Using SEO Content Strategy KPI Dashboard To Evaluate SEO Performance Diagrams PDF
This slide shows key performance indicators dashboard which can be used by marketing managers to measure SEO performance. It includes metrics such as health score, domain rating, referring domains, backlinks, etc. This Enhancing Digital Visibility Using SEO Content Strategy KPI Dashboard To Evaluate SEO Performance Diagrams PDF is perfect for any presentation, be it in front of clients or colleagues. It is a versatile and stylish solution for organizing your meetings. The Enhancing Digital Visibility Using SEO Content Strategy KPI Dashboard To Evaluate SEO Performance Diagrams PDF features a modern design for your presentation meetings. The adjustable and customizable slides provide unlimited possibilities for acing up your presentation. Slidegeeks has done all the homework before launching the product for you. So, do not wait, grab the presentation templates today

Vendor Performance Analysis And Administration Supplier Performance And Order Cycle Time Monitoring Dashboard Themes PDF
The following slide showcases a dashboard to supervise and manage procurement order cycle time an supplier performance. It includes key elements such as defect rate, on time supplies, supplier availability, lead time, supplier defect rate, defect type and delivery time. If you are looking for a format to display your unique thoughts, then the professionally designed Vendor Performance Analysis And Administration Supplier Performance And Order Cycle Time Monitoring Dashboard Themes PDF is the one for you. You can use it as a Google Slides template or a PowerPoint template. Incorporate impressive visuals, symbols, images, and other charts. Modify or reorganize the text boxes as you desire. Experiment with shade schemes and font pairings. Alter, share or cooperate with other people on your work. Download Vendor Performance Analysis And Administration Supplier Performance And Order Cycle Time Monitoring Dashboard Themes PDF and find out how to give a successful presentation. Present a perfect display to your team and make your presentation unforgettable.

Adopting Flexible Work Policy Dashboard To Analyze Flexible Working Strategies Impact Template PDF
The following slide delineates a key performance indicator KPI dashboard through which managers can evaluate the success of a flexible working policy on workforce performance. The major KPIs are absenteeism rate, overall labor effectiveness etc. Do you have to make sure that everyone on your team knows about any specific topic I yes, then you should give Adopting Flexible Work Policy Dashboard To Analyze Flexible Working Strategies Impact Template PDF a try. Our experts have put a lot of knowledge and effort into creating this impeccable Adopting Flexible Work Policy Dashboard To Analyze Flexible Working Strategies Impact Template PDF. You can use this template for your upcoming presentations, as the slides are perfect to represent even the tiniest detail. You can download these templates from the Slidegeeks website and these are easy to edit. So grab these today.
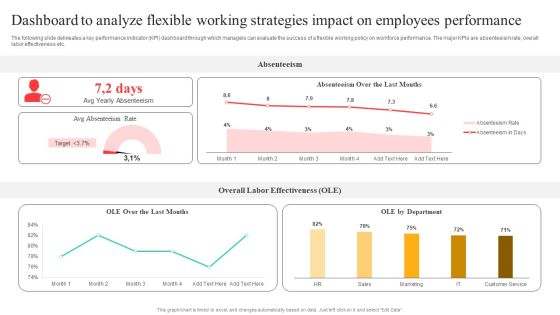
Flexible Working Policies And Guidelines Dashboard To Analyze Flexible Working Strategies Information PDF
The following slide delineates a key performance indicator KPI dashboard through which managers can evaluate the success of a flexible working policy on workforce performance. The major KPIs are absenteeism rate, overall labor effectiveness etc. Create an editable Flexible Working Policies And Guidelines Dashboard To Analyze Flexible Working Strategies Information PDF that communicates your idea and engages your audience. Whether youre presenting a business or an educational presentation, pre designed presentation templates help save time. Flexible Working Policies And Guidelines Dashboard To Analyze Flexible Working Strategies Information PDF is highly customizable and very easy to edit, covering many different styles from creative to business presentations. Slidegeeks has creative team members who have crafted amazing templates. So, go and get them without any delay.

Dashboard To Track IT Security Incidents Prevailing Across Firm Elements PDF
This slide portrays information regarding the dashboard that firm will track various incidents detected. These incidents will be managed in order to avoid security risks. Formulating a presentation can take up a lot of effort and time, so the content and message should always be the primary focus. The visuals of the PowerPoint can enhance the presenters message, so our Dashboard To Track IT Security Incidents Prevailing Across Firm Elements PDF was created to help save time. Instead of worrying about the design, the presenter can concentrate on the message while our designers work on creating the ideal templates for whatever situation is needed. Slidegeeks has experts for everything from amazing designs to valuable content, we have put everything into Dashboard To Track IT Security Incidents Prevailing Across Firm Elements PDF.

Integrating CRM Solution To Acquire Potential Customers CRM Email Nurturing Campaign Dashboard Template PDF
This slide represents key metrics dashboard to analyze, manage and track the performance of email nurturing campaign organized by the enterprise. It incudes details related to KPIs such as conversion rate, average order value etc. If you are looking for a format to display your unique thoughts, then the professionally designed Integrating CRM Solution To Acquire Potential Customers CRM Email Nurturing Campaign Dashboard Template PDF is the one for you. You can use it as a Google Slides template or a PowerPoint template. Incorporate impressive visuals, symbols, images, and other charts. Modify or reorganize the text boxes as you desire. Experiment with shade schemes and font pairings. Alter, share or cooperate with other people on your work. Download Integrating CRM Solution To Acquire Potential Customers CRM Email Nurturing Campaign Dashboard Template PDF and find out how to give a successful presentation. Present a perfect display to your team and make your presentation unforgettable.

Dashboard To Track IT Security Incidents Prevailing Across Firm Infographics PDF
This slide portrays information regarding the dashboard that firm will track various incidents detected. These incidents will be managed in order to avoid security risks. Crafting an eye catching presentation has never been more straightforward. Let your presentation shine with this tasteful yet straightforward Dashboard To Track IT Security Incidents Prevailing Across Firm Infographics PDF template. It offers a minimalistic and classy look that is great for making a statement. The colors have been employed intelligently to add a bit of playfulness while still remaining professional. Construct the ideal Dashboard To Track IT Security Incidents Prevailing Across Firm Infographics PDF that effortlessly grabs the attention of your audience Begin now and be certain to wow your customers.
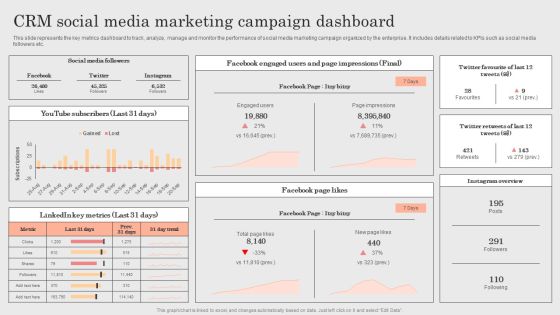
Integrating CRM Solution To Acquire Potential Customers CRM Social Media Marketing Campaign Dashboard Template PDF
This slide represents the key metrics dashboard to track, analyze, manage and monitor the performance of social media marketing campaign organized by the enterprise. It includes details related to KPIs such as social media followers etc. Formulating a presentation can take up a lot of effort and time, so the content and message should always be the primary focus. The visuals of the PowerPoint can enhance the presenters message, so our Integrating CRM Solution To Acquire Potential Customers CRM Social Media Marketing Campaign Dashboard Template PDF was created to help save time. Instead of worrying about the design, the presenter can concentrate on the message while our designers work on creating the ideal templates for whatever situation is needed. Slidegeeks has experts for everything from amazing designs to valuable content, we have put everything into Integrating CRM Solution To Acquire Potential Customers CRM Social Media Marketing Campaign Dashboard Template PDF

Dashboard To Track IT Security Incidents Prevailing Across Firm Demonstration PDF
This slide portrays information regarding the dashboard that firm will track various incidents detected. These incidents will be managed in order to avoid security risks. Do you have an important presentation coming up Are you looking for something that will make your presentation stand out from the rest Look no further than Dashboard To Track IT Security Incidents Prevailing Across Firm Demonstration PDF. With our professional designs, you can trust that your presentation will pop and make delivering it a smooth process. And with Slidegeeks, you can trust that your presentation will be unique and memorable. So why wait Grab Dashboard To Track IT Security Incidents Prevailing Across Firm Demonstration PDF today and make your presentation stand out from the rest
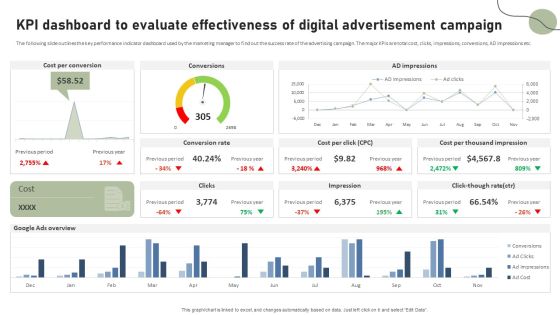
KPI Dashboard To Evaluate Effectiveness Of Digital Advertisement Campaign Pictures PDF
The following slide outlines the key performance indicator dashboard used by the marketing manager to find out the success rate of the advertising campaign. The major KPIs are total cost, clicks, impressions, conversions, AD impressions etc. Do you have to make sure that everyone on your team knows about any specific topic I yes, then you should give KPI Dashboard To Evaluate Effectiveness Of Digital Advertisement Campaign Pictures PDF a try. Our experts have put a lot of knowledge and effort into creating this impeccable KPI Dashboard To Evaluate Effectiveness Of Digital Advertisement Campaign Pictures PDF. You can use this template for your upcoming presentations, as the slides are perfect to represent even the tiniest detail. You can download these templates from the Slidegeeks website and these are easy to edit. So grab these today.

Comprehensive Guide For Multi Level Dashboard To Track Binary Multi Level Marketing Formats PDF
This slide represents metric dashboard that helps marketers in tracking and managing binary network marketing. It covers KPIs such as network bonus, expenditure, profit etc. This Comprehensive Guide For Multi Level Dashboard To Track Binary Multi Level Marketing Formats PDF is perfect for any presentation, be it in front of clients or colleagues. It is a versatile and stylish solution for organizing your meetings. The Comprehensive Guide For Multi Level Dashboard To Track Binary Multi Level Marketing Formats PDF features a modern design for your presentation meetings. The adjustable and customizable slides provide unlimited possibilities for acing up your presentation. Slidegeeks has done all the homework before launching the product for you. So, dont wait, grab the presentation templates today.
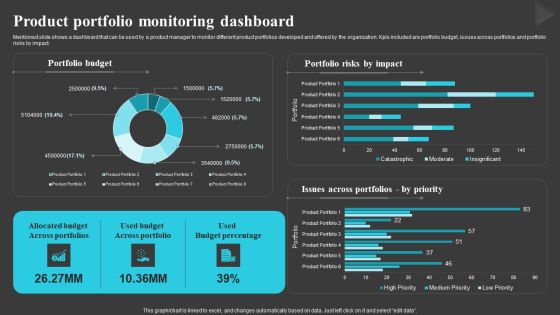
Product Portfolio Monitoring Dashboard Creating And Offering Multiple Product Ranges In New Business Diagrams PDF
Mentioned slide shows a dashboard that can be used by a product manager to monitor different product portfolios developed and offered by the organization. Kpis included are portfolio budget, issues across portfolios and portfolio risks by impact.Crafting an eye-catching presentation has never been more straightforward. Let your presentation shine with this tasteful yet straightforward Product Portfolio Monitoring Dashboard Creating And Offering Multiple Product Ranges In New Business Diagrams PDF template. It offers a minimalistic and classy look that is great for making a statement. The colors have been employed intelligently to add a bit of playfulness while still remaining professional. Construct the ideal Product Portfolio Monitoring Dashboard Creating And Offering Multiple Product Ranges In New Business Diagrams PDF that effortlessly grabs the attention of your audience Begin now and be certain to wow your customers.

Dashboard For Tracking Facebook Post Performance Ppt PowerPoint Presentation File Slides PDF
The following slide outlines dashboard through which advertisers can manage Facebook post performance and optimize their marketing strategy. Information covered in this slide is related to key metrics such as impressions per post, engagement rate, click-through rate CTR, likes, etc. Here you can discover an assortment of the finest PowerPoint and Google Slides templates. With these templates, you can create presentations for a variety of purposes while simultaneously providing your audience with an eye catching visual experience. Download Dashboard For Tracking Facebook Post Performance Ppt PowerPoint Presentation File Slides PDF to deliver an impeccable presentation. These templates will make your job of preparing presentations much quicker, yet still, maintain a high level of quality. Slidegeeks has experienced researchers who prepare these templates and write high quality content for you. Later on, you can personalize the content by editing the Dashboard For Tracking Facebook Post Performance Ppt PowerPoint Presentation File Slides PDF.

Introduction To New Product Portfolio Dashboard To Measure Business Performance Ppt Ideas Clipart Images PDF
This slide illustrates a dashboard that can be used by a product manager to measure the business performance. Metrics covered in the dashboard are revenue, launches, cash flow, EPS, average revenue by product and average cost by phase. Are you in need of a template that can accommodate all of your creative concepts. This one is crafted professionally and can be altered to fit any style. Use it with Google Slides or PowerPoint. Include striking photographs, symbols, depictions, and other visuals. Fill, move around, or remove text boxes as desired. Test out color palettes and font mixtures. Edit and save your work, or work with colleagues. Download Introduction To New Product Portfolio Dashboard To Measure Business Performance Ppt Ideas Clipart Images PDF and observe how to make your presentation outstanding. Give an impeccable presentation to your group and make your presentation unforgettable.

Company Sales And Performance Dashboard Ppt PowerPoint Presentation Pictures Infographic Template
This is a company sales and performance dashboard ppt powerpoint presentation pictures infographic template. This is a four stage process. The stages in this process are business, finance, analysis, management, marketing.

Crm Dashboard This Year Sales Vs Last Year Sales Ppt PowerPoint Presentation Professional Display
This is a crm dashboard this year sales vs last year sales ppt powerpoint presentation professional display. This is a two stage process. The stages in this process are area chart, growth, management, marketing, business, strategy.

Employee Weekly Efficiency Dashboard Ppt PowerPoint Presentation Infographic Template Graphic Images
This is a employee weekly efficiency dashboard ppt powerpoint presentation infographic template graphic images. This is a six stage process. The stages in this process are percentage, product, business, management, marketing.

Dashboard Of Investment Summary With Group Wise And Yearly Total Investment Download PDF
This slide shows dashboard for stakeholders to provide visibility into programs, projects and portfolio aligned to purpose or aim. It includes yearly , group wise total investment and rate of return. Showcasing this set of slides titled Dashboard Of Investment Summary With Group Wise And Yearly Total Investment Download PDF. The topics addressed in these templates are Dashboard Of Investment Summary, Group Wise, Yearly Total Investment. All the content presented in this PPT design is completely editable. Download it and make adjustments in color, background, font etc. as per your unique business setting.

Cyber Security Administration In Organization Financial Performance Tracking Dashboard Microsoft PDF
This slide presents the dashboard which will help firm in tracking the fiscal performance. This dashboard displays revenues and expenses trends and payment received analysis. Deliver and pitch your topic in the best possible manner with this cyber security administration in organization financial performance tracking dashboard microsoft pdf. Use them to share invaluable insights on financial performance tracking dashboard and impress your audience. This template can be altered and modified as per your expectations. So, grab it now.

HR Budget Vs Actual KPI Dashboard Ppt PowerPoint Presentation File Structure PDF
The given below slide highlights the key metrics of HR budget to manage expense stream and take assist decision making. It includes KPAs such as month wise variations in budget, total amount allocated, actual expenditures etc. Pitch your topic with ease and precision using this HR Budget Vs Actual KPI Dashboard Ppt PowerPoint Presentation File Structure PDF. This layout presents information on Amount Allocated, Expenses by Heads, Budget Achieved. It is also available for immediate download and adjustment. So, changes can be made in the color, design, graphics or any other component to create a unique layout.

Sales Employee Representative Performance Scorecard Dashboard For Healthcare Industry Clipart PDF
This slide showcases sales performance of healthcare products which can be used by managers to evaluate business achievements. It includes key components such as monthly sales comparison, sales performance of products by different channels, sales team performance. Pitch your topic with ease and precision using this Sales Employee Representative Performance Scorecard Dashboard For Healthcare Industry Clipart PDF. This layout presents information on Monthly Sales Comparison, Revenue By Previous Year, Sales Performance, Different Products, Different Channels, Sales Team Performance . It is also available for immediate download and adjustment. So, changes can be made in the color, design, graphics or any other component to create a unique layout.

Enhancing Digital Visibility Using SEO Content Strategy KPI Dashboard To Evaluate Content Performance Diagrams PDF
This slide shows key performance indicators dashboard which can be used by content marketing managers to measure content performance. It includes metrics such as page views, social shares, content first touch, pipeline generated, etc. This modern and well arranged Enhancing Digital Visibility Using SEO Content Strategy KPI Dashboard To Evaluate Content Performance Diagrams PDF provides lots of creative possibilities. It is very simple to customize and edit with the Powerpoint Software. Just drag and drop your pictures into the shapes. All facets of this template can be edited with Powerpoint no extra software is necessary. Add your own material, put your images in the places assigned for them, adjust the colors, and then you can show your slides to the world, with an animated slide included.

Incorporating Real Time Marketing For Improved Consumer Real Time Content Marketing Result Dashboard Mockup PDF
The following slide depicts real time content marketing KPI dashboard to monitor traffic flow and manage promotional efforts. It includes elements such as visitors by channel, conversion rate, search, direct, sessions, average time engaged etc. This modern and well arranged Incorporating Real Time Marketing For Improved Consumer Real Time Content Marketing Result Dashboard Mockup PDF provides lots of creative possibilities. It is very simple to customize and edit with the Powerpoint Software. Just drag and drop your pictures into the shapes. All facets of this template can be edited with Powerpoint no extra software is necessary. Add your own material, put your images in the places assigned for them, adjust the colors, and then you can show your slides to the world, with an animated slide included.

Email Newsletter Dashboard Showing Campaign Performance Ppt PowerPoint Presentation File Infographic Template PDF
The following slide showcases a key performance indicator KPI dashboard through which managers can measure the impact of email marketing strategy on business performance. The metrics covered in the slide are total conversions, new subscribers, etc. Coming up with a presentation necessitates that the majority of the effort goes into the content and the message you intend to convey. The visuals of a PowerPoint presentation can only be effective if it supplements and supports the story that is being told. Keeping this in mind our experts created Email Newsletter Dashboard Showing Campaign Performance Ppt PowerPoint Presentation File Infographic Template PDF to reduce the time that goes into designing the presentation. This way, you can concentrate on the message while our designers take care of providing you with the right template for the situation.

Real Time Content Marketing Result Dashboard Ppt Infographic Template Example PDF
The following slide depicts real time content marketing KPI dashboard to monitor traffic flow and manage promotional efforts. It includes elements such as visitors by channel, conversion rate, search, direct, sessions, average time engaged etc. The Real Time Content Marketing Result Dashboard Ppt Infographic Template Example PDF is a compilation of the most recent design trends as a series of slides. It is suitable for any subject or industry presentation, containing attractive visuals and photo spots for businesses to clearly express their messages. This template contains a variety of slides for the user to input data, such as structures to contrast two elements, bullet points, and slides for written information. Slidegeeks is prepared to create an impression.
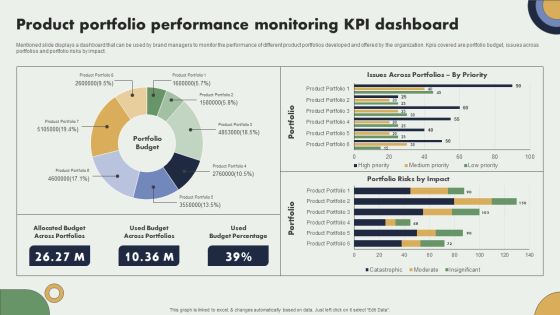
Product Portfolio Performance Monitoring Kpi Dashboard Brand Expansion Plan Slides PDF
Mentioned slide displays a dashboard that can be used by brand managers to monitor the performance of different product portfolios developed and offered by the organization. Kpis covered are portfolio budget, issues across portfolios and portfolio risks by impact.Take your projects to the next level with our ultimate collection of Product Portfolio Performance Monitoring Kpi Dashboard Brand Expansion Plan Slides PDF. Slidegeeks has designed a range of layouts that are perfect for representing task or activity duration, keeping track of all your deadlines at a glance. Tailor these designs to your exact needs and give them a truly corporate look with your own brand colors they all make your projects stand out from the rest.

Deploying Corporate Aligned IT Strategy Dashboard To Track IT Security Incidents Prevailing Across Firm Designs PDF
This slide portrays information regarding the dashboard that firm will track various incidents detected. These incidents will be managed in order to avoid security risks. Coming up with a presentation necessitates that the majority of the effort goes into the content and the message you intend to convey. The visuals of a PowerPoint presentation can only be effective if it supplements and supports the story that is being told. Keeping this in mind our experts created Deploying Corporate Aligned IT Strategy Dashboard To Track IT Security Incidents Prevailing Across Firm Designs PDF to reduce the time that goes into designing the presentation. This way, you can concentrate on the message while our designers take care of providing you with the right template for the situation.

Tactics For Establishing Sustainable Hybrid Work Environment Dashboard To Analyze Flexible Working Strategies Topics PDF
The following slide delineates a key performance indicator KPI dashboard through which managers can evaluate the success of a flexible working policy on workforce performance. The major KPIs are absenteeism rate, overall labor effectiveness etc. Boost your pitch with our creative Tactics For Establishing Sustainable Hybrid Work Environment Dashboard To Analyze Flexible Working Strategies Topics PDF. Deliver an awe-inspiring pitch that will mesmerize everyone. Using these presentation templates you will surely catch everyones attention. You can browse the ppts collection on our website. We have researchers who are experts at creating the right content for the templates. So you do not have to invest time in any additional work. Just grab the template now and use them.

Marketing Campaign Dashboard For B2B Marketers Ppt PowerPoint Presentation File Diagrams PDF
The following slide showcases key performance indicator KPI dashboard that can assist managers to evaluate digital marketing campaign performance. The key metrics mentioned in the slide are click-through-rate CTR, conversion rate, cost per click CPC, etc. Present like a pro with Marketing Campaign Dashboard For B2B Marketers Ppt PowerPoint Presentation File Diagrams PDF Create beautiful presentations together with your team, using our easy to use presentation slides. Share your ideas in real time and make changes on the fly by downloading our templates. So whether you are in the office, on the go, or in a remote location, you can stay in sync with your team and present your ideas with confidence. With Slidegeeks presentation got a whole lot easier. Grab these presentations today.

Dashboard To Track IT Security Incidents Prevailing Across Firm Ppt PowerPoint Presentation File Outline PDF
This slide portrays information regarding the dashboard that firm will track various incidents detected. These incidents will be managed in order to avoid security risks. Slidegeeks is here to make your presentations a breeze with Dashboard To Track IT Security Incidents Prevailing Across Firm Ppt PowerPoint Presentation File Outline PDF With our easy to use and customizable templates, you can focus on delivering your ideas rather than worrying about formatting. With a variety of designs to choose from, you are sure to find one that suits your needs. And with animations and unique photos, illustrations, and fonts, you can make your presentation pop. So whether you are giving a sales pitch or presenting to the board, make sure to check out Slidegeeks first.

Financial Dashboard To Track Organization Expenses Ppt PowerPoint Presentation File Ideas PDF
The following slide showcases KPI dashboard which can be used by finance managers to evaluate financial health of company. Revenue, expenses, net profit, bills receivable, bills payable, quick ratio, current ratio are some of the major metrics which are outlined in the slide. Boost your pitch with our creative Financial Dashboard To Track Organization Expenses Ppt PowerPoint Presentation File Ideas PDF. Deliver an awe-inspiring pitch that will mesmerize everyone. Using these presentation templates you will surely catch everyones attention. You can browse the ppts collection on our website. We have researchers who are experts at creating the right content for the templates. So you do not have to invest time in any additional work. Just grab the template now and use them.

Introduction To New Product Portfolio Product Portfolio Monitoring Dashboard Ppt Portfolio Background PDF
Mentioned slide shows a dashboard that can be used by a product manager to monitor different product portfolios developed and offered by the organization. KPIs included are portfolio budget, issues across portfolios and portfolio risks by impact. Welcome to our selection of the Introduction To New Product Portfolio Product Portfolio Monitoring Dashboard Ppt Portfolio Background PDF. These are designed to help you showcase your creativity and bring your sphere to life. Planning and Innovation are essential for any business that is just starting out. This collection contains the designs that you need for your everyday presentations. All of our PowerPoints are 100 percent editable, so you can customize them to suit your needs. This multi-purpose template can be used in various situations. Grab these presentation templates today.

Strategies For Dynamic Supply Chain Agility Supply Chain Kpi Dashboard For Effective Financial Analysis Demonstration PDF
Mentioned slide illustrates KPI dashboard that can be used by managers to assess financial health of supply chain business. KPIs covered are supply chain costs versus sales, cash to order cycle, warehouse operating cost distribution etc. The Strategies For Dynamic Supply Chain Agility Supply Chain Kpi Dashboard For Effective Financial Analysis Demonstration PDF is a compilation of the most recent design trends as a series of slides. It is suitable for any subject or industry presentation, containing attractive visuals and photo spots for businesses to clearly express their messages. This template contains a variety of slides for the user to input data, such as structures to contrast two elements, bullet points, and slides for written information. Slidegeeks is prepared to create an impression.

Effective Strategies For Retaining Healthcare Staff KPI Metrics Dashboard Highlighting Employee Retention Rate Summary PDF
The purpose of this slide is to exhibit a key performance indicator KPI dashboard through which managers can analyze the monthly employee retention rate. The metrics covered in the slide are active employees, new candidates hired, internal, exit, employee turnover rate, etc. Welcome to our selection of the Effective Strategies For Retaining Healthcare Staff KPI Metrics Dashboard Highlighting Employee Retention Rate Summary PDF. These are designed to help you showcase your creativity and bring your sphere to life. Planning and Innovation are essential for any business that is just starting out. This collection contains the designs that you need for your everyday presentations. All of our PowerPoints are 100 percent editable, so you can customize them to suit your needs. This multi purpose template can be used in various situations. Grab these presentation templates today.
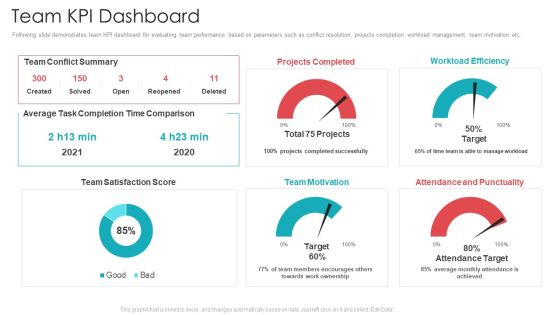
Official Team Collaboration Plan Team KPI Dashboard Ppt Gallery Backgrounds PDF
Following slide demonstrates team KPI dashboard for evaluating team performance based on parameters such as conflict resolution, projects completion, workload management, team motivation etc. Deliver an awe-inspiring pitch with this creative official team collaboration plan team kpi dashboard ppt gallery backgrounds pdf bundle. Topics like projects completed, workload efficiency, team motivation, attendance and punctuality, team satisfaction score can be discussed with this completely editable template. It is available for immediate download depending on the needs and requirements of the user.

Benchmarking Supplier Operation Control Procedure Vendor Compliance Monitoring Dashboard Infographics PDF
Following slide shows vendor compliance monitoring dashboard. It covers KPIs namely top supplier by partner status, average procurement cycle time and average procurement cycle. Deliver and pitch your topic in the best possible manner with this benchmarking supplier operation control procedure vendor compliance monitoring dashboard infographics pdf. Use them to share invaluable insights on confirmation, supplier, monitoring dashboard and impress your audience. This template can be altered and modified as per your expectations. So, grab it now.

Monthly Project Progress Details Dashboard To Monitor Work Progress Ppt Summary Design Templates PDF
The slide shows a dashboard for project progress management. It includes gross margin, billing utilization, invoiced, active users, scope delivered, quality, risks, etc. Showcasing this set of slides titled Monthly Project Progress Details Dashboard To Monitor Work Progress Ppt Summary Design Templates PDF. The topics addressed in these templates are Scope Delivered, Quality, Risks. All the content presented in this PPT design is completely editable. Download it and make adjustments in color, background, font etc. as per your unique business setting.

Strategic Procedure To Improve Employee Efficiency Team KPI Dashboard Topics PDF
Following slide demonstrates team KPI dashboard for evaluating team performance based on parameters such as conflict resolution, projects completion, workload management, team motivation etc. Deliver and pitch your topic in the best possible manner with this strategic procedure to improve employee efficiency team kpi dashboard topics pdf Use them to share invaluable insights on team conflict summary, workload efficiency, team motivation and impress your audience. This template can be altered and modified as per your expectations. So, grab it now.
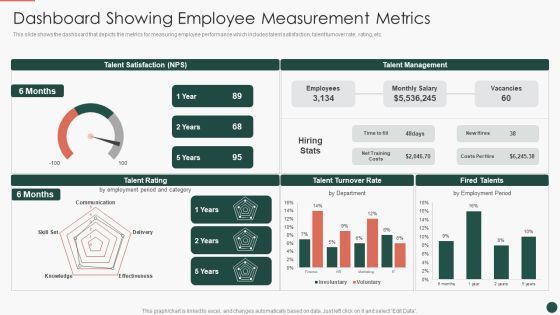
Developing HR Process Flow Dashboard Showing Employee Measurement Metrics Template PDF
This slide shows the dashboard that depicts the metrics for measuring employee performance which includes talent satisfaction, talent turnover rate, rating, etc.Deliver and pitch your topic in the best possible manner with this Developing HR Process Flow Dashboard Showing Employee Measurement Metrics Template PDF. Use them to share invaluable insights on Talent Satisfaction, Talent Management, Talent Turnover and impress your audience. This template can be altered and modified as per your expectations. So, grab it now.
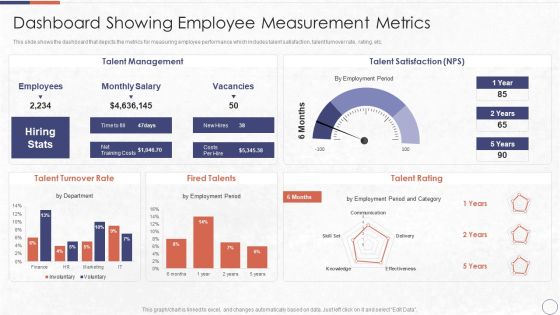
RPA In HR Operations Dashboard Showing Employee Measurement Metrics Slides PDF
This slide shows the dashboard that depicts the metrics for measuring employee performance which includes talent satisfaction, talent turnover rate, rating, etc.Deliver an awe inspiring pitch with this creative RPA In HR Operations Dashboard Showing Employee Measurement Metrics Slides PDF bundle. Topics like Talent Management, Talent Satisfaction, Talent Turnover can be discussed with this completely editable template. It is available for immediate download depending on the needs and requirements of the user.
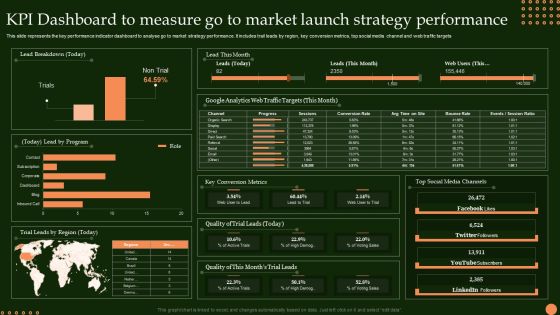
KPI Dashboard To Measure Go To Market Launch Strategy Performance Sample PDF
This slide represents the key performance indicator dashboard to analyse go to market strategy performance. It includes trail leads by region, key conversion metrics, top social media channel and web traffic targets Pitch your topic with ease and precision using this KPI Dashboard To Measure Go To Market Launch Strategy Performance Sample PDF. This layout presents information on Lead Breakdown, Lead By Program, Trial Leads Region. It is also available for immediate download and adjustment. So, changes can be made in the color, design, graphics or any other component to create a unique layout.
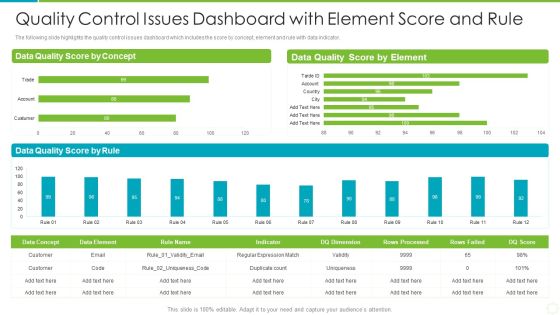
Quality Control Issues Dashboard With Element Score And Rule Summary PDF
The following slide highlights the quality control issues dashboard which includes the score by concept, element and rule with data indicator. Showcasing this set of slides titled quality control issues dashboard with element score and rule summary pdf. The topics addressed in these templates are quality control issues dashboard with element score and rule. All the content presented in this PPT design is completely editable. Download it and make adjustments in color, background, font etc. as per your unique business setting.

 Home
Home