Program Management Dashboard

Online Business Strategy Market Research And Performance Analytics Ppt Powerpoint Presentation Infographics Images
This is a online business strategy market research and performance analytics ppt powerpoint presentation infographics images. This is a five stage process. The stages in this process are ecommerce, mercantilism, commercialism.

Seven Fundamentals To Formulate Organizational Data Strategy Demonstration PDF
This slide showcases seven principles to help company design effective organizational strategy for better decision making. It includes information such as Governanace, data content, quality, access, analytics, etc. Presenting Seven Fundamentals To Formulate Organizational Data Strategy Demonstration PDF to dispense important information. This template comprises seven stages. It also presents valuable insights into the topics including Governance, Data Content, Data Quality. This is a completely customizable PowerPoint theme that can be put to use immediately. So, download it and address the topic impactfully.

Evaluation Criteria For ERP Software To Conduct Procurement Analysis Infographics PDF
This slide covers the requirements for the software to maintain proper functioning of the procurement process. It also includes KPIs such as amount or ERPs source systems, amount of taxonomy levels required etc.Deliver and pitch your topic in the best possible manner with this Evaluation Criteria For ERP Software To Conduct Procurement Analysis Infographics PDF. Use them to share invaluable insights on Description Of Categorization, Invoices And Purchase, Amount Of Taxonomy and impress your audience. This template can be altered and modified as per your expectations. So, grab it now.
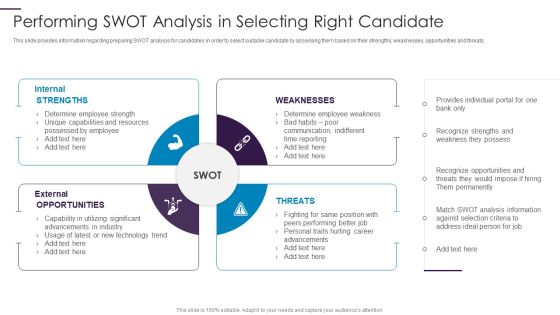
New Hire Onboarding Process Enhancement Performing Swot Analysis In Selecting Right Candidate Infographics PDF
This slide provides information regarding preparing SWOT analysis for candidates in order to select suitable candidate by assessing them based on their strengths, weaknesses, opportunities and threats. Presenting New Hire Onboarding Process Enhancement Performing Swot Analysis In Selecting Right Candidate Infographics PDF to provide visual cues and insights. Share and navigate important information on four stages that need your due attention. This template can be used to pitch topics like Weaknesses, Threats, External Opportunities. In addtion, this PPT design contains high resolution images, graphics, etc, that are easily editable and available for immediate download.

Business Synergies M And A Synergy Performance Tracker Ppt Infographic Template Gridlines PDF
This is a business synergies m and a synergy performance tracker ppt infographic template gridlines pdf template with various stages. Focus and dispense information on five stages using this creative set, that comes with editable features. It contains large content boxes to add your information on topics like shareholder value, cash flow, production capacity. You can also showcase facts, figures, and other relevant content using this PPT layout. Grab it now.

Techniques To Enhance Customer Engagement Via Digital Platforms Emerging Trends In Mobile Shopping Industry With Key Statistics Mockup PDF
This slide includes statistics related to mobile commerce market size, average time spend by consumers on phone and age based categorization of consumers who do research online before making a purchase. Are you in need of a template that can accommodate all of your creative concepts. This one is crafted professionally and can be altered to fit any style. Use it with Google Slides or PowerPoint. Include striking photographs, symbols, depictions, and other visuals. Fill, move around, or remove text boxes as desired. Test out color palettes and font mixtures. Edit and save your work, or work with colleagues. Download Techniques To Enhance Customer Engagement Via Digital Platforms Emerging Trends In Mobile Shopping Industry With Key Statistics Mockup PDF and observe how to make your presentation outstanding. Give an impeccable presentation to your group and make your presentation unforgettable.
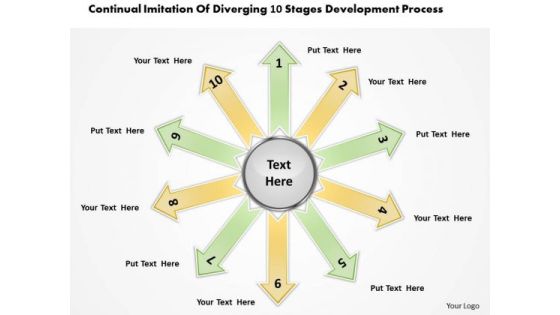
Imitation Of Diverging 10 Stages Development Process Ppt Pie Diagram PowerPoint Templates
We present our imitation of diverging 10 stages development process ppt Pie Diagram PowerPoint templates.Download our Arrows PowerPoint Templates because this layout helps you to see satisfaction spread across the room as they unravel your gifted views. Use our Circle Charts PowerPoint Templates because this Layout can explain the relevance of the different layers and stages in getting down to your core competence, ability and desired result. Use our Shapes PowerPoint Templates because it has inspired a whole new world of medical endeavour. Download our Business PowerPoint Templates because you can Lead your flock steadily to greater heights. Look around at the vast potential of achievement around you. Present our Flow Charts PowerPoint Templates because this is an excellent slide to detail and highlight your thought process, your views and your positive expectations..Use these PowerPoint slides for presentations relating to arrow, arrowheads, badge, banner, blue, button, cerulean, cobalt, colored, colorful, connection, cursor, cyan, design element, designator, icon, indicator, interface, internet, link, load, magenta, marker, matted, menu tool, navigation panel, next, orientation, page site, pictogram, pink, pointer, red, right, satined, sign, signpost, smooth, symbol, . The prominent colors used in the PowerPoint template are Yellow, Green, Gray. Presenters tell us our imitation of diverging 10 stages development process ppt Pie Diagram PowerPoint templates are Attractive. You can be sure our button PowerPoint templates and PPT Slides will make the presenter successul in his career/life. Professionals tell us our imitation of diverging 10 stages development process ppt Pie Diagram PowerPoint templates will impress their bosses and teams. People tell us our button PowerPoint templates and PPT Slides are Elevated. People tell us our imitation of diverging 10 stages development process ppt Pie Diagram PowerPoint templates provide great value for your money. Be assured of finding the best projection to highlight your words. Professionals tell us our blue PowerPoint templates and PPT Slides are Pretty.

6 Stage Infographic For Rewarding Good Performance Ppt PowerPoint Presentation File Model PDF
Presenting 6 stage infographic for rewarding good performance ppt powerpoint presentation file model pdf to dispense important information. This template comprises six stages. It also presents valuable insights into the topics including 6 stage infographic for rewarding good performance. This is a completely customizable PowerPoint theme that can be put to use immediately. So, download it and address the topic impactfully.
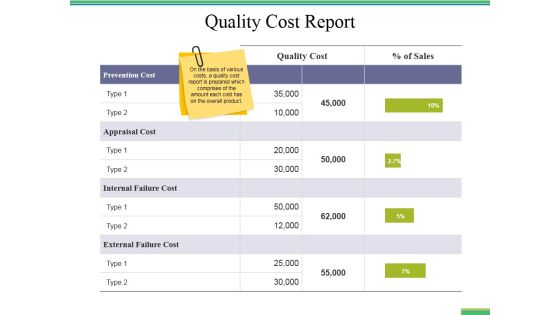
Quality Cost Report Ppt PowerPoint Presentation Styles Infographic Template
This is a quality cost report ppt powerpoint presentation styles infographic template. This is a five stage process. The stages in this process are business, finance, marketing, strategy, bar graph, analysis.

quality cost report ppt powerpoint presentation inspiration images
This is a quality cost report ppt powerpoint presentation inspiration images. This is a five stage process. The stages in this process are business, finance, marketing, analysis, quality cost.

Comprehensive Guide For Sales And Advertising Processes Benefits And Limitations Of Marketing Enterprises Pictures PDF
This slide highlights various advantages and disadvantages of using marketing concept on business to promote products services among audience. It presents benefits like broadens market area, increase brand awareness, increase business revenue and limitation such as budgetary and time constraints and data reliability. Explore a selection of the finest Comprehensive Guide For Sales And Advertising Processes Benefits And Limitations Of Marketing Enterprises Pictures PDF here. With a plethora of professionally designed and pre-made slide templates, you can quickly and easily find the right one for your upcoming presentation. You can use our Comprehensive Guide For Sales And Advertising Processes Benefits And Limitations Of Marketing Enterprises Pictures PDF to effectively convey your message to a wider audience. Slidegeeks has done a lot of research before preparing these presentation templates. The content can be personalized and the slides are highly editable. Grab templates today from Slidegeeks.
Multistep Process To Create KPI Framework Ppt PowerPoint Presentation Icon Styles PDF
This slide illustrates process to create key performance indicator framework which includes steps such as awareness, engagement, conversion and loyalty. It also includes the different types of kpis for each stage. Persuade your audience using this multistep process to create kpi framework ppt powerpoint presentation icon styles pdf This PPT design covers four stages, thus making it a great tool to use. It also caters to a variety of topics including awareness, conversion, engagement Download this PPT design now to present a convincing pitch that not only emphasizes the topic but also showcases your presentation skills.
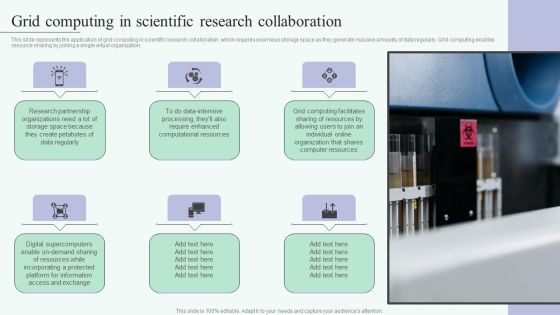
Grid Computing For High Performance Solutions Grid Computing In Scientific Research Infographics PDF
This slide represents the application of grid computing in scientific research collaboration, which requires enormous storage space as they generate massive amounts of data regularly. Grid computing enables resource sharing by joining a single virtual organization. Get a simple yet stunning designed Grid Computing For High Performance Solutions Grid Computing In Scientific Research Infographics PDF. It is the best one to establish the tone in your meetings. It is an excellent way to make your presentations highly effective. So, download this PPT today from Slidegeeks and see the positive impacts. Our easy to edit Grid Computing For High Performance Solutions Grid Computing In Scientific Research Infographics PDF can be your go to option for all upcoming conferences and meetings. So, what are you waiting for Grab this template today.
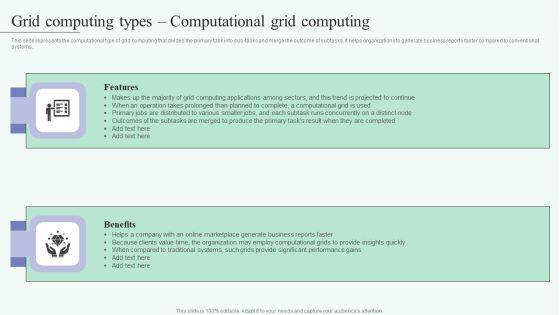
Grid Computing For High Performance Solutions Grid Computing Types Computational Grid Infographics PDF
This slide represents the computational type of grid computing that divides the primary task into sub-tasks and merge the outcome of subtasks. It helps organizations to generate business reports faster compared to conventional systems. Crafting an eye catching presentation has never been more straightforward. Let your presentation shine with this tasteful yet straightforward Grid Computing For High Performance Solutions Grid Computing Types Computational Grid Infographics PDF template. It offers a minimalistic and classy look that is great for making a statement. The colors have been employed intelligently to add a bit of playfulness while still remaining professional. Construct the ideal Grid Computing For High Performance Solutions Grid Computing Types Computational Grid Infographics PDF that effortlessly grabs the attention of your audience. Begin now and be certain to wow your customers.

Different Type Of Metaverses For Creating Virtual Environment Ppt Infographic Template Example Introduction PDF
This slide provides information regarding different types of metaverse in terms of centralized or decentralized metaverse. Both of the metaverse are different based on the controlling power of the virtual environment. This Different Type Of Metaverses For Creating Virtual Environment Ppt Infographic Template Example Introduction PDF from Slidegeeks makes it easy to present information on your topic with precision. It provides customization options, so you can make changes to the colors, design, graphics, or any other component to create a unique layout. It is also available for immediate download, so you can begin using it right away. Slidegeeks has done good research to ensure that you have everything you need to make your presentation stand out. Make a name out there for a brilliant performance.
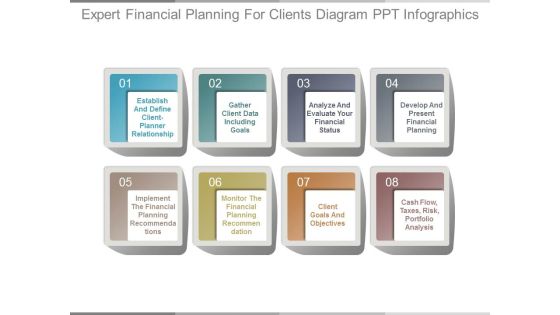
Expert Financial Planning For Clients Diagram Ppt Infographics
This is a expert financial planning for clients diagram ppt infographics. This is a ten stage process. The stages in this process are establish and define client planner relationship, gather client data including goals, analyze and evaluate your financial status, develop and present financial planning, implement the financial planning recommendations, monitor the financial planning recommendation, client goals and objectives, cash flow, taxes, risk, portfolio analysis.

Stock Market Research Report Liquidity Ratio FY 19 For Equity Research Diagrams PDF
The following slide displays the analysis of the companies liquidity ratio of the financial year 19 as its analysis the current ratio, quick ratio and the net working capital of the organization. This is a stock market research report liquidity ratio fy 19 for equity research diagrams pdf template with various stages. Focus and dispense information on one stages using this creative set, that comes with editable features. It contains large content boxes to add your information on topics like current ratio, quick ratio, current asset, current liability, current asset, inventory, current liability. You can also showcase facts, figures, and other relevant content using this PPT layout. Grab it now.

Roadmap To Integrate Oracle Analytics Cloud In The Organization Formats Infographics PDF
This slide represents the timeline for implementing Oracle Analytics Cloud in the organization, and it shows the tasks that we will perform in each interval of time. Presenting roadmap to integrate oracle analytics cloud in the organization formats infographics pdf to provide visual cues and insights. Share and navigate important information on four stages that need your due attention. This template can be used to pitch topics like. In addtion, this PPT design contains high resolution images, graphics, etc, that are easily editable and available for immediate download.
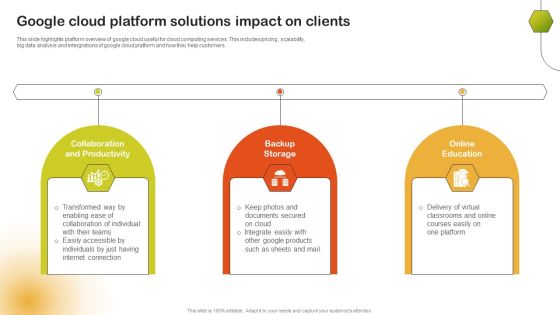
Google Cloud Platform Solutions Impact On Clients Microsoft PDF
This slide highlights platform overview of google cloud useful for cloud computing services. This includes pricing , scalability, big data analysis and intergrations of google cloud platform and how they help customers. Present like a pro with Google Cloud Platform Solutions Impact On Clients Microsoft PDF Create beautiful presentations together with your team, using our easy-to-use presentation slides. Share your ideas in real-time and make changes on the fly by downloading our templates. So whether you are in the office, on the go, or in a remote location, you can stay in sync with your team and present your ideas with confidence. With Slidegeeks presentation got a whole lot easier. Grab these presentations today.

8 Steps Infographic Stages For Data Information And Knowledge Ppt Powerpoint Presentation Gallery Guide Pdf
Persuade your audience using this 8 steps infographic stages for data information and knowledge ppt powerpoint presentation gallery guide pdf. This PPT design covers eight stages, thus making it a great tool to use. It also caters to a variety of topics including 8 steps infographic stages for data information and knowledge. Download this PPT design now to present a convincing pitch that not only emphasizes the topic but also showcases your presentation skills.

Seven Colored Concentric Circles Infographic For Big Data Engineer Career Path Professional PDF
Presenting seven colored concentric circles infographic for big data engineer career path professional pdf to dispense important information. This template comprises seven stages. It also presents valuable insights into the topics including seven colored concentric circles infographic for big data engineer career path. This is a completely customizable PowerPoint theme that can be put to use immediately. So, download it and address the topic impactfully.

5 Step Guide For Transitioning To Blue Ocean Strategy Four Hurdles To Strategy Execution Mockup PDF
This template cover four types of hurdles to strategy execution that companies can face while developing a blue ocean strategy with a profitable business model. The 4 type of hurdles are cognitive hurdle, resource hurdle, motivational hurdle and political hurdle. The 5 Step Guide For Transitioning To Blue Ocean Strategy Four Hurdles To Strategy Execution Mockup PDF is a compilation of the most recent design trends as a series of slides. It is suitable for any subject or industry presentation, containing attractive visuals and photo spots for businesses to clearly express their messages. This template contains a variety of slides for the user to input data, such as structures to contrast two elements, bullet points, and slides for written information. Slidegeeks is prepared to create an impression.
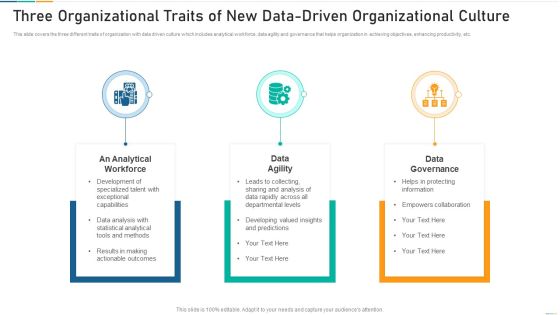
Three Organizational Traits Of New Data Driven Organizational Culture Themes PDF
Persuade your audience using this three organizational traits of new data driven organizational culture themes pdf. This PPT design covers three stages, thus making it a great tool to use. It also caters to a variety of topics including data agility, data governance, an analytical workforce. Download this PPT design now to present a convincing pitch that not only emphasizes the topic but also showcases your presentation skills.

Arrows Pointing Different Directions Circular Flow Chart PowerPoint Templates
We present our arrows pointing different directions Circular Flow Chart PowerPoint templates.Download our Arrows PowerPoint Templates because you can Amplify your views, ideas and thoughts from very basic aspects to the highly technical and complicated issus using this template as a tool. Download our Business PowerPoint Templates because you can Flutter your wings and enchant the world. Impress them with the innate attractiveness of your thoughts and words. Download our Shapes PowerPoint Templates because this slide depicts the occasion for gifting and giving. Download our Metaphors-Visual Concepts PowerPoint Templates because you can Present your views on the methods using our self-explanatory templates. Use our Flow Charts PowerPoint Templates because it Saves your time as a prized possession, an ideal aid to give an ideal presentation.Use these PowerPoint slides for presentations relating to arrow, arrowheads, badge, banner, blue, button, cerulean, cobalt, colored, colorful, connection, cursor, cyan, design element, designator, directional, download, emblem, gray shadow, green, icon, indicator, interface, internet, link, load, magenta, marker, matted, menu tool, navigation panel, next, orientation, page site, pictogram, pink, pointer, red, right, satined, sign, signpost, smooth, symbol, upload, vector illustration, web, web 2.0, white background. The prominent colors used in the PowerPoint template are Green, Blue, Orange. Presenters tell us our arrows pointing different directions Circular Flow Chart PowerPoint templates have awesome images to get your point across. You can be sure our colored PowerPoint templates and PPT Slides are Functional. Professionals tell us our arrows pointing different directions Circular Flow Chart PowerPoint templates are visually appealing. People tell us our banner PowerPoint templates and PPT Slides are Nice. People tell us our arrows pointing different directions Circular Flow Chart PowerPoint templates are Efficacious. Professionals tell us our blue PowerPoint templates and PPT Slides are Royal.

Central Repository Data Lake Overview Icons PDF
This slide represents the overview of data lake is and how it stores machine learning, analytics, on premise data movement, real time data movement. Here you can discover an assortment of the finest PowerPoint and Google Slides templates. With these templates, you can create presentations for a variety of purposes while simultaneously providing your audience with an eye catching visual experience. Download Central Repository Data Lake Overview Icons PDF to deliver an impeccable presentation. These templates will make your job of preparing presentations much quicker, yet still, maintain a high level of quality. Slidegeeks has experienced researchers who prepare these templates and write high quality content for you. Later on, you can personalize the content by editing the Central Repository Data Lake Overview Icons PDF.
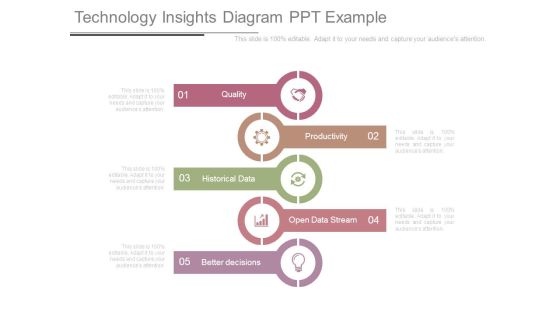
Technology Insights Diagram Ppt Example
This is a technology insights diagram ppt example. This is a five stage process. The stages in this process are quality, productivity, historical data, open data stream, better decisions.
Strategic Marketing Campaign Tracking Document Template PDF
This slide outlines report if tracking marketing campaigns aimed at coordinate planning of marketing activities to systematically execute planned strategies. It covers analysis of three campaigns based on key marketing metrics. Showcasing this set of slides titled Strategic Marketing Campaign Tracking Document Template PDF. The topics addressed in these templates are Conversion Rate, Bounce Rate, Engagement Rate . All the content presented in this PPT design is completely editable. Download it and make adjustments in color, background, font etc. as per your unique business setting.

Data Parts As Whole 5 Stages Ppt Business Plan Template PowerPoint Templates
We present our data parts as whole 5 stages ppt business plan template PowerPoint templates.Download and present our Process and Flows PowerPoint Templates because You can Zap them with our PowerPoint Templates and Slides. See them reel under the impact. Present our Business PowerPoint Templates because You can Connect the dots. Fan expectations as the whole picture emerges. Download our Shapes PowerPoint Templates because Our PowerPoint Templates and Slides will let Your superior ideas hit the target always and everytime. Present our Flow Charts PowerPoint Templates because You can Hit the nail on the head with our PowerPoint Templates and Slides. Embed your ideas in the minds of your audience. Present our Marketing PowerPoint Templates because Our PowerPoint Templates and Slides will let your team Walk through your plans. See their energy levels rise as you show them the way.Use these PowerPoint slides for presentations relating to Chart, pentagon, flow, five, circular, icon, round, hexagon, shape, around, symbol, movement, cyclic, isolated, square, vibrant, triangle, refresh,sign, rotation, glossy, circle, ring, element, abstract, cycle, circulation, illustration, section, direction, motion, set, circles, circular flow. The prominent colors used in the PowerPoint template are Yellow, White, Gray.

Data Mining Implementation Tools For Data Mining Natural Language Toolkit NLTK Microsoft PDF
This slide describes the Natural Language Toolkit used in data science and its features such as Python Library, text analytics, natural language processing, included text corpora, and open source. Presenting data mining implementation tools for data mining natural language toolkit nltk microsoft pdf to provide visual cues and insights. Share and navigate important information on six stages that need your due attention. This template can be used to pitch topics like algorithms make computers, understand the human language, natural language In addtion, this PPT design contains high resolution images, graphics, etc, that are easily editable and available for immediate download.
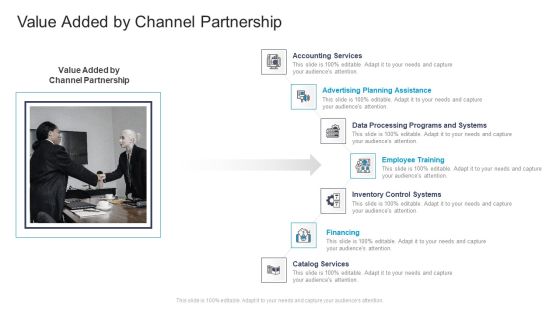
Value Added By Channel Partnership Commercial Marketing Guidelines And Tactics Guidelines PDF
This is a value added by channel partnership commercial marketing guidelines and tactics guidelines pdf template with various stages. Focus and dispense information on seven stages using this creative set, that comes with editable features. It contains large content boxes to add your information on topics like accounting services, planning assistance, data processing, employee training, financing. You can also showcase facts, figures, and other relevant content using this PPT layout. Grab it now.
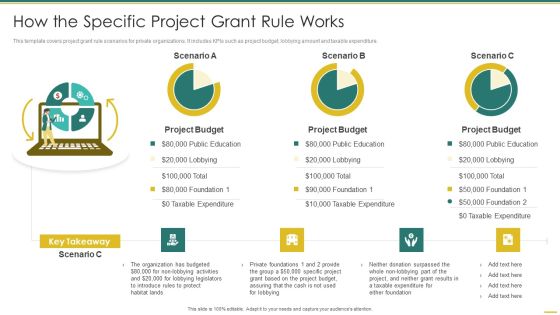
Philanthropy Defense Playbook How The Specific Project Grant Rule Works Ideas PDF
This template covers project grant rule scenarios for private organizations. It includes KPIs such as project budget, lobbying amount and taxable expenditure. Deliver an awe inspiring pitch with this creative Philanthropy Defense Playbook How The Specific Project Grant Rule Works Ideas PDF bundle. Topics like How The Specific Project Grant Rule Works can be discussed with this completely editable template. It is available for immediate download depending on the needs and requirements of the user.
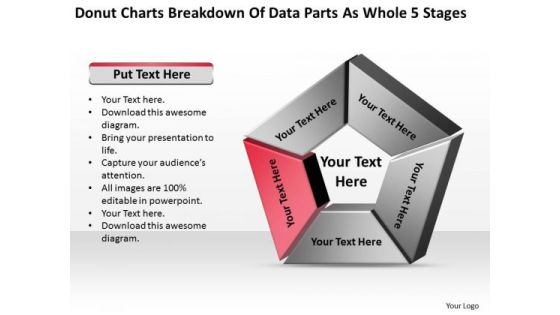
Data Parts As Whole 5 Stages Real Estate Investing Business Plan PowerPoint Slides
We present our data parts as whole 5 stages real estate investing business plan PowerPoint Slides.Present our Process and Flows PowerPoint Templates because Our PowerPoint Templates and Slides come in all colours, shades and hues. They help highlight every nuance of your views. Download and present our Business PowerPoint Templates because Our PowerPoint Templates and Slides will weave a web of your great ideas. They are gauranteed to attract even the most critical of your colleagues. Download and present our Shapes PowerPoint Templates because you can Add colour to your speech with our PowerPoint Templates and Slides. Your presentation will leave your audience speechless. Download our Flow Charts PowerPoint Templates because Our PowerPoint Templates and Slides will let you Illuminate the road ahead to Pinpoint the important landmarks along the way. Present our Marketing PowerPoint Templates because Our PowerPoint Templates and Slides has conjured up a web of all you need with the help of our great team. Use them to string together your glistening ideas.Use these PowerPoint slides for presentations relating to Chart, pentagon, flow, five, circular, icon, round, hexagon, shape, around, symbol, movement, cyclic, isolated, square, vibrant, triangle, refresh,sign, rotation, glossy, circle, ring, element, abstract, cycle, circulation, illustration, section, direction, motion, set, circles, circular flow. The prominent colors used in the PowerPoint template are Red, Gray, White.
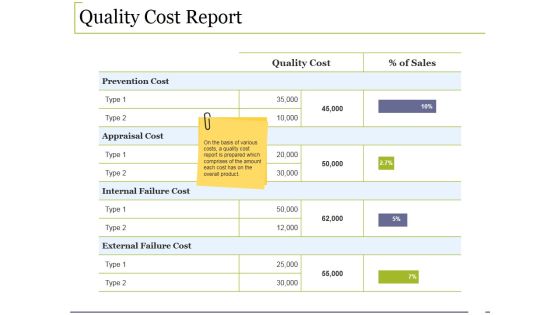
Quality Cost Report Ppt PowerPoint Presentation Summary Show
This is a quality cost report ppt powerpoint presentation summary show. This is a five stage process. The stages in this process are finance, analysis, strategy, business, marketing.

Artificial Intelligence To Monitor Server Performance Ppt PowerPoint Presentation File Guide PDF
Presenting artificial intelligence to monitor server performance ppt powerpoint presentation file guide pdf to dispense important information. This template comprises four stages. It also presents valuable insights into the topics including algorithms, data creation and curation, smart interaction testing. This is a completely customizable PowerPoint theme that can be put to use immediately. So, download it and address the topic impactfully.
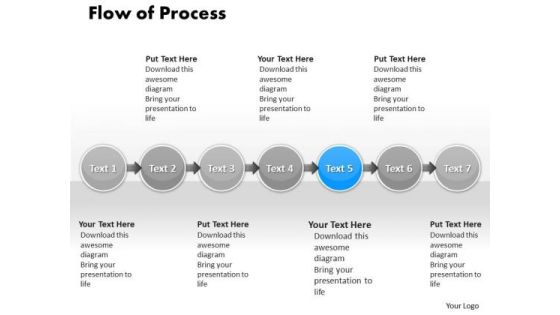
Ppt Seven PowerPoint Slide Numbers Continuous Flow Theme Of Process Templates
PPT seven powerpoint slide numbers continuous flow theme of process Templates-This Diagram is used to illustrate how information will move between interrelated systems in the accomplishment of a given function, task or process. The visual description of this information flow with each given level showing how data is fed into a given process step and subsequently passed along at the completion of that step.-PPT seven powerpoint slide numbers continuous flow theme of process Templates-Analysis, Arrow, Background, Backlink, Circle, Code, Content, Diagram, Engine, Illustration, Keyword, Optimization, Offpage, Process, Search, Template, Tracking, Unpage, Violet, Visitor,
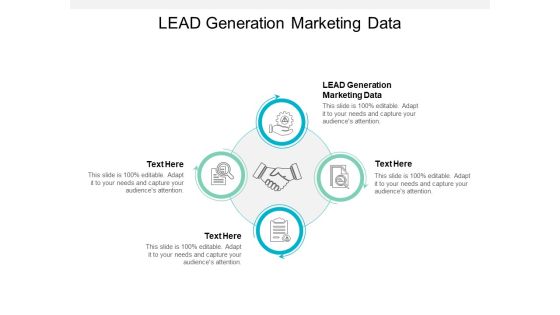
Lead Generation Marketing Data Ppt PowerPoint Presentation Inspiration Templates
Presenting this set of slides with name lead generation marketing data ppt powerpoint presentation inspiration templates. This is an editable Powerpoint four stages graphic that deals with topics like lead generation marketing data to help convey your message better graphically. This product is a premium product available for immediate download, and is 100 percent editable in Powerpoint. Download this now and use it in your presentations to impress your audience.
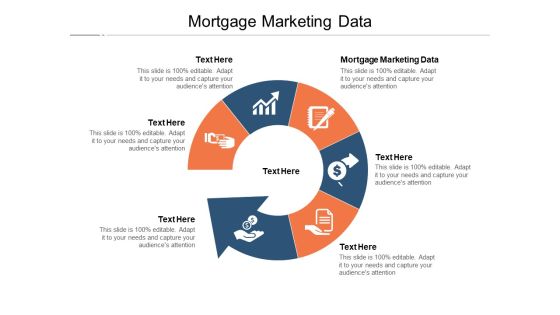
Mortgage Marketing Data Ppt PowerPoint Presentation Inspiration Sample Cpb Pdf
Presenting this set of slides with name mortgage marketing data ppt powerpoint presentation inspiration sample cpb pdf. This is an editable Powerpoint six stages graphic that deals with topics like mortgage marketing data to help convey your message better graphically. This product is a premium product available for immediate download and is 100 percent editable in Powerpoint. Download this now and use it in your presentations to impress your audience.
Market Data Licensing Ppt PowerPoint Presentation Icon Gridlines Cpb Pdf
Presenting this set of slides with name market data licensing ppt powerpoint presentation icon gridlines cpb pdf. This is an editable Powerpoint four stages graphic that deals with topics like market data licensing to help convey your message better graphically. This product is a premium product available for immediate download and is 100 percent editable in Powerpoint. Download this now and use it in your presentations to impress your audience.
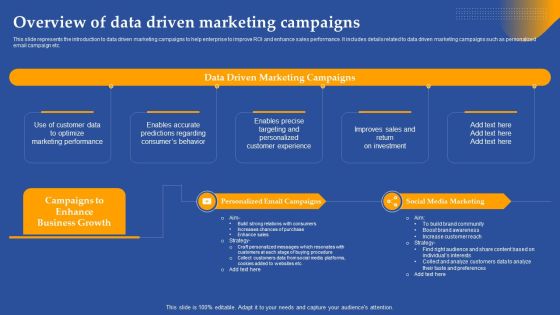
Overview Of Data Driven Marketing Campaigns Ppt Summary Objects PDF
This slide represents the introduction to data driven marketing campaigns to help enterprise to improve ROI and enhance sales performance. It includes details related to data driven marketing campaigns such as personalized email campaign etc. Take your projects to the next level with our ultimate collection of Overview Of Data Driven Marketing Campaigns Ppt Summary Objects PDF. Slidegeeks has designed a range of layouts that are perfect for representing task or activity duration, keeping track of all your deadlines at a glance. Tailor these designs to your exact needs and give them a truly corporate look with your own brand colors they will make your projects stand out from the rest.
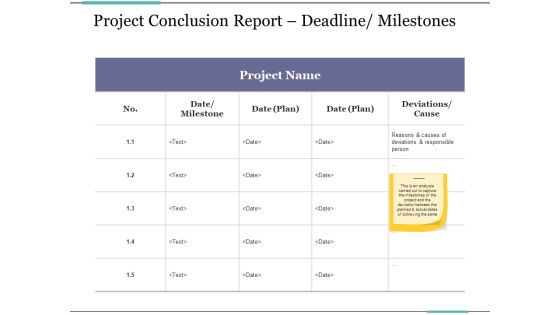
Project Conclusion Report Deadline Milestones Ppt PowerPoint Presentation Infographics Topics
This is a project conclusion report deadline milestones ppt powerpoint presentation infographics topics. This is a five stage process. The stages in this process are business, date milestone, deviations cause, marketing, planning.

Online Marketing Report Ppt PowerPoint Presentation Complete Deck With Slides
Share a great deal of information on the topic by deploying this Online Marketing Report Ppt PowerPoint Presentation Complete Deck With Slides. Support your ideas and thought process with this prefabricated set. It includes a set of sixteen slides, all fully modifiable and editable. Each slide can be restructured and induced with the information and content of your choice. You can add or remove large content boxes as well, to make this PPT slideshow more personalized. Its high-quality graphics and visuals help in presenting a well-coordinated pitch. This PPT template is also a resourceful tool to take visual cues from and implement the best ideas to help your business grow and expand. The main attraction of this well-formulated deck is that everything is editable, giving you the freedom to adjust it to your liking and choice. Changes can be made in the background and theme as well to deliver an outstanding pitch. Therefore, click on the download button now to gain full access to this multifunctional set.
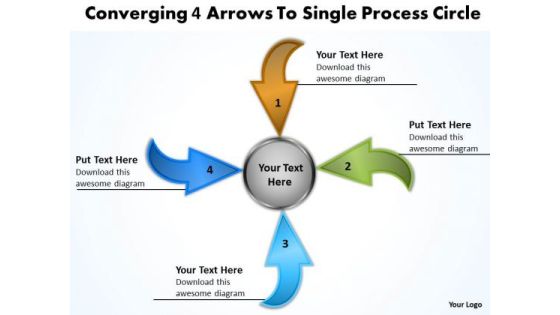
Converging 4 Arrows To Single Process Circle Pie Diagram PowerPoint Templates
We present our converging 4 arrows to single process circle Pie Diagram PowerPoint templates.Download and present our Arrows PowerPoint Templates because you will be able to Highlight your ideas broad-based on strong fundamentals and illustrate how they step by step acheive the set growth factor. Use our Circle Charts PowerPoint Templates because you can present your opinions in this field using our impressive templates. Download our Shapes PowerPoint Templates because displaying your ideas and highlighting your ability will accelerate the growth of your company and yours. Download and present our Business PowerPoint Templates because your ideas too are pinpointedly focused on you goals. Present our Flow Charts PowerPoint Templates because you can Unravel the desired and essential elements of your overall strategy.Use these PowerPoint slides for presentations relating to arrow, arrowheads, badge, banner, blue, button, cerulean, cobalt, colored, colorful, connection, cursor, cyan, design element, designator, directional, download, emblem, gray shadow, green, icon, indicator, interface, internet, link, load, magenta, marker, matted, menu tool, navigation panel, next, orientation, page site, pictogram, pink, pointer, red, right, satined, sign, signpost, smooth, symbol, upload, vector illustration, web, web 2.0, white background. The prominent colors used in the PowerPoint template are Blue, Brown, Green. Presenters tell us our converging 4 arrows to single process circle Pie Diagram PowerPoint templates are Nostalgic. You can be sure our banner PowerPoint templates and PPT Slides are Radiant. Professionals tell us our converging 4 arrows to single process circle Pie Diagram PowerPoint templates are Stylish. People tell us our colored PowerPoint templates and PPT Slides will generate and maintain the level of interest you desire. They will create the impression you want to imprint on your audience. People tell us our converging 4 arrows to single process circle Pie Diagram PowerPoint templates are Handsome. Professionals tell us our banner PowerPoint templates and PPT Slides are Efficient.
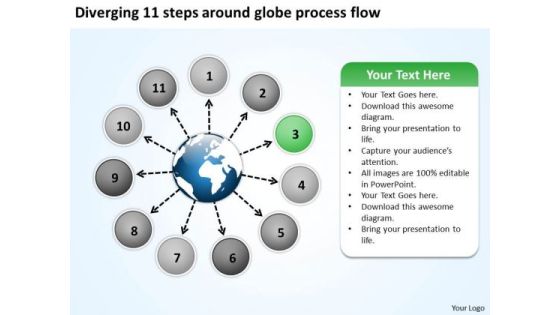
Diverging 11 Steps Around Globe Process Flow Cycle PowerPoint Slides
We present our diverging 11 steps around globe process flow Cycle PowerPoint Slides.Download and present our Globe PowerPoint Templates because you have imbibed from this fountain of ideas and developed some worthwhile views. Download our Business PowerPoint Templates because you are ready to flap your wings and launch off. All poised are you to touch the sky with glory. Use our Circle Charts PowerPoint Templates because this PPt slide helps you to measure key aspects of the current process and collect relevant data. Present our Process and flows PowerPoint Templates because this diagram helps you to show goal also clearly etched in your mind. Download our Shapes PowerPoint Templates because you are aware of some pitfalls ahead where you need to be cautious not to overrun and avoid a stall.Use these PowerPoint slides for presentations relating to Arrows, business, chart, circle, company,concept, continuity, continuous, cycle,dependency, diagram, direction,dynamic,endless, graph,iteration, iterative, method, path, phase,presentation, process, production,progress, progression, globe,report, rotation,sequence. The prominent colors used in the PowerPoint template are Gray, Black, White. People tell us our diverging 11 steps around globe process flow Cycle PowerPoint Slides are Radiant. Professionals tell us our concept PowerPoint templates and PPT Slides are Fancy. We assure you our diverging 11 steps around globe process flow Cycle PowerPoint Slides are Dynamic. PowerPoint presentation experts tell us our concept PowerPoint templates and PPT Slides are Clever. We assure you our diverging 11 steps around globe process flow Cycle PowerPoint Slides are Nice. People tell us our concept PowerPoint templates and PPT Slides are Detailed.

Data Driven Online Marketing Plan Vector Icon Ppt PowerPoint Presentation Icon Objects PDF
Persuade your audience using this data driven online marketing plan vector icon ppt powerpoint presentation icon objects pdf. This PPT design covers three stages, thus making it a great tool to use. It also caters to a variety of topics including data driven online marketing plan vector icon. Download this PPT design now to present a convincing pitch that not only emphasizes the topic but also showcases your presentation skills.

Ppt Theme Company Pre Procedure In Five Horizontal And Vertical Rulers Stages 4 Design
We present our PPT Theme Company pre procedure in five horizontal and vertical ruler's stages 4 design. Use our Arrows PowerPoint Templates because, the ideas and plans are on your finger tips. Use our Boxes PowerPoint Templates because, Targets: - You have a handle on all the targets, a master of the game, the experienced and consummate juggler. Use our Symbol PowerPoint Templates because; illustrate your plans on using the many social media modes available to inform society at large of the benefits of your product. Use our Process and Flows PowerPoint Templates because, All elements of the venture are equally critical. Use our Marketing PowerPoint Templates because; Take your team along by explaining your plans. Use these PowerPoint slides for presentations relating to Account, Arrow, Arrows, Away, Box, Business, Chart, Choice, Choose, Concept, Concepts, Consultation, Corporate, Design, Diagram, Direction, Elements, Flow, Follow, Follows, Future, Group, Grow, Increase, Lines, Many, Month, Move, Past, Period, Phase, Project, Report, Rise, Row, Step, Success, Text, Time, Timeline, Today, Up, Way, Ways, Work, Year. The prominent colors used in the PowerPoint template are Blue, Gray, and Black
Key Solutions To Overcome The Challenges Ppt Icon Layouts PDF
The slide provides the key solutions which might help the company to overcome its challenges. Key solutions include track customer related metrics, focus more on promotion, personalize and quick services etc. Presenting key solutions to overcome the challenges ppt icon layouts pdf to provide visual cues and insights. Share and navigate important information on four stages that need your due attention. This template can be used to pitch topics like customer related metrics, focus more on promotion, resolve service, personalize services. In addtion, this PPT design contains high resolution images, graphics, etc, that are easily editable and available for immediate download.

Work Stages Involved In Team Development In A Company Infographics PDF
The slide showcases phases of work done by the team to ensure group development and effective completion of projects within a company. The students are setting up, storming, constructing norms, performing, adjourning, etc. Presenting Work Stages Involved In Team Development In A Company Infographics PDF to dispense important information. This template comprises five stages. It also presents valuable insights into the topics including Setting Up, Storming, Constructing Norms. This is a completely customizable PowerPoint theme that can be put to use immediately. So, download it and address the topic impactfully.

Methods To Strengthen Retail Marketing Strategy Rules PDF
This slide enlists methods to strengthen retail branding with the purpose of creating successful, sustainable business and generating trustworthy customer experience. It covers adaptation to trends, technology, personalize shopping experience, good design and customer relationships. Presenting Methods To Strengthen Retail Marketing Strategy Rules PDF to dispense important information. This template comprises five stages. It also presents valuable insights into the topics including Adapt Trends, Technology, Personalize Shopping Experience. This is a completely customizable PowerPoint theme that can be put to use immediately. So, download it and address the topic impactfully.

Overview Of Data Driven Marketing Campaigns Diagrams PDF
This slide represents the introduction to data driven marketing campaigns to help enterprise to improve ROI and enhance sales performance. It includes details related to data driven marketing campaigns such as personalized email campaign etc. Slidegeeks is one of the best resources for PowerPoint templates. You can download easily and regulate Overview Of Data Driven Marketing Campaigns Diagrams PDF for your personal presentations from our wonderful collection. A few clicks is all it takes to discover and get the most relevant and appropriate templates. Use our Templates to add a unique zing and appeal to your presentation and meetings. All the slides are easy to edit and you can use them even for advertisement purposes.
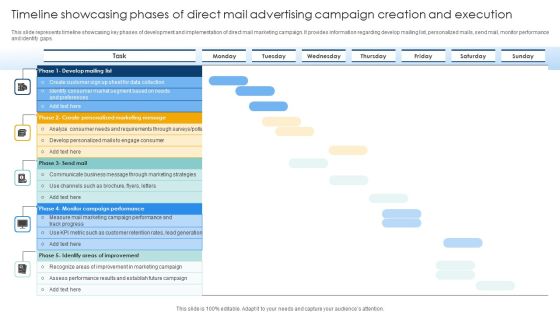
Timeline Showcasing Phases Of Direct Mail Advertising Campaign Creation And Execution Infographics PDF
This slide represents timeline showcasing key phases of development and implementation of direct mail marketing campaign. It provides information regarding develop mailing list, personalized mails, send mail, monitor performance and identify gaps. Showcasing this set of slides titled Timeline Showcasing Phases Of Direct Mail Advertising Campaign Creation And Execution Infographics PDF. The topics addressed in these templates are Develop Mailing List, Create Personalized Marketing Message, Send Mail. All the content presented in this PPT design is completely editable. Download it and make adjustments in color, background, font etc. as per your unique business setting.

Digital Health Interventions What Is The Purpose Of Digital Therapeutics Template PDF
This slide talks about the purpose of digital therapeutics that complement and change the traditional healthcare delivery ecosystem. It also includes the features and services DTx allows and offers, such as devices and tools for symptom monitoring and tracking, health data sources, etc. If you are looking for a format to display your unique thoughts, then the professionally designed Digital Health Interventions What Is The Purpose Of Digital Therapeutics Template PDF is the one for you. You can use it as a Google Slides template or a PowerPoint template. Incorporate impressive visuals, symbols, images, and other charts. Modify or reorganize the text boxes as you desire. Experiment with shade schemes and font pairings. Alter, share or cooperate with other people on your work. Download Digital Health Interventions What Is The Purpose Of Digital Therapeutics Template PDF and find out how to give a successful presentation. Present a perfect display to your team and make your presentation unforgettable.

Airtable Capital Funding Pitch Deck Problem Statement Sample PDF
This slide covers problem associated with building application for creating and sharing relational databases. It involves major challenges such as data security, lack of flexibility and scalability, user interface experience and cross platform compatibility. If you are looking for a format to display your unique thoughts, then the professionally designed Airtable Capital Funding Pitch Deck Problem Statement Sample PDF is the one for you. You can use it as a Google Slides template or a PowerPoint template. Incorporate impressive visuals, symbols, images, and other charts. Modify or reorganize the text boxes as you desire. Experiment with shade schemes and font pairings. Alter, share or cooperate with other people on your work. Download Airtable Capital Funding Pitch Deck Problem Statement Sample PDF and find out how to give a successful presentation. Present a perfect display to your team and make your presentation unforgettable.

Secondary Research Approach To Collect Business Information Themes PDF
Following slide provides information of collecting and analysing data using research methodology. It includes description, pros, cons and steps to conduct research. If you are looking for a format to display your unique thoughts, then the professionally designed Secondary Research Approach To Collect Business Information Themes PDF is the one for you. You can use it as a Google Slides template or a PowerPoint template. Incorporate impressive visuals, symbols, images, and other charts. Modify or reorganize the text boxes as you desire. Experiment with shade schemes and font pairings. Alter, share or cooperate with other people on your work. Download Secondary Research Approach To Collect Business Information Themes PDF and find out how to give a successful presentation. Present a perfect display to your team and make your presentation unforgettable.

Process For Effective Drip Email Marketing Campaign Themes PDF
This slide showcase the process of email marketing campaign which results in record breaking revenue and generate stakeholders interest in the product. It include key steps such as define, test, send, measure and report. Presenting Process For Effective Drip Email Marketing Campaign Themes PDF to dispense important information. This template comprises five stages. It also presents valuable insights into the topics including Define, Test, Send. This is a completely customizable PowerPoint theme that can be put to use immediately. So, download it and address the topic impactfully.

Virtual Currency Investment Guide For Companies Bitcoin And Its History Professional PDF
Purpose of the following slide is to show the history of Bitcoin, it can help the organization in understanding the trends and develop a strategic investment plan to maximize the profit for the organization. This is a Virtual Currency Investment Guide For Companies Bitcoin And Its History Professional PDF template with various stages. Focus and dispense information on six stages using this creative set, that comes with editable features. It contains large content boxes to add your information on topics like Original Paper, Identifying Bitcoin Technology, Bitcoin Reaches Value. You can also showcase facts, figures, and other relevant content using this PPT layout. Grab it now.

Estimated Campaign Performance Result Summary Ppt Slide PDF
The following slide depicts the forecasted campaign outcomes to assess potential earnings and spending. It includes key performance indicators such as monthly budget, cost per click, website traffic, conversion rate, average conversion value etc. Coming up with a presentation necessitates that the majority of the effort goes into the content and the message you intend to convey. The visuals of a PowerPoint presentation can only be effective if it supplements and supports the story that is being told. Keeping this in mind our experts created Estimated Campaign Performance Result Summary Ppt Slide PDF to reduce the time that goes into designing the presentation. This way, you can concentrate on the message while our designers take care of providing you with the right template for the situation.
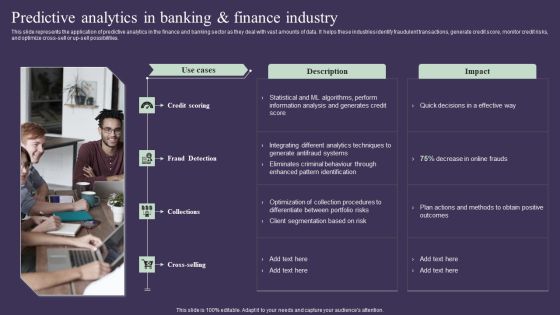
Projection Model Predictive Analytics In Banking And Finance Industry Rules PDF
This slide represents the application of predictive analytics in the finance and banking sector as they deal with vast amounts of data. It helps these industries identify fraudulent transactions, generate credit score, monitor. Take your projects to the next level with our ultimate collection of Projection Model Predictive Analytics In Banking And Finance Industry Rules PDF. Slidegeeks has designed a range of layouts that are perfect for representing task or activity duration, keeping track of all your deadlines at a glance. Tailor these designs to your exact needs and give them a truly corporate look with your own brand colors they will make your projects stand out from the rest

Key Strategies To Close Deals Faster Diagrams PDF
This slide shows the major strategies Push the Best Opportunities Forward, Identify Key Sales Pipeline Metrics, Update the Pipeline, Improve Sales Processes etc. to close the deals faster This is a Key Strategies To Close Deals Faster Diagrams PDF template with various stages. Focus and dispense information on four stages using this creative set, that comes with editable features. It contains large content boxes to add your information on topics like Opportunities, Sales, Metrics, Average. You can also showcase facts, figures, and other relevant content using this PPT layout. Grab it now.
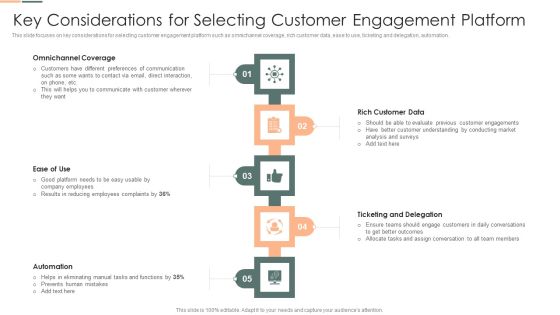
Key Considerations For Selecting Customer Engagement Platform Download PDF
This slide focuses on key considerations for selecting customer engagement platform such as omnichannel coverage, rich customer data, ease to use, ticketing and delegation, automation. Presenting Key Considerations For Selecting Customer Engagement Platform Download PDF to provide visual cues and insights. Share and navigate important information on five stages that need your due attention. This template can be used to pitch topics like Rich Customer Data, Ticketing And Delegation, Omnichannel Coverage. In addtion, this PPT design contains high resolution images, graphics, etc, that are easily editable and available for immediate download.
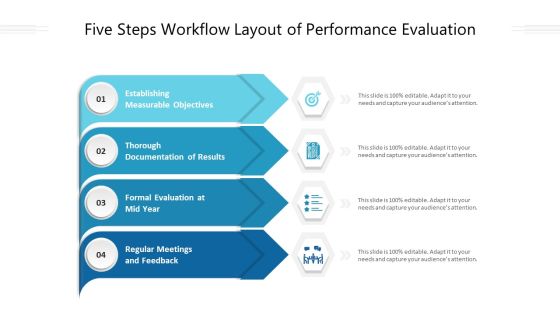
Five Steps Workflow Layout Of Performance Evaluation Ppt PowerPoint Presentation File Infographic Template PDF
Presenting five steps workflow layout of performance evaluation ppt powerpoint presentation file infographic template pdf to dispense important information. This template comprises four stages. It also presents valuable insights into the topics including measurable objectives, formal evaluation, documentation of results. This is a completely customizable PowerPoint theme that can be put to use immediately. So, download it and address the topic impactfully.

 Home
Home