Program Management Dashboard

Data And Customer Analysis Company Outline Global Solutions Measurement Marketing Information PDF
This slide highlights the Nielsen global solutions for measurement, marketing and content which includes audience measurement, media planning, marketing optimization and content metadata. This modern and well arranged Data And Customer Analysis Company Outline Global Solutions Measurement Marketing Information PDF provides lots of creative possibilities. It is very simple to customize and edit with the Powerpoint Software. Just drag and drop your pictures into the shapes. All facets of this template can be edited with Powerpoint no extra software is necessary. Add your own material, put your images in the places assigned for them, adjust the colors, and then you can show your slides to the world, with an animated slide included.

Addressing The Major Roles And Responsibilities For Marketing Campaign Information PDF
Following slide addresses the major roles and responsibilities for content marketing campaign. It includes campaign details, audience details, phase, content asset, channel, goal and KPIs.Deliver and pitch your topic in the best possible manner with this Addressing The Major Roles And Responsibilities For Marketing Campaign Information PDF. Use them to share invaluable insights on Responsibilities, Marketing Manager, Audience Growth and impress your audience. This template can be altered and modified as per your expectations. So, grab it now.

Data Analysis Six Months Procedure Roadmap For Success Ideas
Presenting our innovatively structured data analysis six months procedure roadmap for success ideas Template. Showcase your roadmap process in different formats like PDF, PNG, and JPG by clicking the download button below. This PPT design is available in both Standard Screen and Widescreen aspect ratios. It can also be easily personalized and presented with modified font size, font type, color, and shapes to measure your progress in a clear way.
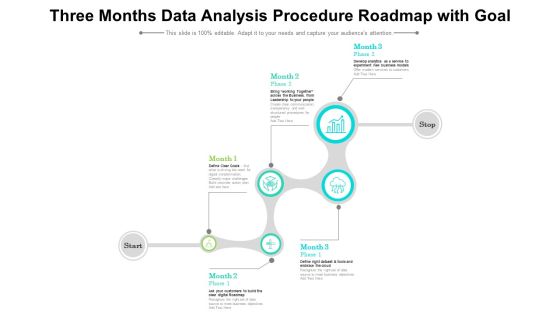
Three Months Data Analysis Procedure Roadmap With Goal Formats
Presenting our innovatively structured three months data analysis procedure roadmap with goal formats Template. Showcase your roadmap process in different formats like PDF, PNG, and JPG by clicking the download button below. This PPT design is available in both Standard Screen and Widescreen aspect ratios. It can also be easily personalized and presented with modified font size, font type, color, and shapes to measure your progress in a clear way.

Comprehensive Analysis Of Different Data Lineage Classification Future Of Data Lineage Technology Ideas PDF
This slide represents the future of data lineage technology, including the data engineering transformation from DevOps to DataOps, case-driven data lineage tools to help data engineers meet data governance challenges, and so on. Are you searching for a Comprehensive Analysis Of Different Data Lineage Classification Future Of Data Lineage Technology Ideas PDF that is uncluttered, straightforward, and original Its easy to edit, and you can change the colors to suit your personal or business branding. For a presentation that expresses how much effort you have put in, this template is ideal With all of its features, including tables, diagrams, statistics, and lists, its perfect for a business plan presentation. Make your ideas more appealing with these professional slides. Download Comprehensive Analysis Of Different Data Lineage Classification Future Of Data Lineage Technology Ideas PDF from Slidegeeks today.
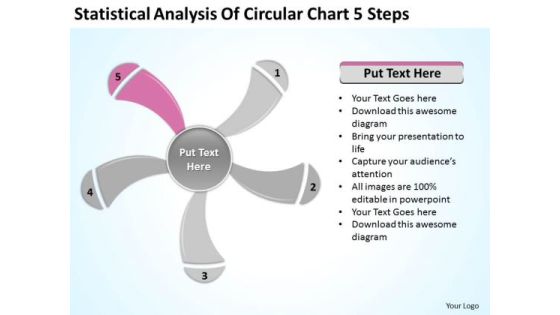
Statistical Analysis Of Circular Chart 5 Steps Ppt Outline For Business Plan PowerPoint Slides
We present our statistical analysis of circular chart 5 steps ppt outline for business plan PowerPoint Slides.Present our Business PowerPoint Templates because Our PowerPoint Templates and Slides will definately Enhance the stature of your presentation. Adorn the beauty of your thoughts with their colourful backgrounds. Download our Signs PowerPoint Templates because They will Put the wind in your sails. Skim smoothly over the choppy waters of the market. Download our Shapes PowerPoint Templates because Our PowerPoint Templates and Slides come in all colours, shades and hues. They help highlight every nuance of your views. Download and present our Metaphors-Visual Concepts PowerPoint Templates because Our PowerPoint Templates and Slides will let your words and thoughts hit bullseye everytime. Download and present our Process and Flows PowerPoint Templates because Our PowerPoint Templates and Slides will help you be quick off the draw. Just enter your specific text and see your points hit home.Use these PowerPoint slides for presentations relating to graphically, graphic, vector, layout, business, computation, sign, infochart, visual, symbol, template, diagram, calculations, sector, data, revenue, schedule, element, analysis, drawing, report, technology, contour, classification, graph, modern, illustration, icon, comparison, object, chart, collection, science, color, growth, composition, professional, set, education, math, profits, information, symmetry, statistic, structure, infographics, button. The prominent colors used in the PowerPoint template are Pink, Gray, White.

Transformation Toolkit Competitive Intelligence Information Analysis Key Considerations In Implementing Data Designs PDF
This slide represents the key challenges of identifying and implementing data analytics for the purpose of decision making. It contains considerations like lack of data analysis tools, resource availability etc. Make sure to capture your audiences attention in your business displays with our gratis customizable Transformation Toolkit Competitive Intelligence Information Analysis Key Considerations In Implementing Data Designs PDF. These are great for business strategies, office conferences, capital raising or task suggestions. If you desire to acquire more customers for your tech business and ensure they stay satisfied, create your own sales presentation with these plain slides.

Cost Saving Benefits Of Implementing Data Center Data Center Relocation Process Step 6 Development Phase Infographics PDF
This slide shows the sixth step that is involved in data center relocation process which is to be implemented for minimizing data center costs and improving scalability i.e. development phase. Crafting an eye catching presentation has never been more straightforward. Let your presentation shine with this tasteful yet straightforward Cost Saving Benefits Of Implementing Data Center Data Center Relocation Process Step 6 Development Phase Infographics PDF template. It offers a minimalistic and classy look that is great for making a statement. The colors have been employed intelligently to add a bit of playfulness while still remaining professional. Construct the ideal Cost Saving Benefits Of Implementing Data Center Data Center Relocation Process Step 6 Development Phase Infographics PDF that effortlessly grabs the attention of your audience Begin now and be certain to wow your customers.

Bar Graph Icon For Data Analysis Ppt PowerPoint Presentation Pictures Ideas
This is a bar graph icon for data analysis ppt powerpoint presentation pictures ideas. This is a four stage process. The stages in this process are financial analysis, quantitative, statistical modelling.

Case Competition Petroleum Sector Issues Case Study Of Using Analytical Solution To Monitor Gas Data Slides PDF
The slide provides a case study of oil and gas company that wants to use a new analytical solution to track and analyse its oil and gas data. The case includes the challenge major point of concern, the solution key points to solve the issue, and the result outcome of the process. Deliver an awe inspiring pitch with this creative case competition petroleum sector issues case study of using analytical solution to monitor gas data slides pdf bundle. Topics like productivity and quality of hydrocarbon, quality of hydrocarbon, extraction system to improve data quality, prompted proper maintenance of gas equipment can be discussed with this completely editable template. It is available for immediate download depending on the needs and requirements of the user.
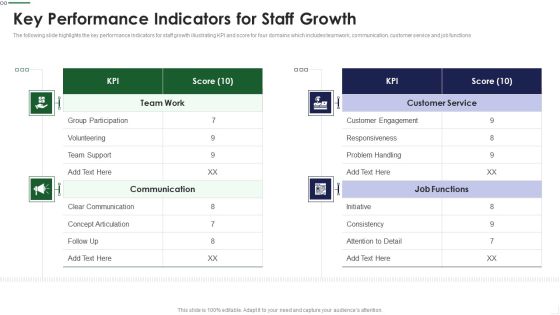
Key Performance Indicators For Staff Growth Topics PDF
The following slide highlights the key performance Indicators for staff growth illustrating KPI and score for four domains which includes teamwork, communication, customer service and job functions Pitch your topic with ease and precision using this Key Performance Indicators For Staff Growth Topics PDF This layout presents information on Customer Engagement, Responsiveness, Problem Handling It is also available for immediate download and adjustment. So, changes can be made in the color, design, graphics or any other component to create a unique layout.
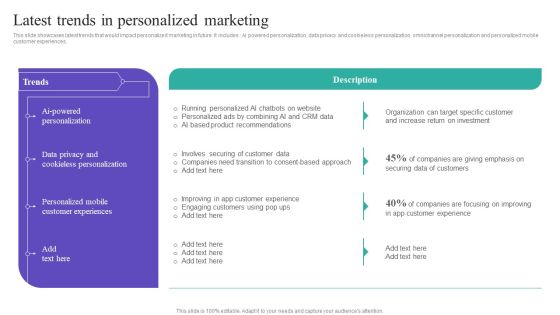
Latest Trends In Personalized Marketing Ideas PDF
This slide showcases latest trends that would impact personalized marketing in future. It includes Ai powered personalization, data privacy and cookieless personalization, omnichannel personalization and personalized mobile customer experiences. Slidegeeks is here to make your presentations a breeze with Latest Trends In Personalized Marketing Ideas PDF With our easy-to-use and customizable templates, you can focus on delivering your ideas rather than worrying about formatting. With a variety of designs to choose from, you are sure to find one that suits your needs. And with animations and unique photos, illustrations, and fonts, you can make your presentation pop. So whether you are giving a sales pitch or presenting to the board, make sure to check out Slidegeeks first

Recruitment Process Template 4 Ppt PowerPoint Presentation Gallery Skills
This is a recruitment process template 4 ppt powerpoint presentation gallery skills. This is a four stage process. The stages in this process are business, marketing, strategy, technology, planning.

Collecting Consumer Qualitative Data For Personalized Marketing Ppt PowerPoint Presentation Diagram Graph Charts PDF
This slide showcases consumer qualitative data that can be collected to formulate personalized marketing campaign. It also shows ways to collect data from different sources Do you have an important presentation coming up Are you looking for something that will make your presentation stand out from the rest Look no further than Collecting Consumer Qualitative Data For Personalized Marketing Ppt PowerPoint Presentation Diagram Graph Charts PDF. With our professional designs, you can trust that your presentation will pop and make delivering it a smooth process. And with Slidegeeks, you can trust that your presentation will be unique and memorable. So why wait Grab Collecting Consumer Qualitative Data For Personalized Marketing Ppt PowerPoint Presentation Diagram Graph Charts PDF today and make your presentation stand out from the rest.

Guidebook For Executing Business Market Intelligence Impact Of Using Market Intelligence Formats PDF
This slide presents statistics showing impact of utilizing tools of market intelligence on organizational performance. It highlights information about accurate and relevant reporting, customer satisfaction, growth trends, data analysis, decision making, profit margins, key insights, competitive advantage and customer retention. This Guidebook For Executing Business Market Intelligence Impact Of Using Market Intelligence Formats PDF is perfect for any presentation, be it in front of clients or colleagues. It is a versatile and stylish solution for organizing your meetings. The product features a modern design for your presentation meetings. The adjustable and customizable slides provide unlimited possibilities for acing up your presentation. Slidegeeks has done all the homework before launching the product for you. So, do not wait, grab the presentation templates today

Working Of Predictive Analytics Models Forward Looking Analysis IT Elements PDF
This slide depicts the working of predictive analytics models that operates iteratively. The main phases in working include business understanding, data understanding, data preparation, modeling, evaluation, and deployment.Slidegeeks is here to make your presentations a breeze with Working Of Predictive Analytics Models Forward Looking Analysis IT Elements PDF With our easy-to-use and customizable templates, you can focus on delivering your ideas rather than worrying about formatting. With a variety of designs to choose from, you are sure to find one that suits your needs. And with animations and unique photos, illustrations, and fonts, you can make your presentation pop. So whether you are giving a sales pitch or presenting to the board, make sure to check out Slidegeeks first.

Apprehending Arrows Process 11 Stages Create Flowchart PowerPoint Templates
We present our apprehending arrows process 11 stages create flowchart PowerPoint templates.Download our Business PowerPoint Templates because you have analysed many global markets and come up with possibilities. Highlight the pros and cons of other likely business oppurtunities. Use our Shapes PowerPoint Templates because you are aware of some pitfalls ahead where you need to be cautious not to overrun and avoid a stall. Present our Process and Flows PowerPoint Templates because you should Demonstrate how you think out of the box. Use our Arrows PowerPoint Templates because they help to lay the base of your trend of thought. Download and present our Signs PowerPoint Templates because colours generate instant reactions in our brains.Use these PowerPoint slides for presentations relating to 3d, Abstract, Around, Arrows, Blue, Border, Business, Center, Circle, Circular, Concept, Connections, Copy, Curve, Cycle, Directions, Distribution, Illustration, Management, Middle, Objects, Pieces, Plan, Pointing, Process, Recycle, Rounded, Shadows, Space, System. The prominent colors used in the PowerPoint template are Green, Gray, Black. People tell us our apprehending arrows process 11 stages create flowchart PowerPoint templates are Excellent. PowerPoint presentation experts tell us our Circle PowerPoint templates and PPT Slides are Glamorous. Presenters tell us our apprehending arrows process 11 stages create flowchart PowerPoint templates are Magnificent. The feedback we get is that our Center PowerPoint templates and PPT Slides are Reminiscent. You can be sure our apprehending arrows process 11 stages create flowchart PowerPoint templates provide you with a vast range of viable options. Select the appropriate ones and just fill in your text. Professionals tell us our Arrows PowerPoint templates and PPT Slides will help them to explain complicated concepts.

Data Analysis Project Plan Business Analysis Modification Toolkit Mockup PDF
This is a Data Analysis Project Plan Business Analysis Modification Toolkit Mockup PDF template with various stages. Focus and dispense information on six stages using this creative set, that comes with editable features. It contains large content boxes to add your information on topics like Issue Understanding, Data Understanding, Data Preparation. You can also showcase facts, figures, and other relevant content using this PPT layout. Grab it now.

Cloud Security Checklist Backup And Data Recovery Cloud Computing Security IT Ppt Styles Rules PDF
This slide represents the importance of data backup and data recovery in cloud security. It also shows how organizations should know about the data backup policies of service providers before investing in them. Presenting cloud security checklist backup and data recovery cloud computing security it ppt styles rules pdf to provide visual cues and insights. Share and navigate important information on three stages that need your due attention. This template can be used to pitch topics like effective, cloud service, natural disasters, data plan. In addtion, this PPT design contains high resolution images, graphics, etc, that are easily editable and available for immediate download.
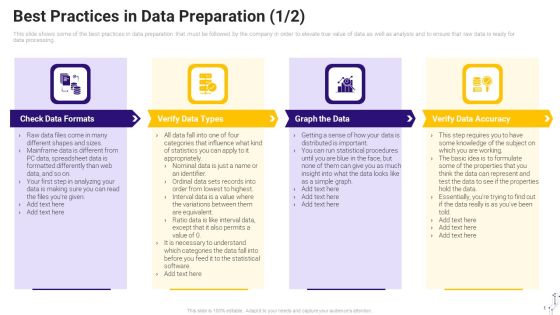
Effective Data Arrangement For Data Accessibility And Processing Readiness Best Practices In Data Preparation Portrait PDF
This slide shows some of the best practices in data preparation that must be followed by the company in order to elevate true value of data as well as analysis and to ensure that raw data is ready for data processing. Presenting effective data arrangement for data accessibility and processing readiness best practices in data preparation portrait pdf to provide visual cues and insights. Share and navigate important information on four stages that need your due attention. This template can be used to pitch topics like identify outliers, deal with missing values, check assumptions about how the data is distributed, back up and document everything. In addtion, this PPT design contains high resolution images, graphics, etc, that are easily editable and available for immediate download.
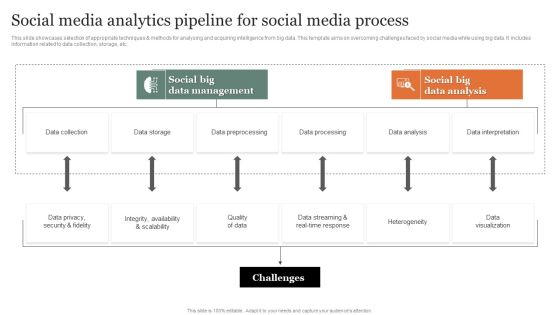
Social Media Analytics Pipeline For Social Media Process Slides PDF
This slide showcases selection of appropriate techniques and methods for analysing and acquiring intelligence from big data. This template aims on overcoming challenges faced by social media while using big data. It includes information related to data collection, storage, etc. Pitch your topic with ease and precision using thisSocial Media Analytics Pipeline For Social Media Process Slides PDF Inspiration. This layout presents information on Data Collection, Data Preprocessing, Security And Fidelity. It is also available for immediate download and adjustment. So, changes can be made in the color, design, graphics or any other component to create a unique layout.

Tour And Travel Agency Marketing Advertising Team Structure For Our Travel Company Mockup PDF
This slide provides glimpse about roles and responsibilities of advertising team with the team reporting structure. It includes team members such as advertising manager, creative director, copywriter, graphic designer, etc. There are so many reasons you need a Tour And Travel Agency Marketing Advertising Team Structure For Our Travel Company Mockup PDF. The first reason is you can not spend time making everything from scratch, Thus, Slidegeeks has made presentation templates for you too. You can easily download these templates from our website easily.

Key Application Areas Data Analytics With Fraud Indicators Ppt PowerPoint Presentation File Background Designs PDF
Persuade your audience using this key application areas data analytics with fraud indicators ppt powerpoint presentation file background designs pdf. This PPT design covers seven stages, thus making it a great tool to use. It also caters to a variety of topics including risk, planning, analytics. Download this PPT design now to present a convincing pitch that not only emphasizes the topic but also showcases your presentation skills.
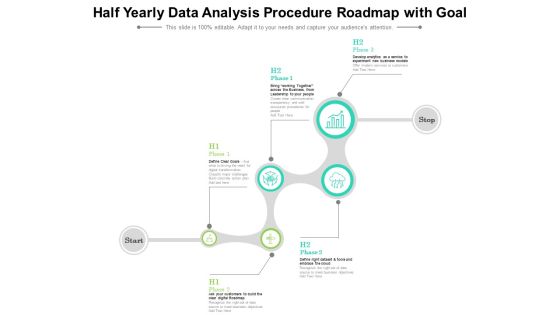
Half Yearly Data Analysis Procedure Roadmap With Goal Summary
Introducing our half yearly data analysis procedure roadmap with goal summary. This PPT presentation is Google Slides compatible, therefore, you can share it easily with the collaborators for measuring the progress. Also, the presentation is available in both standard screen and widescreen aspect ratios. So edit the template design by modifying the font size, font type, color, and shapes as per your requirements. As this PPT design is fully editable it can be presented in PDF, JPG and PNG formats.

Quarterly Data Analysis Procedure Roadmap With Goal Summary
Introducing our quarterly data analysis procedure roadmap with goal summary. This PPT presentation is Google Slides compatible, therefore, you can share it easily with the collaborators for measuring the progress. Also, the presentation is available in both standard screen and widescreen aspect ratios. So edit the template design by modifying the font size, font type, color, and shapes as per your requirements. As this PPT design is fully editable it can be presented in PDF, JPG and PNG formats.
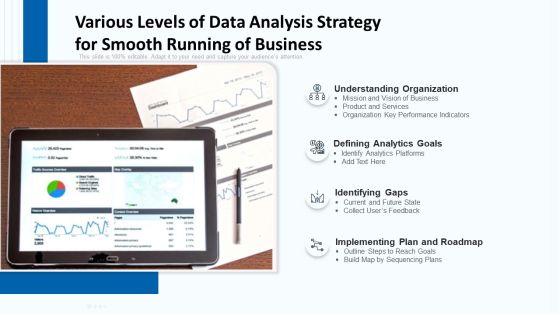
Various Levels Of Data Analysis Strategy For Smooth Running Of Business Inspiration PDF
Persuade your audience using this various levels of data analysis strategy for smooth running of business inspiration pdf.This PPT design covers four stages, thus making it a great tool to use. It also caters to a variety of topics including understanding organization, defining analytics goals, identifying gaps, implementing plan and roadmap. Download this PPT design now to present a convincing pitch that not only emphasizes the topic but also showcases your presentation skills.

4 Data Analytics Type With Prescriptive And Predictive Ppt PowerPoint Presentation File Infographic Template PDF
Presenting 4 data analytics type with prescriptive and predictive ppt powerpoint presentation file infographic template pdf to dispense important information. This template comprises four stages. It also presents valuable insights into the topics including prescriptive, predictive, diagnostic. This is a completely customizable PowerPoint theme that can be put to use immediately. So, download it and address the topic impactfully.

2 Step Procedure Infographic For Data Cardinality Ppt PowerPoint Presentation Gallery Designs Download PDF
Persuade your audience using this 2 step procedure infographic for data cardinality ppt powerpoint presentation gallery designs download pdf. This PPT design covers two stages, thus making it a great tool to use. It also caters to a variety of topics including 2 step procedure infographic for data cardinality. Download this PPT design now to present a convincing pitch that not only emphasizes the topic but also showcases your presentation skills.
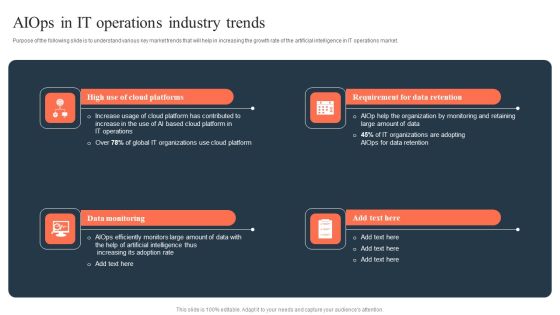
Ml And Big Data In Information Technology Processes Aiops In IT Operations Industry Trends Elements PDF
Purpose of the following slide is to understand various key market trends that will help in increasing the growth rate of the artificial intelligence in IT operations market. Boost your pitch with our creative Ml And Big Data In Information Technology Processes Aiops In IT Operations Industry Trends Elements PDF. Deliver an awe-inspiring pitch that will mesmerize everyone. Using these presentation templates you will surely catch everyones attention. You can browse the ppts collection on our website. We have researchers who are experts at creating the right content for the templates. So you do not have to invest time in any additional work. Just grab the template now and use them.
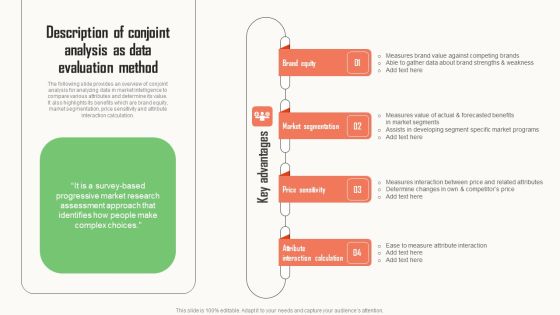
Strategic Market Insight Implementation Guide Description Of Conjoint Analysis As Data Evaluation Method Graphics PDF
The following slide provides an overview of conjoint analysis for analyzing data in market intelligence to compare various attributes and determine its value. It also highlights its benefits which are brand equity, market segmentation, price sensitivity and attribute interaction calculation. Whether you have daily or monthly meetings, a brilliant presentation is necessary. Strategic Market Insight Implementation Guide Description Of Conjoint Analysis As Data Evaluation Method Graphics PDF can be your best option for delivering a presentation. Represent everything in detail using Strategic Market Insight Implementation Guide Description Of Conjoint Analysis As Data Evaluation Method Graphics PDF and make yourself stand out in meetings. The template is versatile and follows a structure that will cater to your requirements. All the templates prepared by Slidegeeks are easy to download and edit. Our research experts have taken care of the corporate themes as well. So, give it a try and see the results.

Transformation Toolkit Competitive Intelligence Information Analysis Communication Best Practices For Data Infographics PDF
This slide highlights the communication plan for translating the data analytics activities to team members with formal channel and frequency. Want to ace your presentation in front of a live audience Our Transformation Toolkit Competitive Intelligence Information Analysis Communication Best Practices For Data Infographics PDF can help you do that by engaging all the users towards you. Slidegeeks experts have put their efforts and expertise into creating these impeccable powerpoint presentations so that you can communicate your ideas clearly. Moreover, all the templates are customizable, and easy to edit and downloadable. Use these for both personal and commercial use.
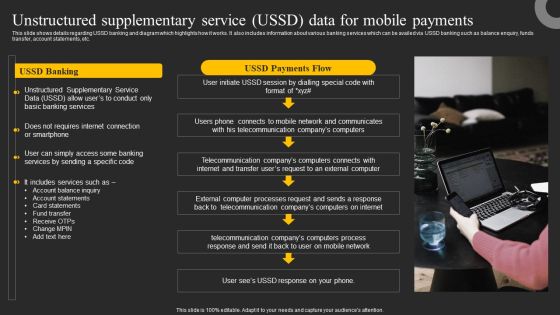
Unstructured Supplementary Service USSD Data For Mobile Payments Ppt Slides Show PDF
This slide shows details regarding USSD banking and diagram which highlights how it works. It also includes information about various banking services which can be availed via USSD banking such as balance enquiry, funds transfer, account statements, etc. The Unstructured Supplementary Service USSD Data For Mobile Payments Ppt Slides Show PDF is a compilation of the most recent design trends as a series of slides. It is suitable for any subject or industry presentation, containing attractive visuals and photo spots for businesses to clearly express their messages. This template contains a variety of slides for the user to input data, such as structures to contrast two elements, bullet points, and slides for written information. Slidegeeks is prepared to create an impression.

Collecting Data For Personalized Mobile Application Marketing Ppt PowerPoint Presentation File Infographics PDF
This slide showcases data that can be collected by organization to formulate personalized mobile application marketing plan. Sample profile and behavioural data of visitor can be collected by organization Whether you have daily or monthly meetings, a brilliant presentation is necessary. Collecting Data For Personalized Mobile Application Marketing Ppt PowerPoint Presentation File Infographics PDF can be your best option for delivering a presentation. Represent everything in detail using Collecting Data For Personalized Mobile Application Marketing Ppt PowerPoint Presentation File Infographics PDF and make yourself stand out in meetings. The template is versatile and follows a structure that will cater to your requirements. All the templates prepared by Slidegeeks are easy to download and edit. Our research experts have taken care of the corporate themes as well. So, give it a try and see the results.

4 Step Arrow Cooperating Processes Business Action Plan PowerPoint Slides
We present our 4 step arrow cooperating processes business action plan PowerPoint Slides.Download and present our Arrows PowerPoint Templates because Our PowerPoint Templates and Slides are aesthetically designed to attract attention. We gaurantee that they will grab all the eyeballs you need. Download our Marketing PowerPoint Templates because You have gained great respect for your brilliant ideas. Use our PowerPoint Templates and Slides to strengthen and enhance your reputation. Download our Finance PowerPoint Templates because Our PowerPoint Templates and Slides are innately eco-friendly. Their high recall value negate the need for paper handouts. Download and present our Business PowerPoint Templates because You can Channelise the thoughts of your team with our PowerPoint Templates and Slides. Urge them to focus on the goals you have set. Present our Shapes PowerPoint Templates because You will get more than you ever bargained for. Use these PowerPoint slides for presentations relating to 3d, Abstract, Accounting, Arrow, Background, Bank, Bar, Benefit, Business, Calculation, Capital, Chart, Company, Connection, Corporate, Data, Design, Diagram, Directive, Earnings, Economy, Enterprise, Finance, Forecast, Graph, Growth, Illustration, Income, Increase, Information, Interest, Internet, Investment, Investor, Management, Market, Measure, Network, Office, Perspective, Plan, Price, Profit, Progress, Rise, Statistics, Technology, Vector, Wealth, World. The prominent colors used in the PowerPoint template are Yellow, Gray, Black. People tell us our 4 step arrow cooperating processes business action plan PowerPoint Slides provide great value for your money. Be assured of finding the best projection to highlight your words. Customers tell us our Benefit PowerPoint templates and PPT Slides are second to none. You can be sure our 4 step arrow cooperating processes business action plan PowerPoint Slides are designed to make your presentations professional. You can be sure our Bank PowerPoint templates and PPT Slides will generate and maintain the level of interest you desire. They will create the impression you want to imprint on your audience. Presenters tell us our 4 step arrow cooperating processes business action plan PowerPoint Slides will make you look like a winner. People tell us our Business PowerPoint templates and PPT Slides will impress their bosses and teams.

5G Network Operations Radio Link Control RLC Layer Functions Graphics PDF
This slide covers the functions of the radio link control sublayer, including packet data convergence protocol transfer, sequence numbering, ARQ correction, SDU re-assembly, SDU RLC rejection, and re-establishment of RLC. Retrieve professionally designed 5G Network Operations Radio Link Control RLC Layer Functions Graphics PDF to effectively convey your message and captivate your listeners. Save time by selecting pre-made slideshows that are appropriate for various topics, from business to educational purposes. These themes come in many different styles, from creative to corporate, and all of them are easily adjustable and can be edited quickly. Access them as PowerPoint templates or as Google Slides themes. You dont have to go on a hunt for the perfect presentation because Slidegeeks got you covered from everywhere.

Predictive Data Model Applications Of Predictive Analytics Fraud Detection Microsoft PDF
This slide represents the application of predictive analytics in fraud detection in various industries. Predictive analytics help combat these frauds by sifting through large amounts of information and submitting the suspicious ones to the investigation teams. Get a simple yet stunning designed Predictive Data Model Applications Of Predictive Analytics Fraud Detection Microsoft PDF. It is the best one to establish the tone in your meetings. It is an excellent way to make your presentations highly effective. So, download this PPT today from Slidegeeks and see the positive impacts. Our easy-to-edit Predictive Data Model Applications Of Predictive Analytics Fraud Detection Microsoft PDF can be your go-to option for all upcoming conferences and meetings. So, what are you waiting for Grab this template today.

Information Studies Timeline For Data Science Implementation In The Organization Infographics PDF
This slide represents the timeline for the data science projects and a list of tasks performed each month, from training to work on projects. Presenting Information Studies Timeline For Data Science Implementation In The Organization Infographics PDF to provide visual cues and insights. Share and navigate important information on six stages that need your due attention. This template can be used to pitch topics like Different Resources, Exploratory Analysis, Final Analysis. In addtion, this PPT design contains high resolution images, graphics, etc, that are easily editable and available for immediate download.
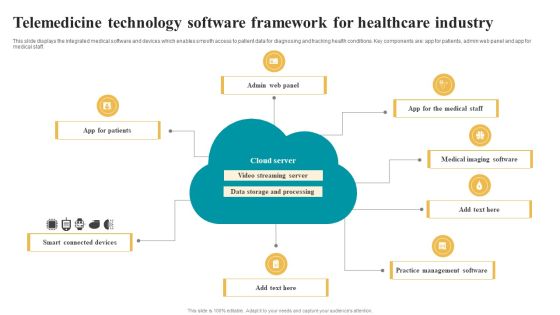
Telemedicine Technology Software Framework For Healthcare Industry Slides PDF
This slide displays the integrated medical software and devices which enables smooth access to patient data for diagnosing and tracking health conditions. Key components are app for patients, admin web panel and app for medical staff.Showcasing this set of slides titled Telemedicine Technology Software Framework For Healthcare Industry Slides PDF. The topics addressed in these templates are Storage Processing, Streaming Server, Imaging Software. All the content presented in this PPT design is completely editable. Download it and make adjustments in color, background, font etc. as per your unique business setting.
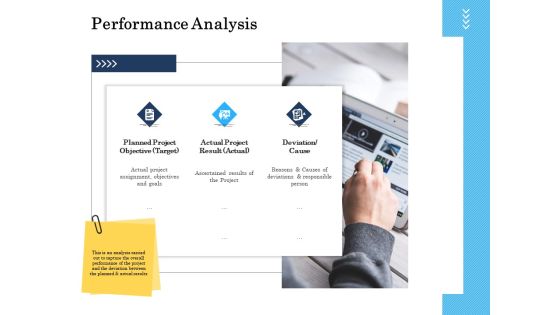
Project Deliverables Administration Outline Performance Analysis Ppt Infographics Demonstration PDF
This is a project deliverables administration outline performance analysis ppt infographics demonstration pdf template with various stages. Focus and dispense information on three stages using this creative set, that comes with editable features. It contains large content boxes to add your information on topics like planned project objective, target, actual project result, deviation, cause, goals, analysis. You can also showcase facts, figures, and other relevant content using this PPT layout. Grab it now.

Data Structure IT Introduction To Hierarchical Data Structuring Technique Summary PDF
Make sure to capture your audiences attention in your business displays with our gratis customizable Data Structure IT Introduction To Hierarchical Data Structuring Technique Summary PDF. These are great for business strategies, office conferences, capital raising or task suggestions. If you desire to acquire more customers for your tech business and ensure they stay satisfied, create your own sales presentation with these plain slides.
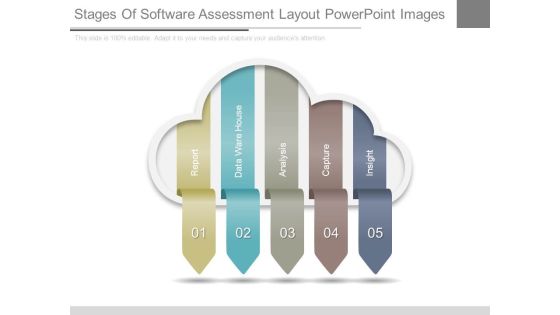
Stages Of Software Assessment Layout Powerpoint Images
This is a stages of software assessment layout powerpoint images. This is a five stage process. The stages in this process are report, data ware house, analysis, capture, insight.

Key Performance Indicators For Learning And Development Measurement Themes PDF
This slide represents KPIs that helps to measure and monitor employee performance in company. It includes four indicators training efficiency, completion rate, employee retention, ROI and scalability. Persuade your audience using this Key Performance Indicators For Learning And Development Measurement Themes PDF. This PPT design covers Four stages, thus making it a great tool to use. It also caters to a variety of topics including Training Efficiency And Impact, Completion Rate Employee Retention. Download this PPT design now to present a convincing pitch that not only emphasizes the topic but also showcases your presentation skills.
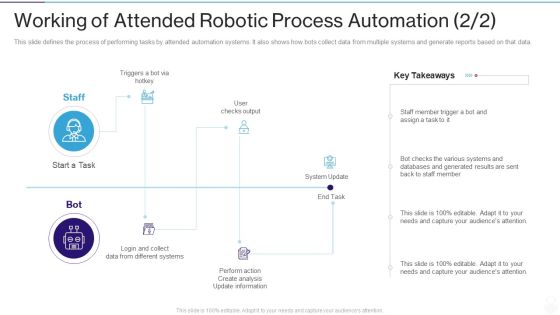
RPA IT Working Of Attended Robotic Process Automation Perform Ppt Infographic Template Grid PDF
This slide defines the process of performing tasks by attended automation systems. It also shows how bots collect data from multiple systems and generate reports based on that data. This is a rpa it working of attended robotic process automation perform ppt infographic template grid pdf template with various stages. Focus and dispense information on two stages using this creative set, that comes with editable features. It contains large content boxes to add your information on topics like staff, bot. You can also showcase facts, figures, and other relevant content using this PPT layout. Grab it now.

Data Analysis Plan Business Circles Ppt PowerPoint Presentation Complete Deck
Share a great deal of information on the topic by deploying this data analysis plan business circles ppt powerpoint presentation complete deck. Support your ideas and thought process with this prefabricated set. It includes a set of twelve slides, all fully modifiable and editable. Each slide can be restructured and induced with the information and content of your choice. You can add or remove large content boxes as well, to make this PPT slideshow more personalized. Its high-quality graphics and visuals help in presenting a well-coordinated pitch. This PPT template is also a resourceful tool to take visual cues from and implement the best ideas to help your business grow and expand. The main attraction of this well-formulated deck is that everything is editable, giving you the freedom to adjust it to your liking and choice. Changes can be made in the background and theme as well to deliver an outstanding pitch. Therefore, click on the download button now to gain full access to this multifunctional set.

Traditional Financial Budgeting And Assessment Kpis For Businesses Infographics PDF
This slide represents the key performance indicators set by the financial planning and analysis team for their business. The indicators includes working capital, operating cash flow, return on equity, current ratio, accounts receivable and payable turnover. Presenting Traditional Financial Budgeting And Assessment Kpis For Businesses Infographics PDF to dispense important information. This template comprises six stages. It also presents valuable insights into the topics including Working Capital, Operating Cash Flow, Current Ratio. This is a completely customizable PowerPoint theme that can be put to use immediately. So, download it and address the topic impactfully.

Comprehensive Analysis Of Different Data Lineage Classification Data Lineage Use Cases Improving Data Mockup PDF
This slide represents how data lineage improves data quality by identifying data quality issues and detecting the root cause of mistakes. Businesses can identify the mistakes and correct them timely by using data lineage. This Comprehensive Analysis Of Different Data Lineage Classification Data Lineage Use Cases Improving Data Mockup PDF is perfect for any presentation, be it in front of clients or colleagues. It is a versatile and stylish solution for organizing your meetings. The Comprehensive Analysis Of Different Data Lineage Classification Data Lineage Use Cases Improving Data Mockup PDF features a modern design for your presentation meetings. The adjustable and customizable slides provide unlimited possibilities for acing up your presentation. Slidegeeks has done all the homework before launching the product for you. So, do not wait, grab the presentation templates today
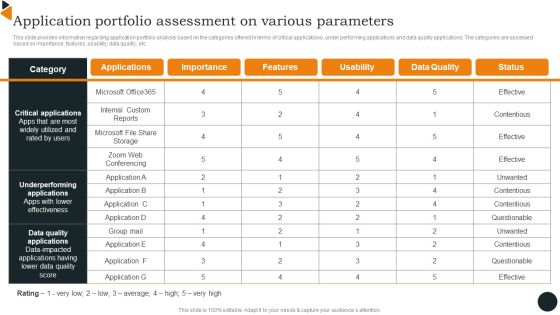
Chief Information Officers Guide On Technology Plan Application Portfolio Assessment Download PDF
This slide provides information regarding application portfolio analysis based on the categories offered in terms of critical applications, under performing applications and data quality applications. The categories are assessed based on importance, features, usability, data quality, etc. If you are looking for a format to display your unique thoughts, then the professionally designed Chief Information Officers Guide On Technology Plan Application Portfolio Assessment Download PDF is the one for you. You can use it as a Google Slides template or a PowerPoint template. Incorporate impressive visuals, symbols, images, and other charts. Modify or reorganize the text boxes as you desire. Experiment with shade schemes and font pairings. Alter, share or cooperate with other people on your work. Download Chief Information Officers Guide On Technology Plan Application Portfolio Assessment Download PDF and find out how to give a successful presentation. Present a perfect display to your team and make your presentation unforgettable.

Implementation Of Data Governance Framework Real Time Data Integration Mockup PDF
Here in this architecture data needs to be collected from numerous log files, processed and stored in an easy to query format so that business users can easily query this data for insights.Deliver an awe inspiring pitch with this creative Implementation Of Data Governance Framework Real Time Data Integration Mockup PDF bundle. Topics like Data Extractor, Data Aggregation, Injector Agents can be discussed with this completely editable template. It is available for immediate download depending on the needs and requirements of the user.

Key Performance Indicators Pie Chart Powerpoint Slide Ideas
This is a key performance indicators pie chart powerpoint slide ideas. This is a four stage process. The stages in this process are focus, objectives, measures, targets, invites, vision and strategy, area of focus.

Developing A Long Term Cyber Risk Prevention Strategy Structure PDF
The slide showcases a multistage strategy that promotes cyber resilience long-term adaptability and response . It covers stages like baseline assessment, objectives, plan, execute, report and manage. Persuade your audience using this Developing A Long Term Cyber Risk Prevention Strategy Structure PDF. This PPT design covers six stages, thus making it a great tool to use. It also caters to a variety of topics including Baseline Assessment, Objectives, Plan. Download this PPT design now to present a convincing pitch that not only emphasizes the topic but also showcases your presentation skills.

Predictive Data Model Uses And Benefits Of Predictive Analytics In Manufacturing Introduction PDF
This slide talks about using predictive analytics in manufacturing forecasting for optimal use of resources. The use cases include predictive maintenance analytics, quality, predictive demand, and workforce analytics. If your project calls for a presentation, then Slidegeeks is your go-to partner because we have professionally designed, easy-to-edit templates that are perfect for any presentation. After downloading, you can easily edit Predictive Data Model Uses And Benefits Of Predictive Analytics In Manufacturing Introduction PDF and make the changes accordingly. You can rearrange slides or fill them with different images. Check out all the handy templates
Stakeholder Administration To Improve Investors Value And Develop Business Performance Post It Notes Infographics PDF
Deliver an awe inspiring pitch with this creative stakeholder administration to improve investors value and develop business performance post it notes infographics pdf bundle. Topics like post it notes can be discussed with this completely editable template. It is available for immediate download depending on the needs and requirements of the user.
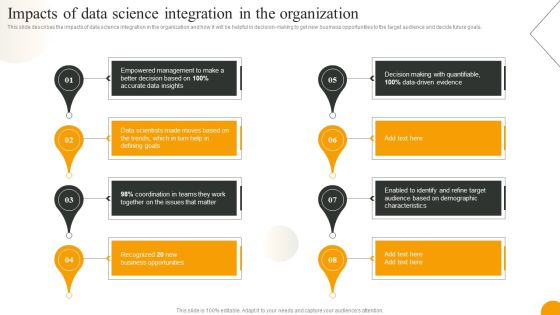
Using Data Science Technologies For Business Transformation Impacts Of Data Science Integration In The Organization Clipart PDF
This slide describes the impacts of data science integration in the organization and how it will be helpful in decision-making to get new business opportunities to the target audience and decide future goals. Whether you have daily or monthly meetings, a brilliant presentation is necessary. Using Data Science Technologies For Business Transformation Impacts Of Data Science Integration In The Organization Clipart PDF can be your best option for delivering a presentation. Represent everything in detail using Using Data Science Technologies For Business Transformation Impacts Of Data Science Integration In The Organization Clipart PDF and make yourself stand out in meetings. The template is versatile and follows a structure that will cater to your requirements. All the templates prepared by Slidegeeks are easy to download and edit. Our research experts have taken care of the corporate themes as well. So, give it a try and see the results.
How To Draw Business Process Diagram Circles PowerPoint Templates Backgrounds For Slides
We present our how to draw business process diagram circles PowerPoint templates backgrounds for slides.Present our Circle Charts PowerPoint Templates because You are an avid believer in ethical practices. Highlight the benefits that accrue with our PowerPoint Templates and Slides. Download and present our Ring Charts PowerPoint Templates because Our PowerPoint Templates and Slides will generate and maintain the level of interest you desire. They will create the impression you want to imprint on your audience. Present our Marketing PowerPoint Templates because It is Aesthetically crafted by artistic young minds. Our PowerPoint Templates and Slides are designed to display your dexterity. Use our Business PowerPoint Templates because Our PowerPoint Templates and Slides are aesthetically designed to attract attention. We gaurantee that they will grab all the eyeballs you need. Download and present our Flow Charts PowerPoint Templates because Our PowerPoint Templates and Slides will let you Illuminate the road ahead to Pinpoint the important landmarks along the way.Use these PowerPoint slides for presentations relating to Boxes, business, button, catalog, chart, circle, company, cross, data, design, diagram, direction, document, financial, four, glossy, goals, graph, junction, management, market, marketing, model, multicolored, multiple, navigation, network, options, plan, presentation, process, purple, results, shiny, sphere, statistics. The prominent colors used in the PowerPoint template are Yellow, Gray, White. Professionals tell us our how to draw business process diagram circles PowerPoint templates backgrounds for slides are specially created by a professional team with vast experience. They diligently strive to come up with the right vehicle for your brilliant Ideas. Presenters tell us our data PowerPoint templates and PPT Slides are specially created by a professional team with vast experience. They diligently strive to come up with the right vehicle for your brilliant Ideas. The feedback we get is that our how to draw business process diagram circles PowerPoint templates backgrounds for slides provide you with a vast range of viable options. Select the appropriate ones and just fill in your text. Use our cross PowerPoint templates and PPT Slides are the best it can get when it comes to presenting. You can be sure our how to draw business process diagram circles PowerPoint templates backgrounds for slides will generate and maintain the level of interest you desire. They will create the impression you want to imprint on your audience. Customers tell us our data PowerPoint templates and PPT Slides are second to none.

Guide For Marketing Analytics To Improve Decisions Perform Marketing Performance Competitive Analysis Sample PDF
The following slide covers comparison of company performance with key industry leaders to gain key insights and required data. It includes elements such as market share, product price, target audience, customer satisfaction, weaknesses, marketing strategy etc. Make sure to capture your audiences attention in your business displays with our gratis customizable Guide For Marketing Analytics To Improve Decisions Perform Marketing Performance Competitive Analysis Sample PDF. These are great for business strategies, office conferences, capital raising or task suggestions. If you desire to acquire more customers for your tech business and ensure they stay satisfied, create your own sales presentation with these plain slides.
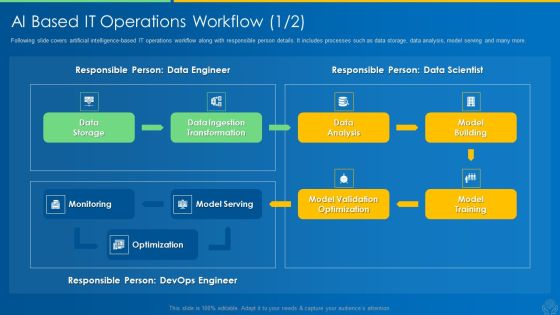
AI And ML Driving Monetary Value For Organization AI Based IT Operations Workflow Data Topics PDF
Following slide covers artificial intelligence-based IT operations workflow along with responsible person details. It includes processes such as data storage, data analysis, model serving and many more. Deliver an awe inspiring pitch with this creative ai and ml driving monetary value for organization ai based it operations workflow data topics pdf bundle. Topics like data storage, data ingestion transformation, data analysis, model building, model training can be discussed with this completely editable template. It is available for immediate download depending on the needs and requirements of the user.

Concept Of Ontology In The Semantic Web Introduction To Semantic Web Technology Summary PDF
This slide represents the introduction to semantic web technology that makes internet data machine readable. It is the concept of the World Wide Web Consortium W3c, and it can be used to develop web-based data stores, define vocabulary, and design data-handling rules. Make sure to capture your audiences attention in your business displays with our gratis customizable Concept Of Ontology In The Semantic Web Introduction To Semantic Web Technology Summary PDF. These are great for business strategies, office conferences, capital raising or task suggestions. If you desire to acquire more customers for your tech business and ensure they stay satisfied, create your own sales presentation with these plain slides.

Strategical And Tactical Planning Developing Appropriate Key Performance Indicators Brochure PDF
This template covers appropriate key performance areas and KPIs for strategic execution. Performance areas that need to be monitored are financial point of view, customers and market, internal business processes, sustainable learning and growth etc. Deliver an awe inspiring pitch with this creative Strategical And Tactical Planning Developing Appropriate Key Performance Indicators Brochure PDF bundle. Topics like Performance Areas, Key Performance Indicators, Financial can be discussed with this completely editable template. It is available for immediate download depending on the needs and requirements of the user.

Data Assimilation Data Integration Processes Master Ppt Styles Picture PDF
Deliver an awe inspiring pitch with this creative data assimilation data integration processes master ppt styles picture pdf bundle. Topics like information sources, protocols, data integration process, data resources can be discussed with this completely editable template. It is available for immediate download depending on the needs and requirements of the user.

Procedure Of Evaluating Data For Business Decision Professional PDF
This slide showcases the types of data analysis process to identify the data patterns and business decisions . It includes key types such as descriptive analysis, exploratory analysis, diagnostic analysis, predictive analysis, prescriptive analysis and statistical analysis. Presenting Procedure Of Evaluating Data For Business Decision Professional PDF to dispense important information. This template comprises six stages. It also presents valuable insights into the topics including Diagnostic Analysis, Predictive Analysis, Prescriptive Analysis. This is a completely customizable PowerPoint theme that can be put to use immediately. So, download it and address the topic impactfully.
 Home
Home