Program Framework

Cloud Data Transformation Dashboard Indicating Project And Provision Status Formats PDF
This slide showcase data migration best practices dashboard indicating overall project and provision status. It contains information about contains user, group and resource provision status. Showcasing this set of slides titled Cloud Data Transformation Dashboard Indicating Project And Provision Status Formats PDF. The topics addressed in these templates are Data Migration Status, Overall Project Status, Group Provision Status. All the content presented in this PPT design is completely editable. Download it and make adjustments in color, background, font etc. as per your unique business setting.

Key Statistics To Evaluate Work Force Mishap Brochure PDF
This slide signifies the key statistics to measure organisation workforce accident and promote health and occupational safety. It includes threads like roadways incident, homicides, electrocution and various factors due to which thread increases Showcasing this set of slides titled Key Statistics To Evaluate Work Force Mishap Brochure PDF. The topics addressed in these templates are Fires Explosions, Electrocution, Work Force Mishap. All the content presented in this PPT design is completely editable. Download it and make adjustments in color, background, font etc. as per your unique business setting.
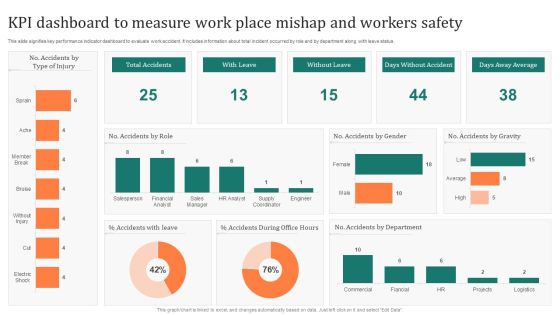
KPI Dashboard To Measure Work Place Mishap And Workers Safety Inspiration PDF
This slide signifies key performance indicator dashboard to evaluate work accident. It includes information about total incident occurred by role and by department along with leave status. Pitch your topic with ease and precision using this KPI Dashboard To Measure Work Place Mishap And Workers Safety Inspiration PDF. This layout presents information on Accidents Role, Accidents Leave, Accidents Department. It is also available for immediate download and adjustment. So, changes can be made in the color, design, graphics or any other component to create a unique layout.
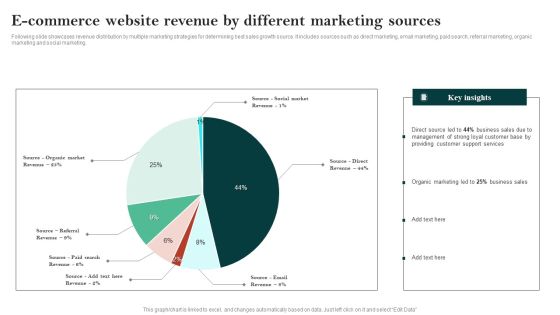
E Commerce Website Revenue By Different Marketing Sources Ppt Ideas PDF
Following slide showcases revenue distribution by multiple marketing strategies for determining best sales growth source. It includes sources such as direct marketing, email marketing, paid search, referral marketing, organic marketing and social marketing. Pitch your topic with ease and precision using this E Commerce Website Pre Launch Checklist Ppt Summary Backgrounds PDF. This layout presents information on Direct Source Led, Business Sales, Customer Base. It is also available for immediate download and adjustment. So, changes can be made in the color, design, graphics or any other component to create a unique layout.
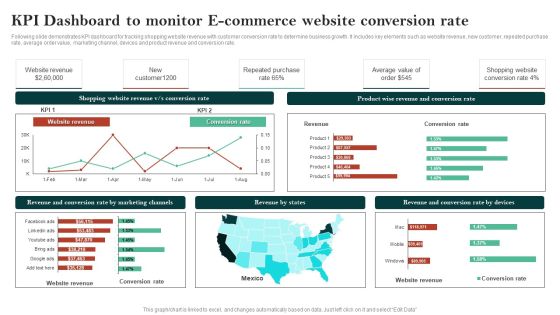
Kpi Dashboard To Monitor E Commerce Website Conversion Rate Clipart PDF
Following slide demonstrates KPI dashboard for tracking shopping website revenue with customer conversion rate to determine business growth. It includes key elements such as website revenue, new customer, repeated purchase rate, average order value, marketing channel, devices and product revenue and conversion rate. Showcasing this set of slides titled Kpi Dashboard To Monitor E Commerce Website Conversion Rate Clipart PDF. The topics addressed in these templates are Shopping Website Revenue, Conversion Rate, Website Revenue. All the content presented in this PPT design is completely editable. Download it and make adjustments in color, background, font etc. as per your unique business setting.

KPI Dashboard To Monitor Public Promotion Marketing Practices Template PDF
Mentioned slide demonstrates dashboard for tracking monthly public relations marketing practices to determine marketing department performance. It includes key components such as month press release for product, blogs and articles posts, social media channel uploads, etc. Pitch your topic with ease and precision using this KPI Dashboard To Monitor Public Promotion Marketing Practices Template PDF. This layout presents information on Paid Media, Owned Media, Total News Release, Comparison Graph. It is also available for immediate download and adjustment. So, changes can be made in the color, design, graphics or any other component to create a unique layout.

Public Promotion Marketing Challenges With Effective Solutions Summary PDF
Following slide showcases various public relations marketing challenges faced by organisation with respective solutions to increase business market share. It includes challenges such as gain customer attention, lack of resources, amplify brand awareness, expensive media, etc. Showcasing this set of slides titled Public Promotion Marketing Challenges With Effective Solutions Summary PDF. The topics addressed in these templates are Survey Question, Top Challenges Faced, Businesses, PR Marketing. All the content presented in this PPT design is completely editable. Download it and make adjustments in color, background, font etc. as per your unique business setting.

Project Progress Status KPI Dashboard Ppt PowerPoint Presentation File Themes PDF
The given slide showcases the project status to communicate and monitor risk. It includes elements such as activity status, budget allocation, risk status and degree. Showcasing this set of slides titled Project Progress Status KPI Dashboard Ppt PowerPoint Presentation File Themes PDF. The topics addressed in these templates are Activity Status, Budget Allocation, Open Risk, Open Issues. All the content presented in this PPT design is completely editable. Download it and make adjustments in color, background, font etc. as per your unique business setting.

Dashboard For Strategic Evaluation Of Key Business Financials Ppt Gallery Aids PDF
This slide displays dashboard to review business performance and formulate appropriate improvement strategies. It further includes kpis such as revenue comparison, top selling categories, sales by month, customer satisfaction, etc. Showcasing this set of slides titled Dashboard For Strategic Evaluation Of Key Business Financials Ppt Gallery Aids PDF. The topics addressed in these templates are Revenue Comparison, Top Selling Categories, New Customer. All the content presented in this PPT design is completely editable. Download it and make adjustments in color, background, font etc. as per your unique business setting.

Dashboard For Strategic Organization Evaluation Of Employee Performance Ppt Icon Mockup PDF
This slide displays dashboard to strategically review and analyze employee performance in the organization to determine overall efficiency of business operations. It includes KPIs such as absenteeism, overtime hours, training costs and overall labor efficiency. Pitch your topic with ease and precision using this Dashboard For Strategic Organization Evaluation Of Employee Performance Ppt Icon Mockup PDF. This layout presents information on Training Costs, Overall Labor Effectiveness, Absenteeism, Overtime Hours. It is also available for immediate download and adjustment. So, changes can be made in the color, design, graphics or any other component to create a unique layout.

Organization Performance Strategic Evaluation Dashboard Ppt Slides Visual Aids PDF
This slide showcases dashboard to review business activities strategically for continual growth in company revenue and profits. It further includes KPIs such as sales, new consumers, actual and targets met, etc. Showcasing this set of slides titled Organization Performance Strategic Evaluation Dashboard Ppt Slides Visual Aids PDF. The topics addressed in these templates are Average Revenue Per Unit, Customer Lifetime Value, Customer Acquisition Cost. All the content presented in this PPT design is completely editable. Download it and make adjustments in color, background, font etc. as per your unique business setting.

KPI Dashboard Of Managing Innovative Business Project Ppt Pictures Show PDF
This slide shows the KPI dashboard of innovation project management. It covers the following KPIs such as innovation success rate, value in project, total revenue, active projects, etc. Pitch your topic with ease and precision using this KPI Dashboard Of Managing Innovative Business Project Ppt Pictures Show PDF. This layout presents information on Innovation Success Rate, Total Active Projects, Amount Mission. It is also available for immediate download and adjustment. So, changes can be made in the color, design, graphics or any other component to create a unique layout.
Marketing Qualified Leads MQL Generation Report Summary Ppt Icon Pictures PDF
This slide represents dashboard showing the report of generated marketing qualified leads. It shows details related to MQLs by month, status, reasons for MQLs and recycle etc. Showcasing this set of slides titled Marketing Qualified Leads MQL Generation Report Summary Ppt Icon Pictures PDF. The topics addressed in these templates are MQLs By Status, MQLs By Month, MQLs Converted. All the content presented in this PPT design is completely editable. Download it and make adjustments in color, background, font etc. as per your unique business setting.
Projected Real Estate Investing Revenue Growth Assessment Ppt File Icon PDF
This slide shows the potential revenue growth for real estate business investment in the upcoming years to assess and monitor income and expenses, and keep a check on owner equity. It includes projected revenue, income per unit total revenue and key takeaways. Showcasing this set of slides titled Projected Real Estate Investing Revenue Growth Assessment Ppt File Icon PDF. The topics addressed in these templates are Revenue Aspects, Key Takeaways, Maximum Revenue Projected. All the content presented in this PPT design is completely editable. Download it and make adjustments in color, background, font etc. as per your unique business setting.

Developing Content Marketing Dashboard To Measure Content Effectiveness Brochure PDF
This slide shows the dashboard to measure content effectiveness which includes blog subscribers, opportunities to enhance rankings, click-through rate, pageviews, ad impressions, etc. Get a simple yet stunning designed Developing Content Marketing Dashboard To Measure Content Effectiveness Brochure PDF. It is the best one to establish the tone in your meetings. It is an excellent way to make your presentations highly effective. So, download this PPT today from Slidegeeks and see the positive impacts. Our easy-to-edit Developing Content Marketing Dashboard To Measure Content Effectiveness Brochure PDF can be your go-to option for all upcoming conferences and meetings. So, what are you waiting for Grab this template today.

Business Drivers For Better Organizational Result Ppt Summary Templates PDF
The slide highlights key drivers to influence a businesss financial and operational outcomes. It included business drivers such as increase in business stores, rise in volume of products sold, etc to achieve outcomes such as business growth, rise in no. of orders, etc. Showcasing this set of slides titled Business Drivers For Better Organizational Result Ppt Summary Templates PDF. The topics addressed in these templates are Website Traffic, Page Views, Conversion Rate, New Customers. All the content presented in this PPT design is completely editable. Download it and make adjustments in color, background, font etc. as per your unique business setting.

Client Consultancy Services Business Performance Dashboard Ppt File Layout PDF
This slide shows dashboard to determine overall performance and customer satisfaction of consultancy business. It includes various elements such as total revenue, percentage of support cost, cost per support, average time to solve problem etc. Showcasing this set of slides titled Client Consultancy Services Business Performance Dashboard Ppt File Layout PDF. The topics addressed in these templates are Revenue And Percentage, Support Cost, Cost Per Support. All the content presented in this PPT design is completely editable. Download it and make adjustments in color, background, font etc. as per your unique business setting.
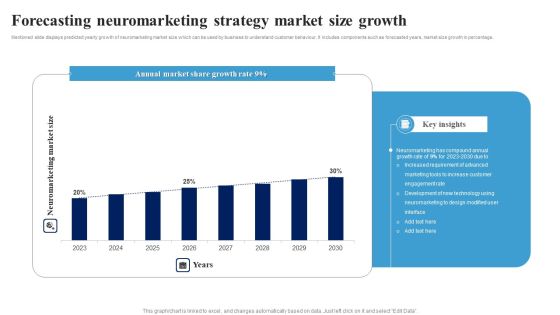
Forecasting Neuromarketing Strategy Market Size Growth Ppt Ideas Slideshow PDF
Mentioned slide displays predicted yearly growth of neuromarketing market size which can be used by business to understand customer behaviour. It includes components such as forecasted years, market size growth in percentage. Showcasing this set of slides titled Forecasting Neuromarketing Strategy Market Size Growth Ppt Ideas Slideshow PDF. The topics addressed in these templates are Annual Market Share, Growth Rate, Neuromarketing Compound, Annual Growth Rate. All the content presented in this PPT design is completely editable. Download it and make adjustments in color, background, font etc. as per your unique business setting.
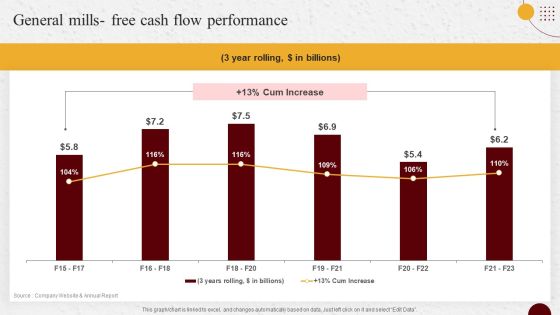
Industry Report Of Packaged Food Products Part 2 General Mills Free Cash Flow Performance Sample PDF
Get a simple yet stunning designed Industry Report Of Packaged Food Products Part 2 General Mills Free Cash Flow Performance Sample PDF. It is the best one to establish the tone in your meetings. It is an excellent way to make your presentations highly effective. So, download this PPT today from Slidegeeks and see the positive impacts. Our easy to edit Industry Report Of Packaged Food Products Part 2 General Mills Free Cash Flow Performance Sample PDF can be your go to option for all upcoming conferences and meetings. So, what are you waiting for Grab this template today.

Dashboard To Track Of Property Investing Management Activities Sample PDF
The following slide showcases real estate investing dashboard which helps to allocate cash. It presents information related to property revenue, paid invoices, expiring leases, etc. Pitch your topic with ease and precision using this Dashboard To Track Of Property Investing Management Activities Sample PDF. This layout presents information on Dashboard To Track, Property Investing, Management Activities. It is also available for immediate download and adjustment. So, changes can be made in the color, design, graphics or any other component to create a unique layout.
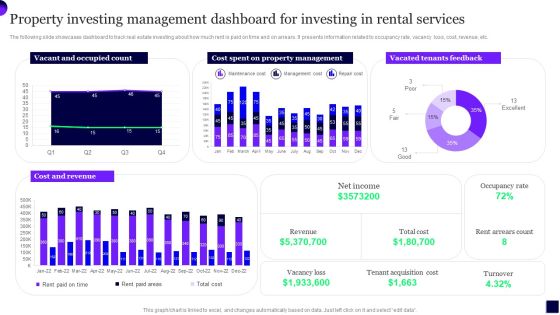
Property Investing Management Dashboard For Investing In Rental Services Template PDF
The following slide showcases dashboard to track real estate investing about how much rent is paid on time and on arrears. It presents information related to occupancy rate, vacancy loss, cost, revenue, etc. Showcasing this set of slides titled Property Investing Management Dashboard For Investing In Rental Services Template PDF. The topics addressed in these templates are Cost, Property Management, Revenue. All the content presented in this PPT design is completely editable. Download it and make adjustments in color, background, font etc. as per your unique business setting.

KPI Dashboard To Measure Performance Of Client Acquisition Strategy Slides PDF
This slide represents the key Performance Indicator dashboard to track marketing strategies that are implemented to increase engagement rate. It includes total visits, cost per click, engagement rate and impressions total. Showcasing this set of slides titled KPI Dashboard To Measure Performance Of Client Acquisition Strategy Slides PDF. The topics addressed in these templates are Visits Total, Cost Per Click, Engagement Rate, Impressions Total. All the content presented in this PPT design is completely editable. Download it and make adjustments in color, background, font etc. as per your unique business setting.

KPI Dashboard To Measure Sales Divisional Strategy Performance Microsoft PDF
This slide signifies the key performance indicator dashboard to evaluate sales department strategy. It covers information regarding to the leads generated, conversion rate, top product in revenue. Pitch your topic with ease and precision using this KPI Dashboard To Measure Sales Divisional Strategy Performance Microsoft PDF. This layout presents information on Sales Rations, Lead Generation, Customer Conversion. It is also available for immediate download and adjustment. So, changes can be made in the color, design, graphics or any other component to create a unique layout.

Annual Customer Online Browsing Trends Ideas PDF
The following slide shows bar graph depicting the online browsing trends for the past year. It is categorized on the basis of different consumer generations such as gen. Z, millennial, gen. X ,boomer etc. Showcasing this set of slides titled Annual Customer Online Browsing Trends Ideas PDF. The topics addressed in these templates are Online Browsing, Millennial Spent, Possible Reasons. All the content presented in this PPT design is completely editable. Download it and make adjustments in color, background, font etc. as per your unique business setting.
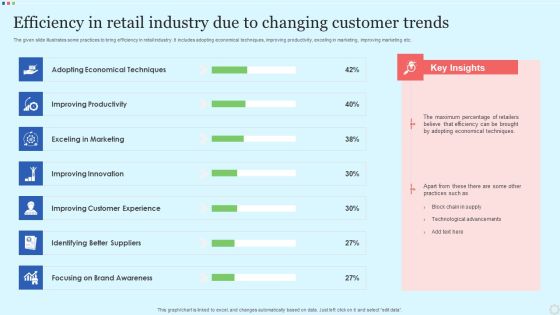
Efficiency In Retail Industry Due To Changing Customer Trends Microsoft PDF
The given slide illustrates some practices to bring efficiency in retail industry. It includes adopting economical techniques, improving productivity, exceling in marketing, improving marketing etc. Pitch your topic with ease and precision using this Efficiency In Retail Industry Due To Changing Customer Trends Microsoft PDF. This layout presents information on Adopting Techniques, Improving Productivity, Exceling Marketing. It is also available for immediate download and adjustment. So, changes can be made in the color, design, graphics or any other component to create a unique layout.
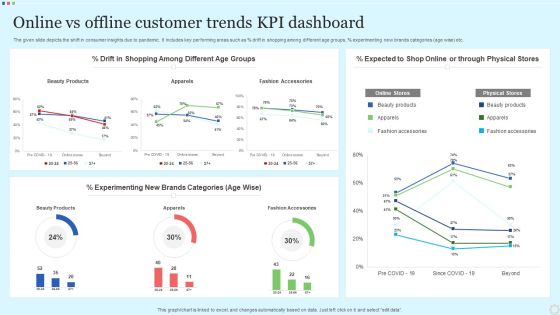
Online Vs Offline Customer Trends Kpi Dashboard Rules PDF
The given slide depicts the shift in consumer insights due to pandemic. It includes key performing areas such as percent drift in shopping among different age groups, percent experimenting new brands categories age wise etc. Showcasing this set of slides titled Online Vs Offline Customer Trends Kpi Dashboard Rules PDF. The topics addressed in these templates are Beauty Products, Apparels, Fashion Accessories. All the content presented in this PPT design is completely editable. Download it and make adjustments in color, background, font etc. as per your unique business setting.
Lead Tracking Dashboard With Metric Comparison Brochure PDF
This slide showcases dashboard of lead pipeline that can help to identify total number of leads generated and expenses incurred to acquire the audience. It also showcases other key performance metrics like lead breakdown by status and number of leads per month. Pitch your topic with ease and precision using this Lead Tracking Dashboard With Metric Comparison Brochure PDF. This layout presents information on Metric Comparison, Lead Pipeline, Lead Breakdown Status. It is also available for immediate download and adjustment. So, changes can be made in the color, design, graphics or any other component to create a unique layout.
Lead Tracking Metrics Dashboard With User Responses Diagrams PDF
This slide showcases dashboard for lead conversion metrics that can help organization to filter out total leads interested from the leads who have responded to the phone calls by organization. It also showcases key metrics such as leads busiest hours, leads busiest days, phone number types and lead types. Showcasing this set of slides titled Lead Tracking Metrics Dashboard With User Responses Diagrams PDF. The topics addressed in these templates are Busiest Hours Leads, Conversion Metrics, Lead Types. All the content presented in this PPT design is completely editable. Download it and make adjustments in color, background, font etc. as per your unique business setting.
Leads Tracking Dashboard With Conversion Funnel Ideas PDF
This slide showcases dashboard that can help organization to identify the total number of customers acquired from the sales and marketing qualified lead. It also showcases financial KPIs that are cost per lead, cost per customer, customer lifetine value and return on marketing investment. Pitch your topic with ease and precision using this Leads Tracking Dashboard With Conversion Funnel Ideas PDF. This layout presents information on Audience, Prospects, Conversion Funnel. It is also available for immediate download and adjustment. So, changes can be made in the color, design, graphics or any other component to create a unique layout.
Monthly Comparison Dashboard For Lead Tracking Sample PDF
This slide showcases dashboard that can help organization to compare the leads converted in different months and make changes in sales and marketing campaigns . Its key components lead generated by country, by industry type and lead sources by month. Showcasing this set of slides titled Monthly Comparison Dashboard For Lead Tracking Sample PDF. The topics addressed in these templates are Leads Received, Industry Type, Lead Generated. All the content presented in this PPT design is completely editable. Download it and make adjustments in color, background, font etc. as per your unique business setting.

Sales Monitoring Dashboard With Monthly Qualified Leads Guidelines PDF
This slide showcases dashboard that can help organization to monitor the sales pipeline velocity and predict future sales more accurately plus increase the leads converted. Its key components are monthly qualified leads, win rate based on deal size, monthly sales cycle and number of leads at each stage of pipeline. Pitch your topic with ease and precision using this Sales Monitoring Dashboard With Monthly Qualified Leads Guidelines PDF. This layout presents information on Monthly Qualified, Monthly Sales Cycle, Deal Size. It is also available for immediate download and adjustment. So, changes can be made in the color, design, graphics or any other component to create a unique layout.
Sales Performance Dashboard With Average Lead Tracking Time Background PDF
This slide showcases dashboard for sales performance that can help organization to analyze the effectiveness of sales campaigns and average response time of lead. Its key components are average contract value, average sales cycle length, follow up contract rate and sales activity. Showcasing this set of slides titled Sales Performance Dashboard With Average Lead Tracking Time Background PDF. The topics addressed in these templates are Avg Contract Value, Sales Activity, Contract Rate. All the content presented in this PPT design is completely editable. Download it and make adjustments in color, background, font etc. as per your unique business setting.
Website Leads Tracking Dashboard With Traffic Sources Infographics PDF
This slide showcases dashboard for lead generation that can help organziation to identify the traffic sources plus visitors and make changes in SEO of website. It also showcases key metrics that are bounce rate by week, visitors by user type, top channels by conversion, top campaign by conversion and top pages by conversion. Pitch your topic with ease and precision using this Website Leads Tracking Dashboard With Traffic Sources Infographics PDF. This layout presents information on Visitors User Type, Traffic Sources, Bounce Rate Week. It is also available for immediate download and adjustment. So, changes can be made in the color, design, graphics or any other component to create a unique layout.
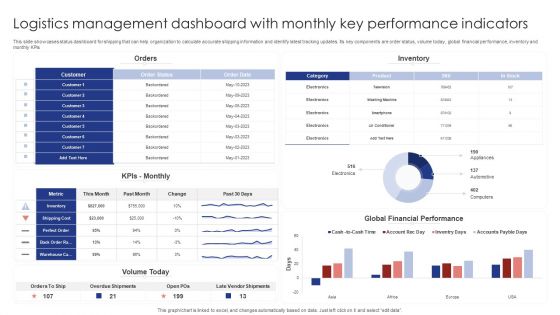
Logistics Management Dashboard With Monthly Key Performance Indicators Rules PDF
This slide showcases status dashboard for shipping that can help organization to calculate accurate shipping information and identify latest tracking updates. Its key components are order status, volume today, global financial performance, inventory and monthly KPIs. Pitch your topic with ease and precision using this Logistics Management Dashboard With Monthly Key Performance Indicators Rules PDF. This layout presents information on Orders, Inventory, Kpis Monthly. It is also available for immediate download and adjustment. So, changes can be made in the color, design, graphics or any other component to create a unique layout.
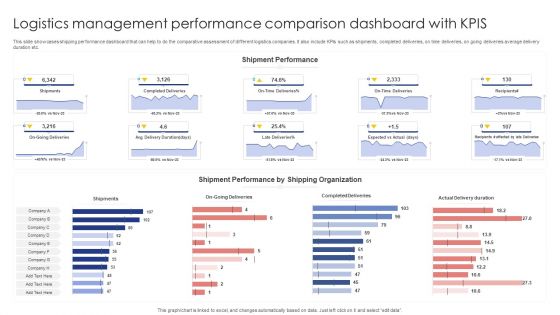
Logistics Management Performance Comparison Dashboard With Kpis Sample PDF
This slide showcases shipping performance dashboard that can help to do the comparative assessment of different logistics companies. It also include KPIs such as shipments, completed deliveries, on time deliveries, on going deliveries average delivery duration etc. Pitch your topic with ease and precision using this Logistics Management Performance Comparison Dashboard With Kpis Sample PDF. This layout presents information on Shipments, Completed Deliveries, Actual Delivery Duration. It is also available for immediate download and adjustment. So, changes can be made in the color, design, graphics or any other component to create a unique layout.
Logistics Management Time Tracking Dashboard With Warehousing Costs Template PDF
This slide showcases shipping dashboard that can help company to deliver the products in stipulated time and keep warehousing operating expenses within pre decided budget. Its also displays perfect order rate and total shipments by country. Pitch your topic with ease and precision using this Logistics Management Time Tracking Dashboard With Warehousing Costs Template PDF. This layout presents information on Warehouse Operating Costs, Perfect Order Rate, On Time Shipments. It is also available for immediate download and adjustment. So, changes can be made in the color, design, graphics or any other component to create a unique layout.
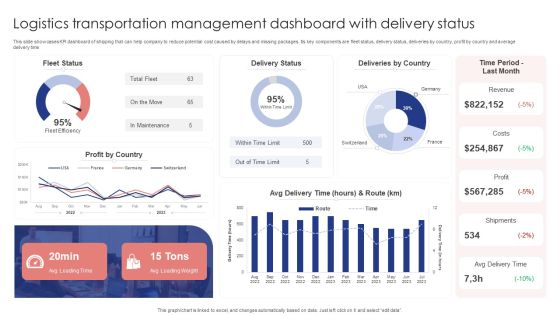
Logistics Transportation Management Dashboard With Delivery Status Portrait PDF
This slide showcases KPI dashboard of shipping that can help company to reduce potential cost caused by delays and missing packages. Its key components are fleet status, delivery status, deliveries by country, profit by country and average delivery time. Showcasing this set of slides titled Logistics Transportation Management Dashboard With Delivery Status Portrait PDF. The topics addressed in these templates are Fleet Status, Delivery Status, Deliveries By Country. All the content presented in this PPT design is completely editable. Download it and make adjustments in color, background, font etc. as per your unique business setting.

Order Logistics Management Dashboard With Revenue Generated Slides PDF
This slide showcases shipment tracking dashboard that can help company to track the status of order in real time and revenue earned in last quarter. It also includes no of orders and email feedback received. Showcasing this set of slides titled Order Logistics Management Dashboard With Revenue Generated Slides PDF. The topics addressed in these templates are Total Revenue, Emails Feedback, Orders Graph. All the content presented in this PPT design is completely editable. Download it and make adjustments in color, background, font etc. as per your unique business setting.

Share Market Dashboard Indicating Candlestick Time Series Formats PDF
Following slide showcase stock market KPI dashboard which will assist company to understand stock performance. It provides information about open, close, highest and lowest price of stock on particular day, candlestick time series etc. Pitch your topic with ease and precision using this Share Market Dashboard Indicating Candlestick Time Series Formats PDF. This layout presents information on Candlestick Time Series, Stock Change, US Sector. It is also available for immediate download and adjustment. So, changes can be made in the color, design, graphics or any other component to create a unique layout.
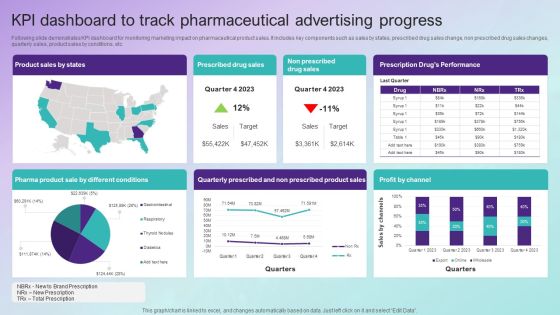
KPI Dashboard To Track Pharmaceutical Advertising Progress Topics PDF
Following slide demonstrates KPI dashboard for monitoring marketing impact on pharmaceutical product sales. It includes key components such as sales by states, prescribed drug sales change, non prescribed drug sales changes, quarterly sales, product sales by conditions, etc. Showcasing this set of slides titled KPI Dashboard To Track Pharmaceutical Advertising Progress Topics PDF. The topics addressed in these templates are Product Sales By States, Prescribed Drug Sales, Non Prescribed Drug Sales, Profit By Channel. All the content presented in this PPT design is completely editable. Download it and make adjustments in color, background, font etc. as per your unique business setting.
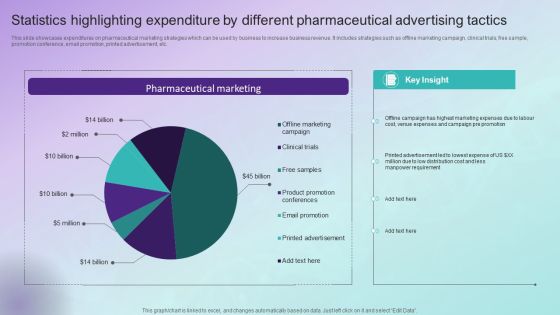
Statistics Highlighting Expenditure By Different Pharmaceutical Advertising Tactics Mockup PDF
This slide showcases expenditures on pharmaceutical marketing strategies which can be used by business to increase business revenue. It includes strategies such as offline marketing campaign, clinical trials, free sample, promotion conference, email promotion, printed advertisement, etc. Pitch your topic with ease and precision using this Statistics Highlighting Expenditure By Different Pharmaceutical Advertising Tactics Mockup PDF. This layout presents information on Offline Marketing Campaign, Clinical Trials, Free Sample, Promotion Conference, Email Promotion, Printed Advertisement. It is also available for immediate download and adjustment. So, changes can be made in the color, design, graphics or any other component to create a unique layout.
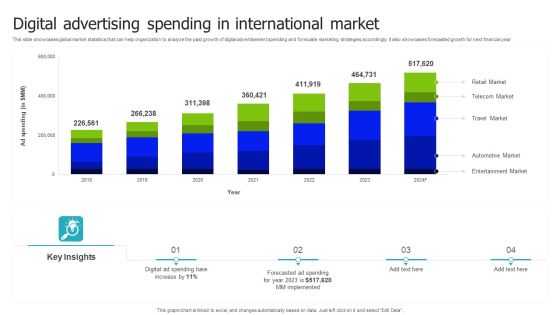
Digital Advertising Spending In International Market Demonstration PDF
This slide showcases global market statistics that can help organization to analyze the past growth of digital advertisement spending and formulate marketing strategies accordingly. It also showcases forecasted growth for next financial year. Showcasing this set of slides titled Digital Advertising Spending In International Market Demonstration PDF. The topics addressed in these templates are Retail Market, Telecom Market, Travel Market . All the content presented in this PPT design is completely editable. Download it and make adjustments in color, background, font etc. as per your unique business setting.

International Apparel Manufacturing Report With Market Growth Forecast Inspiration PDF
This slide showcases global manufacturing insights for apparel market that can help organization to identify the growth in last financial years and make investment decisions on the basis of past data. It also showcases growth forecast for a period of next 6 financial years. Pitch your topic with ease and precision using this International Apparel Manufacturing Report With Market Growth Forecast Inspiration PDF. This layout presents information on Apparel Manufacturing, Market Growth Forecast, Billion. It is also available for immediate download and adjustment. So, changes can be made in the color, design, graphics or any other component to create a unique layout.
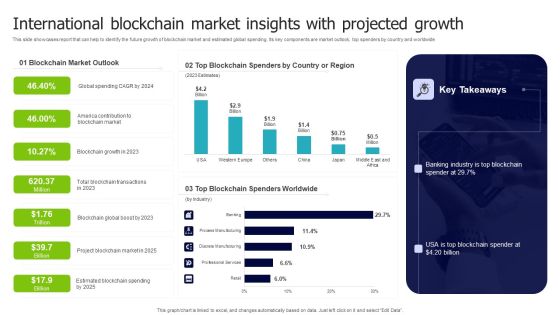
International Blockchain Market Insights With Projected Growth Microsoft PDF
This slide showcases report that can help to identify the future growth of blockchain market and estimated global spending. Its key components are market outlook, top spenders by country and worldwide. Showcasing this set of slides titled International Blockchain Market Insights With Projected Growth Microsoft PDF. The topics addressed in these templates are Blockchain Market Outlook, Blockchain Spenders, Country Region. All the content presented in this PPT design is completely editable. Download it and make adjustments in color, background, font etc. as per your unique business setting.
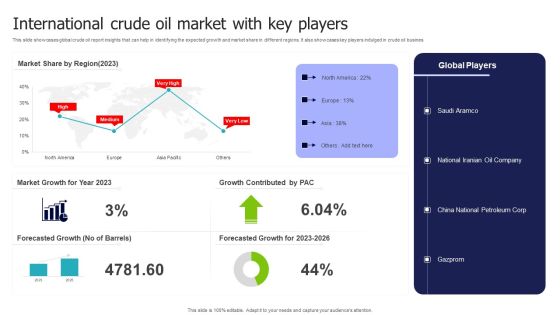
International Crude Oil Market With Key Players Demonstration PDF
This slide showcases global crude oil report insights that can help in identifying the expected growth and market share in different regions. It also showcases key players indulged in crude oil busines. Pitch your topic with ease and precision using this International Crude Oil Market With Key Players Demonstration PDF. This layout presents information on Market Share, Market Growth, Growth Contributed . It is also available for immediate download and adjustment. So, changes can be made in the color, design, graphics or any other component to create a unique layout.

International Digital Payment Market Size With Forecasted Growth Inspiration PDF
This slide showcases market size of global digital payment market that can help to identify the forecasted growth of online transactions and assess the profit potential for investment in this marketplace. It also showcases growth forecast for next financial year. Pitch your topic with ease and precision using this International Digital Payment Market Size With Forecasted Growth Inspiration PDF. This layout presents information on Global, Forecasted, Growth. It is also available for immediate download and adjustment. So, changes can be made in the color, design, graphics or any other component to create a unique layout.

International Fintech Industry With Market Size Infographics PDF
This slide showcases global report that can help organizations to estimate future growth and identify the market share of different fintech segments. It also showcases fintech startups by region, market and investment in different countries. Showcasing this set of slides titled International Fintech Industry With Market Size Infographics PDF. The topics addressed in these templates are Fintech Segments, Region, Fintech Investment. All the content presented in this PPT design is completely editable. Download it and make adjustments in color, background, font etc. as per your unique business setting.
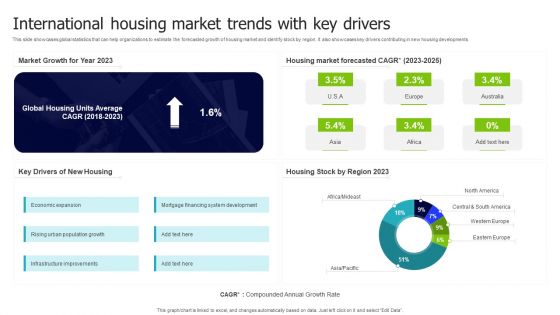
International Housing Market Trends With Key Drivers Inspiration PDF
This slide showcases global statistics that can help organizations to estimate the forecasted growth of housing market and identify stock by region. It also showcases key drivers contributing in new housing developments. Pitch your topic with ease and precision using this International Housing Market Trends With Key Drivers Inspiration PDF. This layout presents information on Key Drivers, Housing Market, Forecasted. It is also available for immediate download and adjustment. So, changes can be made in the color, design, graphics or any other component to create a unique layout.

Maintenance Metrics To Optimize Production Information PDF
The following slide highlights some maintenance KPIs for manufacturing industry to trace and reduce production downtime. It also includes top downtime reasons along with the present downtime with machine name, reason and duration. Showcasing this set of slides titled Maintenance Metrics To Optimize Production Information PDF. The topics addressed in these templates are Human Error, Misplaced Parts, Machine Breakdown. All the content presented in this PPT design is completely editable. Download it and make adjustments in color, background, font etc. as per your unique business setting.
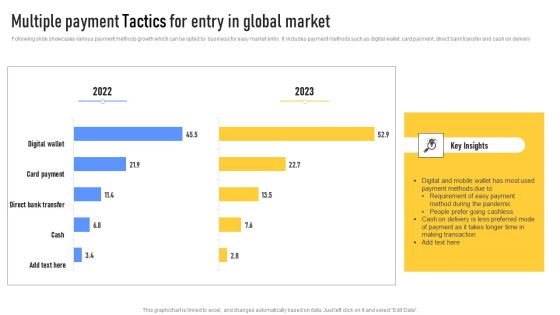
Multiple Payment Tactics For Entry In Global Market Mockup PDF
Following slide showcases various payment methods growth which can be opted by business for easy market entry. It includes payment methods such as digital wallet, card payment, direct bank transfer and cash on delivery. Showcasing this set of slides titled Multiple Payment Tactics For Entry In Global Market Mockup PDF. The topics addressed in these templates are Digital Wallet, Card Payment, Direct Bank Transfer, Cash On Delivery. All the content presented in this PPT design is completely editable. Download it and make adjustments in color, background, font etc. as per your unique business setting.
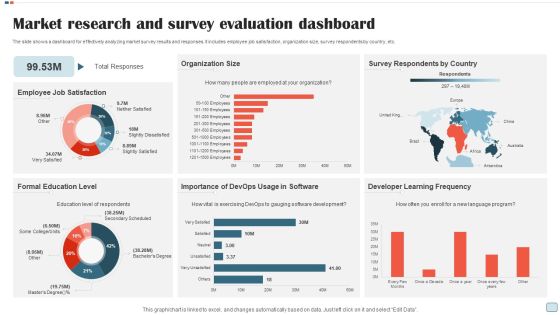
Market Research And Survey Evaluation Dashboard Rules PDF
The slide shows a dashboard for effectively analyzing market survey results and responses. It includes employee job satisfaction, organization size, survey respondents by country, etc. Pitch your topic with ease and precision using this Market Research And Survey Evaluation Dashboard Rules PDF. This layout presents information on Employee Job Satisfaction, Organization Size, Survey Respondents By Country. It is also available for immediate download and adjustment. So, changes can be made in the color, design, graphics or any other component to create a unique layout.

Customer Related Quality Kpis Dashboard For Project Management Brochure PDF
This slide displays a dashboard for measurement of parameters related to customer satisfaction. It includes details such as net promoter score, customer retention rate, customer efforts, etc. Showcasing this set of slides titled Customer Related Quality Kpis Dashboard For Project Management Brochure PDF. The topics addressed in these templates are Customer Retention Rate, Net Promoter Score, Customer Effort Score. All the content presented in this PPT design is completely editable. Download it and make adjustments in color, background, font etc. as per your unique business setting.
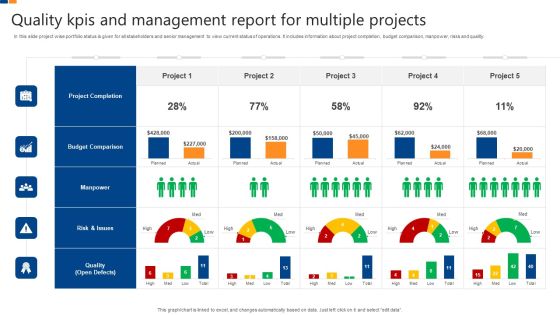
Quality Kpis And Management Report For Multiple Projects Elements PDF
In this slide project wise portfolio status is given for all stakeholders and senior management to view current status of operations. It includes information about project completion, budget comparison, manpower, risks and quality. Pitch your topic with ease and precision using this Quality Kpis And Management Report For Multiple Projects Elements PDF. This layout presents information on Project Completion, Budget Comparison, Manpower, Risks And Quality. It is also available for immediate download and adjustment. So, changes can be made in the color, design, graphics or any other component to create a unique layout.

Measuring Ab Testing Solution With Saas Company KPI Dashboard Guidelines PDF
The purpose of this slide is to showcase SaaS metrics dashboard which can assist the corporations to make changes in product to improve user experience. It covers information about weighted satisfaction score, positive satisfaction rating, etc. Pitch your topic with ease and precision using this Measuring Ab Testing Solution With Saas Company KPI Dashboard Guidelines PDF. This layout presents information on Lifetime Value Customer, Positive Satisfaction Rating, Save Widget, Weighted Satisfaction Score. It is also available for immediate download and adjustment. So, changes can be made in the color, design, graphics or any other component to create a unique layout.
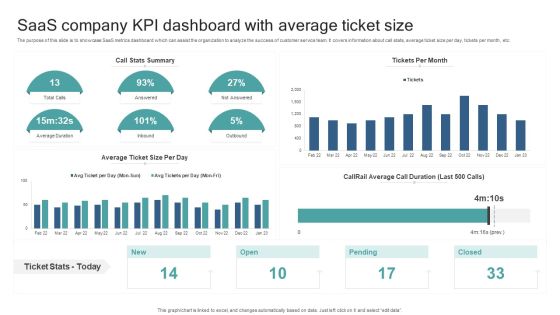
Saas Company KPI Dashboard With Average Ticket Size Sample PDF
The purpose of this slide is to showcase SaaS metrics dashboard which can assist the organization to analyze the success of customer service team. It covers information about call stats, average ticket size per day, tickets per month, etc. Showcasing this set of slides titled Saas Company KPI Dashboard With Average Ticket Size Sample PDF. The topics addressed in these templates are Saas Company Kpi, Dashboard, Average Ticket Size. All the content presented in this PPT design is completely editable. Download it and make adjustments in color, background, font etc. as per your unique business setting.

Dashboard For Assessing Project Team Productivity Report Mockup PDF
This slide depicts a dashboard for monitoring team productivity reports in project management. It covers various areas such as billing by the consumer, productivity reports, employee billable hours, etc. Pitch your topic with ease and precision using this Dashboard For Assessing Project Team Productivity Report Mockup PDF. This layout presents information on Billing Expense Customer, Employee Productivity Report, Profitability Customer. It is also available for immediate download and adjustment. So, changes can be made in the color, design, graphics or any other component to create a unique layout.

Product Overview Management System Dashboard Showing Profit And Loss Topics PDF
This slide shows the dashboard of product information management system. It highlights information related to profit and loss, net income, expenses etc. along with order status of products. Showcasing this set of slides titled Product Overview Management System Dashboard Showing Profit And Loss Themes PDF. The topics addressed in these templates are Profit Loss, Order Status, Expenses. All the content presented in this PPT design is completely editable. Download it and make adjustments in color, background, font etc. as per your unique business setting.
KPI Dashboard For Tracking Brand Communication Techniques Performance Topics PDF
The following slide illustrates dashboard which helps brand managers to improve their communication campaign performance. It presents information related to campaigns, cost per acquisitions, etc. Pitch your topic with ease and precision using this KPI Dashboard For Tracking Brand Communication Techniques Performance Topics PDF. This layout presents information on KPI Dashboard, Tracking Brand Communication, Techniques Performance. It is also available for immediate download and adjustment. So, changes can be made in the color, design, graphics or any other component to create a unique layout.
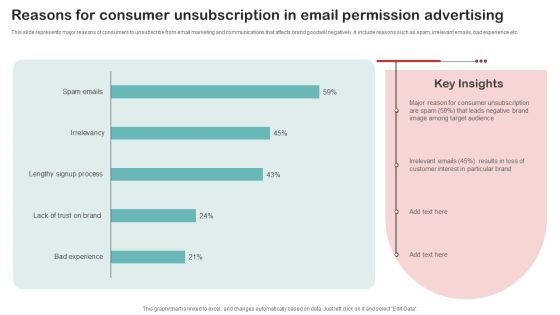
Reasons For Consumer Unsubscription In Email Permission Advertising Diagrams PDF
This slide represents major reasons of consumers to unsubscribe from email marketing and communications that affects brand goodwill negatively. It include reasons such as spam, irrelevant emails, bad experience etc. Pitch your topic with ease and precision using this Reasons For Consumer Unsubscription In Email Permission Advertising Diagrams PDF. This layout presents information on Irrelevant Emails, Customer Interest, Target Audience. It is also available for immediate download and adjustment. So, changes can be made in the color, design, graphics or any other component to create a unique layout.

Media Advertising Social Media Interaction With ROI Slides PDF
This slide shows the graph depicting the rising revenue after switching into new digital channels as compared with previous year. This Media Advertising Social Media Interaction With ROI Slides PDF is perfect for any presentation, be it in front of clients or colleagues. It is a versatile and stylish solution for organizing your meetings. The Media Advertising Social Media Interaction With ROI Slides PDF features a modern design for your presentation meetings. The adjustable and customizable slides provide unlimited possibilities for acing up your presentation. Slidegeeks has done all the homework before launching the product for you. So, do not wait, grab the presentation templates today

Retargeting Strategies To Improve Sales How Retargeted Ads Can Help Us Drive More Traffic Mockup PDF
This slide covers the major reasons for customers to click on retargeted ads. It includes causes such as they are drawn to products shown, want to find more about the product, find it easy to visit a website they already intend to visit. If your project calls for a presentation, then Slidegeeks is your go-to partner because we have professionally designed, easy-to-edit templates that are perfect for any presentation. After downloading, you can easily edit Retargeting Strategies To Improve Sales How Retargeted Ads Can Help Us Drive More Traffic Mockup PDF and make the changes accordingly. You can rearrange slides or fill them with different images. Check out all the handy templates

Trends In Store Ambiance Enhancing Customer Shopping Experience Slides PDF
This slide represents statistics related to the in-store ambiance that helps retail stores improve sales. It includes details regarding in-store music and its impact on customer behavior. If your project calls for a presentation, then Slidegeeks is your go to partner because we have professionally designed, easy to edit templates that are perfect for any presentation. After downloading, you can easily edit Trends In Store Ambiance Enhancing Customer Shopping Experience Slides PDF and make the changes accordingly. You can rearrange slides or fill them with different images. Check out all the handy templates.

Data Warehouse As A Service Market Expansion Trends Sample PDF
This slide shows data warehouse as a service market growth trends for highlighting scope of this service in future with market size of US 4.96 B. It include CAGR figures and major players segmentation etc. Showcasing this set of slides titled Data Warehouse As A Service Market Expansion Trends Sample PDF. The topics addressed in these templates are Market Is Expected, Organization Size, Deployment. All the content presented in this PPT design is completely editable. Download it and make adjustments in color, background, font etc. as per your unique business setting.

Forecasted Big Data Market Expansion Trends Download PDF
This slide shows forecasted Big data market growth trends till 2025, which gives an overview of growth trends among different countries and market players. It include current market size, annual CAGR rate and predicted market size etc. Pitch your topic with ease and precision using this Forecasted Big Data Market Expansion Trends Download PDF. This layout presents information on Billion Predicted Growth, Increasing Trends, Estimation Growth. It is also available for immediate download and adjustment. So, changes can be made in the color, design, graphics or any other component to create a unique layout.

USA Real Estate Investment Data Expansion Predictions Graphics PDF
This slide shows real estate investment data growth in USA with respect to age groups and investment types. It include investments types like income properties, dev sites and office etc. Pitch your topic with ease and precision using this USA Real Estate Investment Data Expansion Predictions Graphics PDF. This layout presents information on Rising Property, Age Groups Segmentation, Investment Types. It is also available for immediate download and adjustment. So, changes can be made in the color, design, graphics or any other component to create a unique layout.

Apparel Company Inventory Stock Management Report Icons PDF
This slide showcase stock summary report of apparel company in order to fulfill inventory level on time. It includes elements such as stock availability, inventory turn over ratio, returned items, top selling items, average inventory value by product category etc. Showcasing this set of slides titled Apparel Company Inventory Stock Management Report Icons PDF. The topics addressed in these templates are Stock Availability, Inventory Turn Over Ratio, Returned Items. All the content presented in this PPT design is completely editable. Download it and make adjustments in color, background, font etc. as per your unique business setting.

Supply Chain Management Inventory Stock Report Brochure PDF
This slide illustrate inventory stock summary of supply chain management to deliver products to end consumer on time. It includes elements such as inventory to sales ratio, last 5 year inventory turnover, inventory carrying cost, inventory accuracy, out of stock items. Pitch your topic with ease and precision using this Supply Chain Management Inventory Stock Report Brochure PDF. This layout presents information on Inventory Carrying Cost, Inventory Accuracy, Out Of Stock Item. It is also available for immediate download and adjustment. So, changes can be made in the color, design, graphics or any other component to create a unique layout.
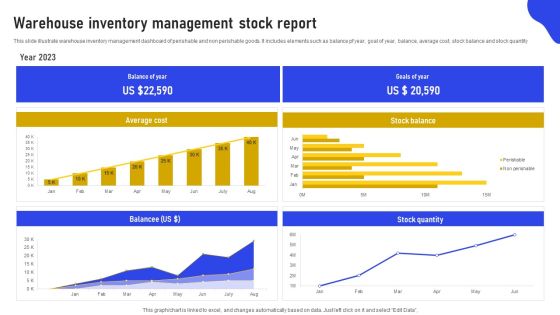
Warehouse Inventory Management Stock Report Slides PDF
This slide illustrate warehouse inventory management dashboard of perishable and non perishable goods. It includes elements such as balance pf year, goal of year, balance, average cost, stock balance and stock quantity. Showcasing this set of slides titled Warehouse Inventory Management Stock Report Slides PDF. The topics addressed in these templates are Average Cost, Stock Balance, Balancee. All the content presented in this PPT design is completely editable. Download it and make adjustments in color, background, font etc. as per your unique business setting.

Kpi Dashboard To Track Progress Of Tactics To Launch New Product Infographics PDF
Mentioned slide showcases KPI dashboard to monitor impact of product launch strategy on increasing business market share. It includes elements such as revenue, new customers, lead generation rate, customer satisfaction rate, revenue by customers, revenue and lead generation by marketing platform. Showcasing this set of slides titled Kpi Dashboard To Track Progress Of Tactics To Launch New Product Infographics PDF. The topics addressed in these templates are Quarterly Sales Comparison, Revenue Marketing, Revenue Customers. All the content presented in this PPT design is completely editable. Download it and make adjustments in color, background, font etc. as per your unique business setting.
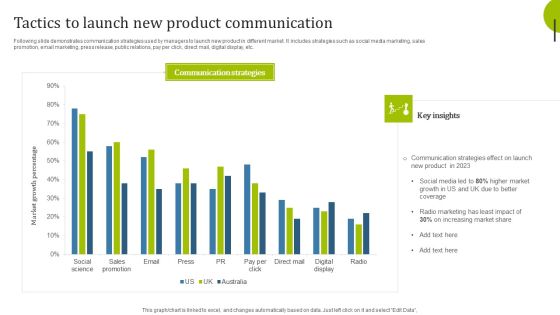
Tactics To Launch New Product Communication Pictures PDF
Following slide demonstrates communication strategies used by managers to launch new product in different market. It includes strategies such as social media marketing, sales promotion, email marketing, press release, public relations, pay per click, direct mail, digital display, etc. Showcasing this set of slides titled Tactics To Launch New Product Communication Pictures PDF. The topics addressed in these templates are Communication Strategies, Social Media, Market Growth. All the content presented in this PPT design is completely editable. Download it and make adjustments in color, background, font etc. as per your unique business setting.

Company Payout Dashboard Evaluation For E Commerce Business Background PDF
The slide illustrates a dashboard to assess business transactions and comparing it with last year. Various LPIs involved are percent change in no. of payments, payment modes, recent customers and monthly payments. Showcasing this set of slides titled Company Payout Dashboard Evaluation For E Commerce Business Background PDF. The topics addressed in these templates are Payment Modes, Recent Customers, Monthly Payments. All the content presented in this PPT design is completely editable. Download it and make adjustments in color, background, font etc. as per your unique business setting.
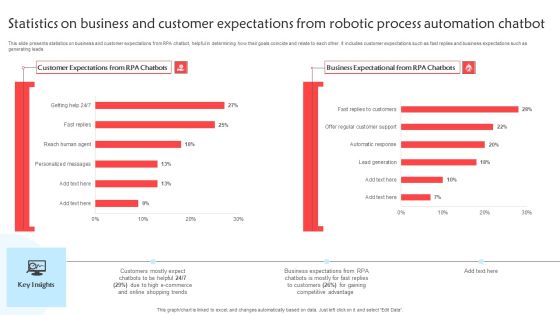
Statistics On Business And Customer Expectations From Robotic Process Automation Chatbot Themes PDF
This slide presents statistics on business and customer expectations from RPA chatbot, helpful in determining how their goals coincide and relate to each other. It includes customer expectations such as fast replies and business expectations such as generating leads. Pitch your topic with ease and precision using this Statistics On Business And Customer Expectations From Robotic Process Automation Chatbot Themes PDF. This layout presents information on Online Shopping Trends, E-Commerce, Competitive Advantage, Business Expectations. It is also available for immediate download and adjustment. So, changes can be made in the color, design, graphics or any other component to create a unique layout.
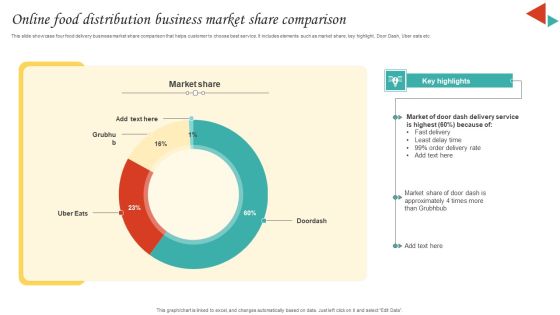
Online Food Distribution Business Market Share Comparison Diagrams PDF
This slide showcase four food delivery business market share comparison that helps customer to choose best service. It includes elements such as market share, key highlight, Door Dash, Uber eats etc. Showcasing this set of slides titled Online Food Distribution Business Market Share Comparison Diagrams PDF. The topics addressed in these templates are Market Share, Delivery Service, Least Delay Time. All the content presented in this PPT design is completely editable. Download it and make adjustments in color, background, font etc. as per your unique business setting.

Service Delivery Digital Market Size By Countries Demonstration PDF
Following slide demonstrates forecasted market size of service delivery automation by different countries which can be used by businesses to determine future opportunities. It includes various countries such as North America, Latin America, Europe, Asia pacific and south America. Pitch your topic with ease and precision using this Service Delivery Digital Market Size By Countries Demonstration PDF. This layout presents information on Global Service, Delivery Automation, Market Size Forecast. It is also available for immediate download and adjustment. So, changes can be made in the color, design, graphics or any other component to create a unique layout.
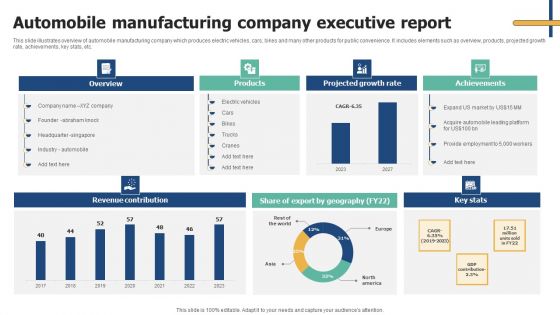
Automobile Manufacturing Company Executive Report Elements PDF
This slide illustrates overview of automobile manufacturing company which produces electric vehicles, cars, bikes and many other products for public convenience. It includes elements such as overview, products, projected growth rate, achievements, key stats, etc. Showcasing this set of slides titled Automobile Manufacturing Company Executive Report Elements PDF. The topics addressed in these templates are Overview, Products, Projected Growth Rate. All the content presented in this PPT design is completely editable. Download it and make adjustments in color, background, font etc. as per your unique business setting.

Fast Moving Consumer Goods Company Executive Report Microsoft PDF
This slide showcase description of ABC company of FMCG sector that provides durable items to end consumer. It covers elements such as overview, product verticals, geographical presence, awards and achievements, revenue contribution category wise and quarterly sales trend. Showcasing this set of slides titled Fast Moving Consumer Goods Company Executive Report Microsoft PDF. The topics addressed in these templates are Product Verticals, Geographical Presence, Awards Achievements. All the content presented in this PPT design is completely editable. Download it and make adjustments in color, background, font etc. as per your unique business setting.
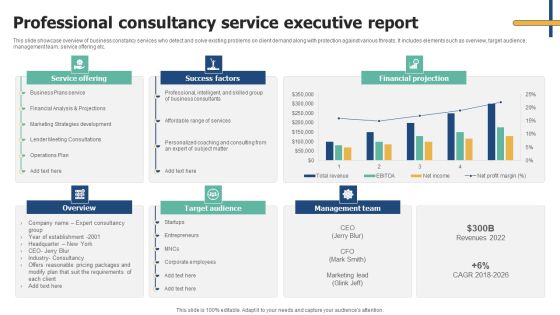
Professional Consultancy Service Executive Report Demonstration PDF
This slide showcase overview of business constancy services who detect and solve existing problems on client demand along with protection against various threats. It includes elements such as overview, target audience, management team, service offering etc. Showcasing this set of slides titled Professional Consultancy Service Executive Report Demonstration PDF. The topics addressed in these templates are Service Offering, Success Factors, Financial Projection. All the content presented in this PPT design is completely editable. Download it and make adjustments in color, background, font etc. as per your unique business setting.

Internet Server Upgradation Project Synopsis Microsoft PDF
This slide showcase project of internet server upgradations in office to increase productivity and efficiency of task competition. It includes elements such as project ID, expected progress, risk level, milestones, critical blockers, resolutions etc. Showcasing this set of slides titled Internet Server Upgradation Project Synopsis Microsoft PDF. The topics addressed in these templates are Project Information, Server Upgradation Project, Expected Completion. All the content presented in this PPT design is completely editable. Download it and make adjustments in color, background, font etc. as per your unique business setting.

IOT Implementation Project Synopsis Report Summary PDF
This slide illustrate internet of thing project summary status to analyze project activities and make required changes. It includes elements such as project name, task, progress, health, timeline, updates etc. Pitch your topic with ease and precision using this IOT Implementation Project Synopsis Report Summary PDF. This layout presents information on Development Stage, Testing Stage, Implementation Stage. It is also available for immediate download and adjustment. So, changes can be made in the color, design, graphics or any other component to create a unique layout.
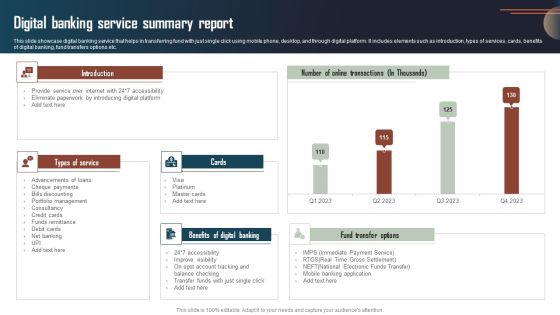
Digital Banking Service Summary Report Ideas PDF
This slide showcase digital banking service that helps in transferring fund with just single click using mobile phone, desktop, and through digital platform. It includes elements such as introduction, types of services, cards, benefits of digital banking, fund transfers options etc. Showcasing this set of slides titled Digital Banking Service Summary Report Ideas PDF. The topics addressed in these templates are Introduction, Cards, Benefits Digital Banking. All the content presented in this PPT design is completely editable. Download it and make adjustments in color, background, font etc. as per your unique business setting.

KPI Dashboard To Track Management Rate Throughout User Lifecycle Portrait PDF
This slide demonstrates KPI dashboard monitoring customer lifecycle to determine progress in customer response rate. It includes elements such as abandonment rate, response rate, engagement rate, response on popular topics and response on non popular topics. Showcasing this set of slides titled KPI Dashboard To Track Management Rate Throughout User Lifecycle Portrait PDF. The topics addressed in these templates are Customer Engagement, Response, Response Rate. All the content presented in this PPT design is completely editable. Download it and make adjustments in color, background, font etc. as per your unique business setting.

Barriers Related To E Banking Facility Awareness Guidelines PDF
This slide shows the issues which effects the digital effectiveness in banking company which includes lack of personal touch, technical challenges, lack of security, lack of IT Infrastructure, etc. Pitch your topic with ease and precision using this Barriers Related To E Banking Facility Awareness Guidelines PDF. This layout presents information on Cost Businesses, Fraud Transaction, Digital Effectiveness. It is also available for immediate download and adjustment. So, changes can be made in the color, design, graphics or any other component to create a unique layout.
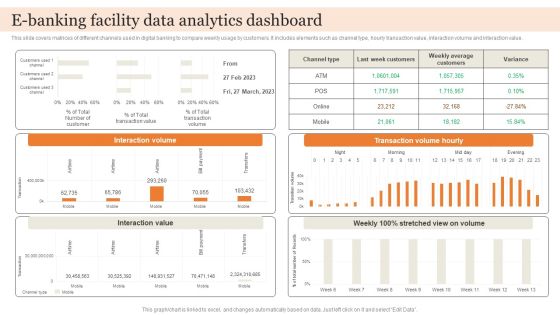
E Banking Facility Data Analytics Dashboard Brochure PDF
This slide covers matrices of different channels used in digital banking to compare weekly usage by customers. It includes elements such as channel type, hourly transaction value, interaction volume and interaction value. Showcasing this set of slides titled E Banking Facility Data Analytics Dashboard Brochure PDF. The topics addressed in these templates are Interaction Value, Transaction Volume Hourly, Interaction Volume. All the content presented in this PPT design is completely editable. Download it and make adjustments in color, background, font etc. as per your unique business setting.

Digital Terrorism Attack Trends On USA Ideas PDF
This slide shows cyber terrorism attack trends on USA organizations for decade to highlight importance of cyber security systems. It includes valuation of losses, categories of cyber attacks and victim companies etc. Showcasing this set of slides titled Digital Terrorism Attack Trends On USA Ideas PDF. The topics addressed in these templates are Key Insights, Internet, Digital Terrorism Attack Trends. All the content presented in this PPT design is completely editable. Download it and make adjustments in color, background, font etc. as per your unique business setting.

Sales Opportunity Monitoring Dashboard Ppt Professional Mockup PDF
This Sales Opportunity Monitoring Dashboard Ppt Professional Mockup PDF is perfect for any presentation, be it in front of clients or colleagues. It is a versatile and stylish solution for organizing your meetings. The Sales Opportunity Monitoring Dashboard Ppt Professional Mockup PDF features a modern design for your presentation meetings. The adjustable and customizable slides provide unlimited possibilities for acing up your presentation. Slidegeeks has done all the homework before launching the product for you. So, do not wait, grab the presentation templates today

Sales Employee Representative Performance Scorecard Dashboard For Healthcare Industry Clipart PDF
This slide showcases sales performance of healthcare products which can be used by managers to evaluate business achievements. It includes key components such as monthly sales comparison, sales performance of products by different channels, sales team performance. Pitch your topic with ease and precision using this Sales Employee Representative Performance Scorecard Dashboard For Healthcare Industry Clipart PDF. This layout presents information on Monthly Sales Comparison, Revenue By Previous Year, Sales Performance, Different Products, Different Channels, Sales Team Performance . It is also available for immediate download and adjustment. So, changes can be made in the color, design, graphics or any other component to create a unique layout.

Yearly Sales Employee Representative Performance Scorecard With Booking Price Summary PDF
Following slide highlights yearly sales performance assessment by various key performance metrics. It includes key metrics such as calls made, demos given, opportunities created, opportunities won and product booking price. Showcasing this set of slides titled Yearly Sales Employee Representative Performance Scorecard With Booking Price Summary PDF. The topics addressed in these templates are Calls Made, Demos Given, Opportunities Created, Opportunities Won, Product Booking Price. All the content presented in this PPT design is completely editable. Download it and make adjustments in color, background, font etc. as per your unique business setting.
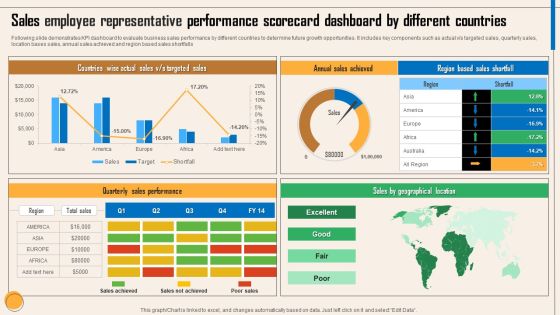
Sales Employee Representative Performance Scorecard Dashboard By Different Countries Themes PDF
Following slide demonstrates KPI dashboard to evaluate business sales performance by different countries to determine future growth opportunities. It includes key components such as actual v or s targeted sales, quarterly sales, location bases sales, annual sales achieved and region based sales shortfalls. Showcasing this set of slides titled Sales Employee Representative Performance Scorecard Dashboard By Different Countries Themes PDF. The topics addressed in these templates are Countries Wise Actual Sales, V Or S Targeted Sales, Annual Sales Achieved, Quarterly Sales Performance, Sales By Geographical Location. All the content presented in this PPT design is completely editable. Download it and make adjustments in color, background, font etc. as per your unique business setting.

Year Over Year Comparison Of Companys Sales Data Microsoft PDF
The purpose of this slide is to illustrate a valuable procedure that demonstrates to business owners how their growth has changed from the prior to the present year. It includes the sales comparison of five different companies for the years 2023 2022. Pitch your topic with ease and precision using this Year Over Year Comparison Of Companys Sales Data Microsoft PDF. This layout presents information on Sales Data Comparison, Liberal Government, Increase Investments. It is also available for immediate download and adjustment. So, changes can be made in the color, design, graphics or any other component to create a unique layout.
KPI Dashboard For Tracking Corporate Objectives Progress Template PDF
Following slide demonstrates progress tracking dashboard to determine objectives achieved by business. It includes elements such as objectives achieved, unachieved objectives, objectives achievement in progress and all objectives status. Showcasing this set of slides titled KPI Dashboard For Tracking Corporate Objectives Progress Template PDF. The topics addressed in these templates are Objectives Achieved, Unachieved Objectives, Objectives Progress . All the content presented in this PPT design is completely editable. Download it and make adjustments in color, background, font etc. as per your unique business setting.
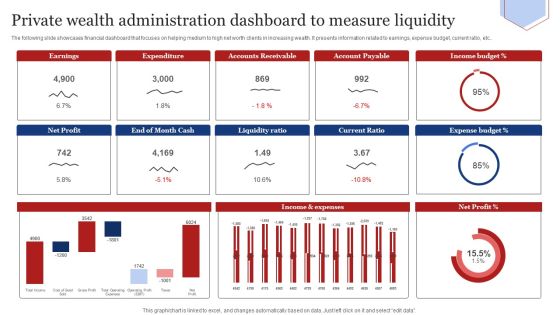
Private Wealth Administration Dashboard To Measure Liquidity Infographics PDF
The following slide showcases financial dashboard that focuses on helping medium to high net worth clients in increasing wealth. It presents information related to earnings, expense budget, current ratio, etc. Showcasing this set of slides titled Private Wealth Administration Dashboard To Measure Liquidity Infographics PDF. The topics addressed in these templates are Liquidity Ratio, Current Ratio, Expense Budget. All the content presented in this PPT design is completely editable. Download it and make adjustments in color, background, font etc. as per your unique business setting.
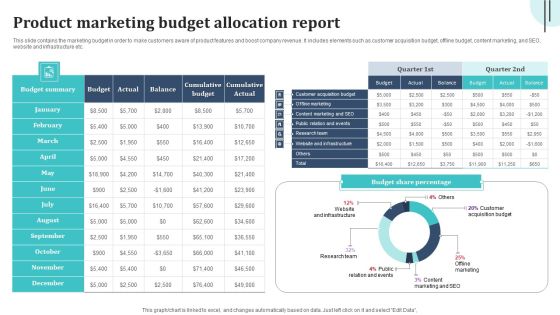
Product Marketing Budget Allocation Report Graphics PDF
This slide contains the marketing budget in order to make customers aware of product features and boost company revenue. It includes elements such as customer acquisition budget, offline budget, content marketing, and SEO, website and infrastructure etc. Pitch your topic with ease and precision using this Product Marketing Budget Allocation Report Graphics PDF. This layout presents information on Cumulative Budget, Offline Marketing, Research Team. It is also available for immediate download and adjustment. So, changes can be made in the color, design, graphics or any other component to create a unique layout.
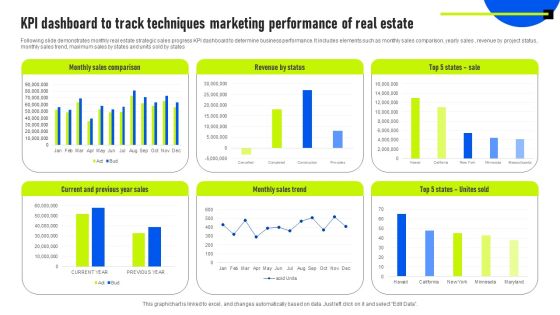
KPI Dashboard To Track Techniques Marketing Performance Of Real Estate Information PDF
Following slide demonstrates monthly real estate strategic sales progress KPI dashboard to determine business performance. It includes elements such as monthly sales comparison, yearly sales , revenue by project status, monthly sales trend, maximum sales by states and units sold by states. Showcasing this set of slides titled KPI Dashboard To Track Techniques Marketing Performance Of Real Estate Information PDF. The topics addressed in these templates are Revenue By Status, Monthly Sales Comparison, Monthly Sales Trend. All the content presented in this PPT design is completely editable. Download it and make adjustments in color, background, font etc. as per your unique business setting.

Statistical Data Highlighting Gaming Industry Market Size Ideas PDF
Following slide exhibits types of popular gaming apps. Purpose of this slide is to determine trending and demanding gaming apps that drives revenue growth and download counts. It include appps such as adventure, role playing, arcade and betting. Showcasing this set of slides titled Statistical Data Highlighting Gaming Industry Market Size Ideas PDF. The topics addressed in these templates are Statistical Data Highlighting, Gaming Industry Market Size. All the content presented in this PPT design is completely editable. Download it and make adjustments in color, background, font etc. as per your unique business setting.

Dashboard To Analyze Healthcare Organization Data Summary PDF
This slide depicts the dashboard used for analyzing healthcare organization data. The purpose of this template is to provide details related to the patients, staffs and cost. It includes information related to the outpatient and inpatient trends, waiting time, etc. Showcasing this set of slides titled Dashboard To Analyze Healthcare Organization Data Summary PDF. The topics addressed in these templates are Patient Satisfaction, Average, Analyze Healthcare Organization Data. All the content presented in this PPT design is completely editable. Download it and make adjustments in color, background, font etc. as per your unique business setting.

Impact Of Marketing Campaign Budget On Search Traffic Brochure PDF
This slide represents the search engine marketing campaigns budget on increasing search traffic on the website. It includes details related to the set budget, clicks, costs, impressions, top impressions, conversions etc. Pitch your topic with ease and precision using this Impact Of Marketing Campaign Budget On Search Traffic Brochure PDF. This layout presents information on Cost, Budget, Impact Of Marketing Campaign. It is also available for immediate download and adjustment. So, changes can be made in the color, design, graphics or any other component to create a unique layout.

Marketing Campaign Performance Measurement Dashboard Download PDF
This slide represents the dashboard showing the performance of search engine marketing campaign run by an organization. It includes key performance indicators such as account activity, campaigns by targeting, landing page speed, keyword relevancy, budget spendings etc. Showcasing this set of slides titled Marketing Campaign Performance Measurement Dashboard Download PDF. The topics addressed in these templates are Keyword Relevancy, Campaigns By Targeting, Budget. All the content presented in this PPT design is completely editable. Download it and make adjustments in color, background, font etc. as per your unique business setting.
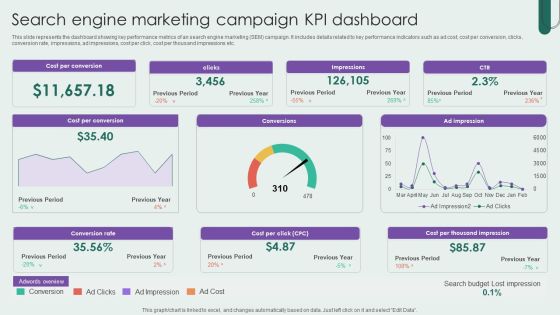
Search Engine Marketing Campaign KPI Dashboard Inspiration PDF
This slide represents the dashboard showing key performance metrics of an search engine marketing SEM campaign. It includes details related to key performance indicators such as ad cost, cost per conversion, clicks, conversion rate, impressions, ad impressions, cost per click, cost per thousand impressions etc. Showcasing this set of slides titled Search Engine Marketing Campaign KPI Dashboard Inspiration PDF. The topics addressed in these templates are Search Engine Marketing, Campaign KPI Dashboard. All the content presented in this PPT design is completely editable. Download it and make adjustments in color, background, font etc. as per your unique business setting.

Ads Agency Search Engine Marketing Sem Campaign Dashboard Graphics PDF
This slide represents the dashboard showing the search engine marketing campaign run by an ads agency. It includes details related to the clicks and impressions, top campaign by clicks and top keywords. Showcasing this set of slides titled Ads Agency Search Engine Marketing Sem Campaign Dashboard Graphics PDF. The topics addressed in these templates are Ads Agency Search Engine Marketing, Campaign Dashboard. All the content presented in this PPT design is completely editable. Download it and make adjustments in color, background, font etc. as per your unique business setting.
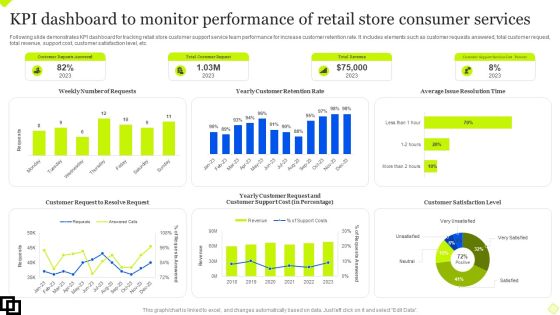
KPI Dashboard To Monitor Performance Of Retail Store Consumer Services Summary PDF
Following slide demonstrates KPI dashboard for tracking retail store customer support service team performance for increase customer retention rate. It includes elements such as customer requests answered, total customer request, total revenue, support cost, customer satisfaction level, etc. Showcasing this set of slides titled KPI Dashboard To Monitor Performance Of Retail Store Consumer Services Summary PDF. The topics addressed in these templates are Customer Request, Customer Retention Rate, Customer Satisfaction Level. All the content presented in this PPT design is completely editable. Download it and make adjustments in color, background, font etc. as per your unique business setting.

Paid Media Search Advertisement Lead Generation Survey Report Comparison Clipart PDF
This slide showcase per fence of digital marketers toward paid search marketing tools strategy for product promotion. It includes elements such as organic search, paid search, social media and email marketing strategy. Pitch your topic with ease and precision using this Paid Media Search Advertisement Lead Generation Survey Report Comparison Clipart PDF. This layout presents information on Search Marketing, B2B Marketing, Higher Profit. It is also available for immediate download and adjustment. So, changes can be made in the color, design, graphics or any other component to create a unique layout.
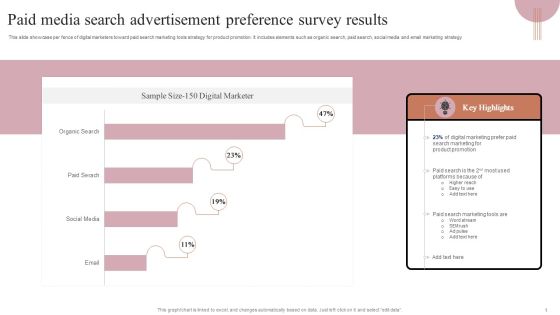
Paid Media Search Advertisement Preference Survey Results Download PDF
This slide showcase per fence of digital marketers toward paid search marketing tools strategy for product promotion. It includes elements such as organic search, paid search, social media and email marketing strategy. Showcasing this set of slides titled Paid Media Search Advertisement Preference Survey Results Download PDF. The topics addressed in these templates are Digital Marketing, Product Promotion, Search Marketing Tools. All the content presented in this PPT design is completely editable. Download it and make adjustments in color, background, font etc. as per your unique business setting.

Impact 2 Decreased Customer Response And Product Adoption Rate Guidelines PDF
This slide showcases the negative impact of customer onboarding challenges on the business. The challenges covered are decreased product adoption and customer response rate. This Impact 2 Decreased Customer Response And Product Adoption Rate Guidelines PDF is perfect for any presentation, be it in front of clients or colleagues. It is a versatile and stylish solution for organizing your meetings. The product features a modern design for your presentation meetings. The adjustable and customizable slides provide unlimited possibilities for acing up your presentation. Slidegeeks has done all the homework before launching the product for you. So, do not wait, grab the presentation templates today
KPI Dashboard For Tracking Marcom Mix Strategy Progress Ideas PDF
Following slide showcases marketing mix progress monitoring dashboard to determine business performance. It includes elements such as clicks, impressions, click through rate, conversion rate, cost per click and monthly overview to Google ads. Showcasing this set of slides titled KPI Dashboard For Tracking Marcom Mix Strategy Progress Ideas PDF. The topics addressed in these templates are Kpi Dashboard, Tracking Marcom, Mix Strategy Progress. All the content presented in this PPT design is completely editable. Download it and make adjustments in color, background, font etc. as per your unique business setting.

Marcom Mix Strategy Impact On Business Revenue Themes PDF
Mentioned slide showcases statistical data on promotional mix used by business to determine business sales growth. It includes promotional mix such as social media, email marketing, word of mouth, promotional campaign, advertisement, etc. Showcasing this set of slides titled Marcom Mix Strategy Impact On Business Revenue Themes PDF. The topics addressed in these templates are Social Media Marketing Led, Increase Sales, Email Marketing Led. All the content presented in this PPT design is completely editable. Download it and make adjustments in color, background, font etc. as per your unique business setting.

Digital KPI Dashboard To Track Email Bounce Slides PDF
This slide shows dashboard which can e used by organizations to monitor performance of email. It includes key performance indicators such as traffic status, conversions, behaviors, etc. Pitch your topic with ease and precision using this Digital KPI Dashboard To Track Email Bounce Slides PDF. This layout presents information on Digital Kpi Dashboard, Track Email Bounce. It is also available for immediate download and adjustment. So, changes can be made in the color, design, graphics or any other component to create a unique layout.

Key Statistics Of High And Soft Digital Email Bounce Rate Summary PDF
This slide shows rate which can be used by organization to represent email bounce rate. It includes hard bounce rate and soft bounce rate. Pitch your topic with ease and precision using this Key Statistics Of High And Soft Digital Email Bounce Rate Summary PDF. This layout presents information on Key Statistics, Soft Digital, Email Bounce Rate. It is also available for immediate download and adjustment. So, changes can be made in the color, design, graphics or any other component to create a unique layout.
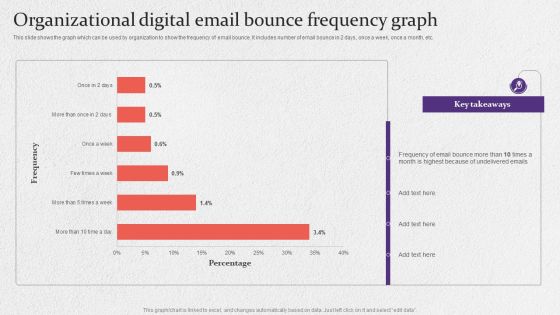
Organizational Digital Email Bounce Frequency Graph Formats PDF
This slide shows the graph which can be used by organization to show the frequency of email bounce. It includes number of email bounce in 2 days, once a week, once a month, etc. Pitch your topic with ease and precision using this Organizational Digital Email Bounce Frequency Graph Formats PDF. This layout presents information on Organizational Digital, Email Bounce Frequency Graph. It is also available for immediate download and adjustment. So, changes can be made in the color, design, graphics or any other component to create a unique layout.

Average Return Of Property Income Trust By Market Capitalization Pictures PDF
The following slide displays statistics to analyze income generated by REIT to review return potential. It further includes details about micro, small, mid and large cap. Showcasing this set of slides titled Average Return Of Property Income Trust By Market Capitalization Pictures PDF. The topics addressed in these templates are Gross Real Estate Assets, Total Dividend, Micro Cap. All the content presented in this PPT design is completely editable. Download it and make adjustments in color, background, font etc. as per your unique business setting.
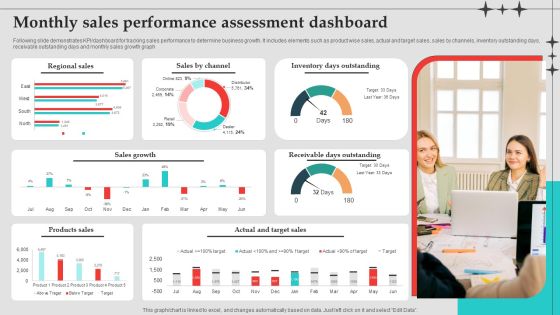
Monthly Sales Performance Assessment Dashboard Download PDF
Following slide demonstrates KPI or dashboard for tracking sales performance to determine business growth. It includes elements such as product wise sales, actual and target sales, sales by channels, inventory outstanding days, receivable outstanding days and monthly sales growth graph. Showcasing this set of slides titled Monthly Sales Performance Assessment Dashboard Download PDF. The topics addressed in these templates are Sales Growth, Inventory Days Outstanding, Target Sales. All the content presented in this PPT design is completely editable. Download it and make adjustments in color, background, font etc. as per your unique business setting.
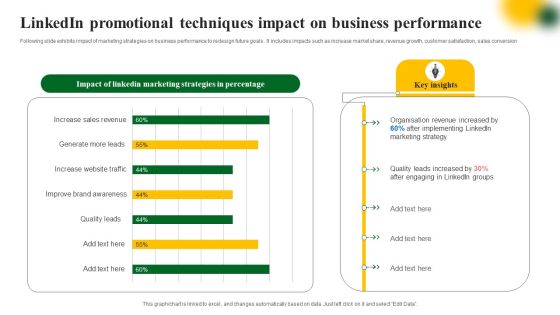
Linkedin Promotional Techniques Impact On Business Performance Slides PDF
Following slide exhibits impact of marketing strategies on business performance to redesign future goals . It includes impacts such as increase market share, revenue growth, customer satisfaction, sales conversion. Showcasing this set of slides titled Linkedin Promotional Techniques Impact On Business Performance Slides PDF. The topics addressed in these templates are Marketing Strategy, Implementing Linkedin, Organisation Revenue. All the content presented in this PPT design is completely editable. Download it and make adjustments in color, background, font etc. as per your unique business setting.
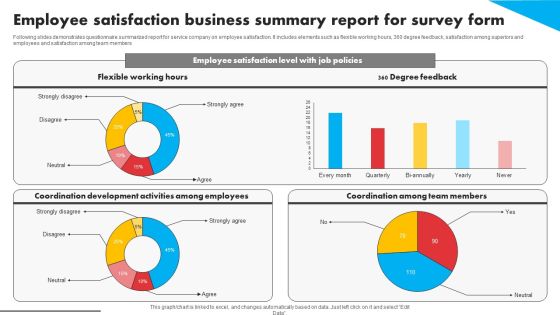
Employee Satisfaction Business Summary Report For Survey Form Survey SS
Following slides demonstrates questionnaire summarized report for service company on employee satisfaction. It includes elements such as flexible working hours, 360 degree feedback, satisfaction among superiors and employees and satisfaction among team members. Pitch your topic with ease and precision using this Employee Satisfaction Business Summary Report For Survey Form Survey SS. This layout presents information on Employee Satisfaction, Business Summary Report, Survey Form. It is also available for immediate download and adjustment. So, changes can be made in the color, design, graphics or any other component to create a unique layout.
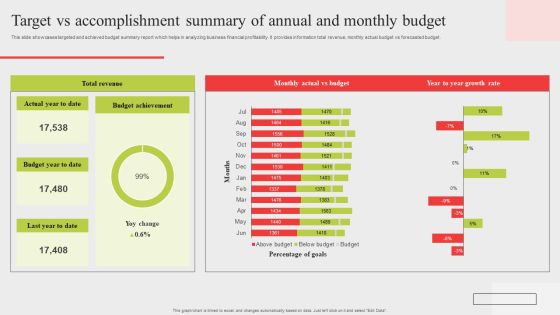
Target Vs Accomplishment Summary Of Annual And Monthly Budget Introduction PDF
This slide showcases targeted and achieved budget summary report which helps in analyzing business financial profitability. It provides information total revenue, monthly actual budget vs forecasted budget . Showcasing this set of slides titled Target Vs Accomplishment Summary Of Annual And Monthly Budget Introduction PDF. The topics addressed in these templates are Total Revenue, Budget Achievement, Monthly Actual Vs Budget. All the content presented in this PPT design is completely editable. Download it and make adjustments in color, background, font etc. as per your unique business setting.

Demand Management In Agile Organization Matrix Aligning Demand And Supply Microsoft PDF
This slide represents agile business management matrix aligning demand and supply. It includes matrix showing actual demand, forecasted demand, projected inventory on hand and actual inventory on hand reasons for undersupply and oversupply Pitch your topic with ease and precision using this Demand Management In Agile Organization Matrix Aligning Demand And Supply Microsoft PDF. This layout presents information on Demand Exceeds Forecast, Demand Exceeds Supply, Supply Exceeds Demand. It is also available for immediate download and adjustment. So, changes can be made in the color, design, graphics or any other component to create a unique layout.
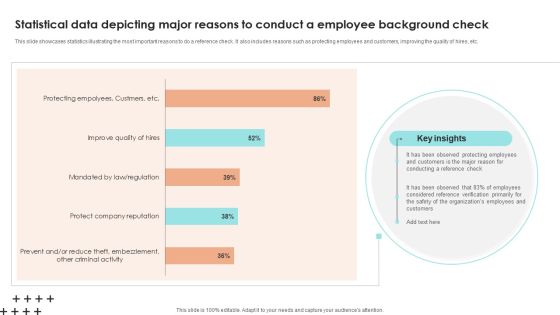
Statistical Data Depicting Major Reasons To Conduct A Employee Background Check Download PDF
This slide showcases statistics illustrating the most important reasons to do a reference check. It also includes reasons such as protecting employees and customers, improving the quality of hires, etc. Pitch your topic with ease and precision using this Statistical Data Depicting Major Reasons To Conduct A Employee Background Check Download PDF. This layout presents information on Key Insights, Reference Check, Customers. It is also available for immediate download and adjustment. So, changes can be made in the color, design, graphics or any other component to create a unique layout.

Robotic Process Automation Systemrpa For Small Business Improving Return On Investment Dashboard Ideas PDF
The following slide highlights improving return on investment using robotic process automation to streamline workflows, flexibility and responsiveness etc. It includes components such as total bots, total hours saved, total money saved, total bot runtime, hours saved by bots, results distribution, most popular flows etc. Showcasing this set of slides titled Robotic Process Automation Systemrpa For Small Business Improving Return On Investment Dashboard Ideas PDF. The topics addressed in these templates are Results Distribution, Popular Flows, Runtime. All the content presented in this PPT design is completely editable. Download it and make adjustments in color, background, font etc. as per your unique business setting.

Change Metrics To Analyze Status By Priority Formats PDF
The following slide displays dashboard for real time tracking of major change kpis of the organization. It includes elements such as requests, projects, open, approved, review, in- progress, etc. Pitch your topic with ease and precision using this Change Metrics To Analyze Status By Priority Formats PDF This layout presents information on Project, Request Statistics, Priority. It is also available for immediate download and adjustment. So, changes can be made in the color, design, graphics or any other component to create a unique layout.

Metrics With Open Changes By Priority And Age Guidelines PDF
This slide showcases dashboard for monitoring status of open changes in the organization to ensure timely resolution of tickets raised. It includes key elements such as backlog growth, days, trend, distribution, etc. Pitch your topic with ease and precision using this Metrics With Open Changes By Priority And Age Guidelines PDF This layout presents information on Change Backlog Growth, Priority, Age. It is also available for immediate download and adjustment. So, changes can be made in the color, design, graphics or any other component to create a unique layout.

Monthly Financial Metrics Dashboard With Income Statement Infographics PDF
This following slide displays kpis to communicate key financial information to both internal and external stakeholders. It further includes details such as OPEX ratio, revenue and COGS, income, expenses, etc. Showcasing this set of slides titled Monthly Financial Metrics Dashboard With Income Statement Infographics PDF. The topics addressed in these templates are Gross Profit Margin, Taxes, Revenue. All the content presented in this PPT design is completely editable. Download it and make adjustments in color, background, font etc. as per your unique business setting.
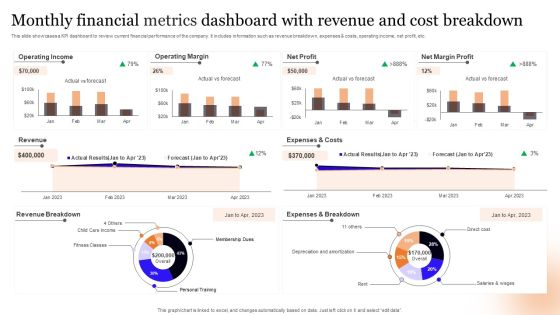
Monthly Financial Metrics Dashboard With Revenue And Cost Breakdown Information PDF
This slide showcases a KPI dashboard to review current financial performance of the company. It includes information such as revenue breakdown, expenses and costs, operating income, net profit, etc. Pitch your topic with ease and precision using this Monthly Financial Metrics Dashboard With Revenue And Cost Breakdown Information PDF. This layout presents information on Operating Income, Operating Margin, Net Profit. It is also available for immediate download and adjustment. So, changes can be made in the color, design, graphics or any other component to create a unique layout.

Monthly Financial Metrics Graph With Operating Profit And Cost Of Goods Sold Pictures PDF
This slide showcases monthly analytics for to keep company finances organized and identify problem areas. It further includes details about marketing, professional fees, COGS and other operations. Pitch your topic with ease and precision using this Monthly Financial Metrics Graph With Operating Profit And Cost Of Goods Sold Pictures PDF. This layout presents information on Key Insights, Operating Profit, Total Revenue. It is also available for immediate download and adjustment. So, changes can be made in the color, design, graphics or any other component to create a unique layout.

Cost Management And Cut Dashboard With Warehouse Statistics Sample PDF
The following slide showcases dashboard for containment of warehouse cost of the company by tracking and reporting major expense KPIs. It further includes elements such as variance, operations and storage expenditure, etc. Showcasing this set of slides titled Cost Management And Cut Dashboard With Warehouse Statistics Sample PDF. The topics addressed in these templates are Monthly Operations Cost, Monthly Storage Cost, Warehouse Stats. All the content presented in this PPT design is completely editable. Download it and make adjustments in color, background, font etc. as per your unique business setting.

Cryptocurrency Mining Statistics With Electricity Consumption And Average Revenue Clipart PDF
This slide showcases statistics of bitcoin mining that can help in identifying the monthly average revenue of miners and electricity cost incurred worldwide. It also showcases electricity consumption and mining pools hash rate distribution. Showcasing this set of slides titled Cryptocurrency Mining Statistics With Electricity Consumption And Average Revenue Clipart PDF. The topics addressed in these templates are Average Revenue Bitcoin Miners, Mining Pools Hash Rate, Electricity Consumption Bitcoin. All the content presented in this PPT design is completely editable. Download it and make adjustments in color, background, font etc. as per your unique business setting.
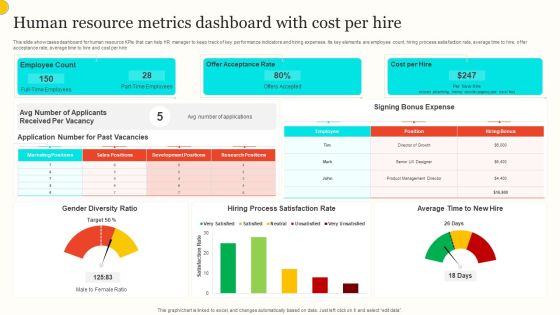
Human Resource Metrics Dashboard With Cost Per Hire Portrait PDF
This slide showcases dashboard for human resource KPIs that can help HR manager to keep track of key performance indicators and hiring expenses. Its key elements are employee count, hiring process satisfaction rate, average time to hire, offer acceptance rate, average time to hire and cost per hire. Showcasing this set of slides titled Human Resource Metrics Dashboard With Cost Per Hire Portrait PDF. The topics addressed in these templates are Employee Count, Offer Acceptance Rate, Cost Per Hire. All the content presented in this PPT design is completely editable. Download it and make adjustments in color, background, font etc. as per your unique business setting.
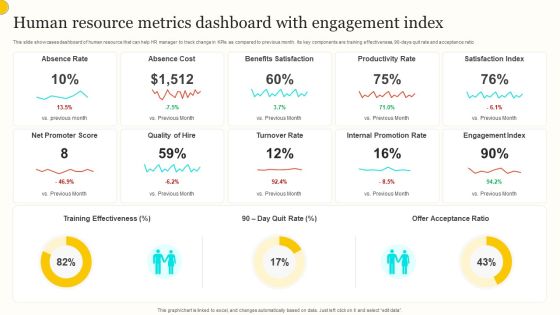
Human Resource Metrics Dashboard With Engagement Index Guidelines PDF
This slide showcases dashboard of human resource that can help HR manager to track change in KPIs as compared to previous month. Its key components are training effectiveness, 90 days quit rate and acceptance ratio. Pitch your topic with ease and precision using this Human Resource Metrics Dashboard With Engagement Index Guidelines PDF. This layout presents information on Absence Rate, Absence Cost, Benefits Satisfaction. It is also available for immediate download and adjustment. So, changes can be made in the color, design, graphics or any other component to create a unique layout.

Human Resource Metrics With New Hire Turnover Professional PDF
This slide showcases human resource dashboard that can help to track the KPIs that are time to fill, quality of hire, hiring source and new hire turnover. It also illustrates the performance score graph that can help to evaluate the recruitment efficiency of different HR employees. Pitch your topic with ease and precision using this Human Resource Metrics With New Hire Turnover Professional PDF. This layout presents information on Hiring Source, New Hire Turnover, Hr Employees Performance Score. It is also available for immediate download and adjustment. So, changes can be made in the color, design, graphics or any other component to create a unique layout.
Real Time Employment Tracking Dashboard With Human Resource Metrics Brochure PDF
This slide showcases dashboard that can help human resource manager to track the salary and hiring status of employee in organization. Its key KPIs are permanent rate, turnover rate, absenteeism rate, employees hired and employees left. Showcasing this set of slides titled Real Time Employment Tracking Dashboard With Human Resource Metrics Brochure PDF. The topics addressed in these templates are Average Age, Permanent Rate, Headcount. All the content presented in this PPT design is completely editable. Download it and make adjustments in color, background, font etc. as per your unique business setting.

Negative Outcomes Resulting From Workplace Conflicts Clipart PDF
This slide shows according to the most recent workplace data, the coronavirus pandemic has had a significant impact on workplace patterns. It includes personal insults , resignations, project failure bullying, employees moving to different departments etc. Showcasing this set of slides titled Negative Outcomes Resulting From Workplace Conflicts Clipart PDF. The topics addressed in these templates are Percent Of Employees, Workplace Politics, Employee Satisfaction Ratings. All the content presented in this PPT design is completely editable. Download it and make adjustments in color, background, font etc. as per your unique business setting.
Statistical Data For Identity Fraud Reports Icons PDF
This slide showcases identity thefts and frauds complaints in various years. This template focuses on providing layers of protection to customers digital identities and reduce risk of financial loss. It includes information related to consumer complainants, etc. Showcasing this set of slides titled Statistical Data For Identity Fraud Reports Icons PDF. The topics addressed in these templates are Poor Management Information, Lack Of Transparency, Protected Accounts. All the content presented in this PPT design is completely editable. Download it and make adjustments in color, background, font etc. as per your unique business setting.

Big Data In Health Industry Dashboard In Industry Summary PDF
The slide depicts patient KPI dashboard for healthcare which can be used to improve service levels as well as treatment across departments. It include metrics such as bed occupancy rate, patient turnover, satisfaction rate, missed and cancelled appointment rate. Showcasing this set of slides titled Big Data In Health Industry Dashboard In Industry Summary PDF. The topics addressed in these templates are Geriatrics, Gynecology, Internal Medicine. All the content presented in this PPT design is completely editable. Download it and make adjustments in color, background, font etc. as per your unique business setting.
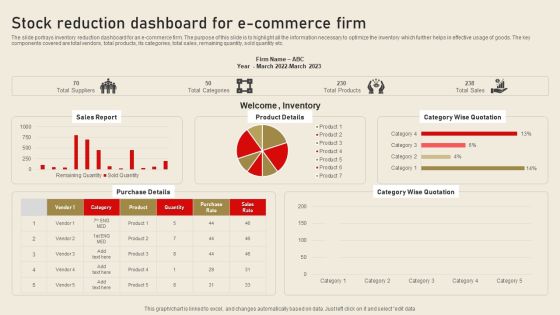
Stock Reduction Dashboard For E Commerce Firm Ideas PDF
The slide portrays inventory reduction dashboard for an e commerce firm. The purpose of this slide is to highlight all the information necessary to optimize the inventory which further helps in effective usage of goods. The key components covered are total vendors, total products, its categories, total sales, remaining quantity, sold quantity etc. Showcasing this set of slides titled Stock Reduction Dashboard For E Commerce Firm Ideas PDF. The topics addressed in these templates are Sales Report, Product Details, Category Wise Quotation. All the content presented in this PPT design is completely editable. Download it and make adjustments in color, background, font etc. as per your unique business setting.

Reasons Customer Store Digital For Product Buying Microsoft PDF
This slide showcase reasons why customer prefers to purchase product and service online rather than offline. It includes elements such as free home delivery, discount coupons, positive reviews, easy product return policy, easy checkout options etc. Showcasing this set of slides titled Reasons Customer Store Digital For Product Buying Microsoft PDF. The topics addressed in these templates are Maximum Customer, Online Sales, Buy One Get. All the content presented in this PPT design is completely editable. Download it and make adjustments in color, background, font etc. as per your unique business setting.
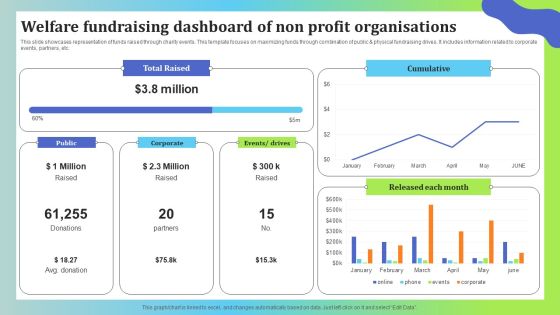
Welfare Fundraising Dashboard Of Non Profit Organisations Graphics PDF
This slide showcases representation of funds raised through charity events. This template focuses on maximizing funds through combination of public and physical fundraising drives. It includes information related to corporate events, partners, etc. Showcasing this set of slides titled Welfare Fundraising Dashboard Of Non Profit Organisations Graphics PDF. The topics addressed in these templates are Total Raised, Cumulative, Each Month. All the content presented in this PPT design is completely editable. Download it and make adjustments in color, background, font etc. as per your unique business setting.

B2B Event Advertising Channels Impact On Customer Engagement Summary PDF
Following slide demonstrates experimental marketing platforms which can be used to improve business customer engagement rate. It includes experimental marketing channels such as virtual, hybrid and in person. Showcasing this set of slides titled B2B Event Advertising Channels Impact On Customer Engagement Summary PDF. The topics addressed in these templates are Event Marketing, Channel Growth, Virtual Event Marketing. All the content presented in this PPT design is completely editable. Download it and make adjustments in color, background, font etc. as per your unique business setting.
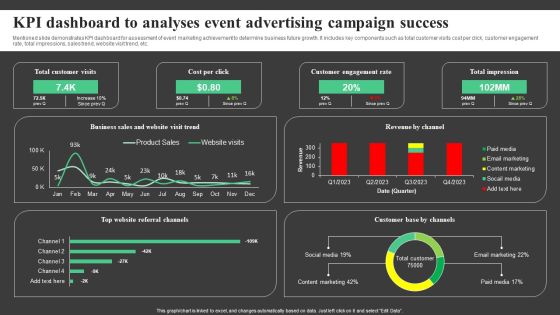
KPI Dashboard To Analyses Event Advertising Campaign Success Topics PDF
Mentioned slide demonstrates KPI dashboard for assessment of event marketing achievement to determine business future growth. It includes key components such as total customer visits cost per click, customer engagement rate, total impressions, sales trend, website visit trend, etc. Showcasing this set of slides titled KPI Dashboard To Analyses Event Advertising Campaign Success Topics PDF. The topics addressed in these templates are Total Customer Visits, Cost Per Click, Customer Engagement Rate . All the content presented in this PPT design is completely editable. Download it and make adjustments in color, background, font etc. as per your unique business setting.
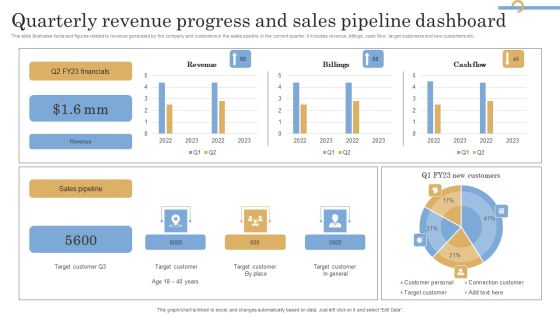
Quarterly Revenue Progress And Sales Pipeline Dashboard Information PDF
This slide illustrates facts and figures related to revenue generated by the company and customers in the sales pipeline in the current quarter. It includes revenue, billings, cash flow, target customers and new customers etc. Showcasing this set of slides titled Quarterly Revenue Progress And Sales Pipeline Dashboard Information PDF. The topics addressed in these templates are Financials, Revenue, Sales Pipeline. All the content presented in this PPT design is completely editable. Download it and make adjustments in color, background, font etc. as per your unique business setting.

Global Healthcare Device Sale Trends Microsoft PDF
This slide shows international market sale trends that can be used to frame future marketing strategies to boost overall revenue of organization. It include projected sales over next five years, current growth data and top global players etc.Showcasing this set of slides titled Global Healthcare Device Sale Trends Microsoft PDF. The topics addressed in these templates are Market Growth, Incremental Growth, Growth Current. All the content presented in this PPT design is completely editable. Download it and make adjustments in color, background, font etc. as per your unique business setting.

Global Sales Of Top Healthcare Equipment Companies Clipart PDF
This slide shows sales graph of top 10 global players in field of medical sales with their revenue for the year of 2023. It include determinants of sales, sales revenue of global players for 2023 etc. Showcasing this set of slides titled Global Sales Of Top Healthcare Equipment Companies Clipart PDF. The topics addressed in these templates are Total Market, Medical Device, Registered Players. All the content presented in this PPT design is completely editable. Download it and make adjustments in color, background, font etc. as per your unique business setting.
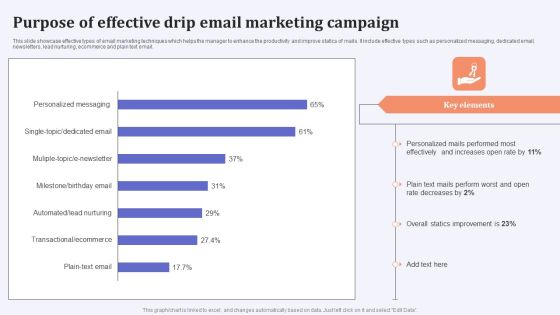
Purpose Of Effective Drip Email Marketing Campaign Brochure PDF
This slide showcase effective types of email marketing techniques which helps the manager to enhance the productivity and improve statics of mails. It include effective types such as personalized messaging, dedicated email, newsletters, lead nurturing, ecommerce and plain text email. Showcasing this set of slides titled Purpose Of Effective Drip Email Marketing Campaign Brochure PDF. The topics addressed in these templates are Personalized Mails, Rate Decreases, Overall Statics Improvement. All the content presented in this PPT design is completely editable. Download it and make adjustments in color, background, font etc. as per your unique business setting.
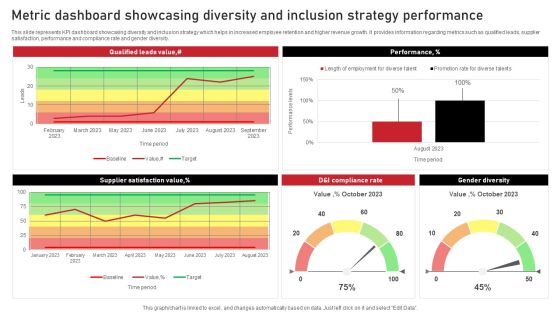
Metric Dashboard Showcasing Diversity And Inclusion Strategy Performance Background PDF
This slide represents KPI dashboard showcasing diversity and inclusion strategy which helps in increased employee retention and higher revenue growth. It provides information regarding metrics such as qualified leads, supplier satisfaction, performance and compliance rate and gender diversity. Showcasing this set of slides titled Metric Dashboard Showcasing Diversity And Inclusion Strategy Performance Background PDF. The topics addressed in these templates are Performance, Gender Diversity, Performance. All the content presented in this PPT design is completely editable. Download it and make adjustments in color, background, font etc. as per your unique business setting.

Metric Dashboard Showcasing Measurement Of Gender Diversity Pay Gap Sample PDF
This slide represents KPI dashboard showcasing metrics to measure gender pay gap. It provides information regarding salary pay gap, bonus pay gap, women promoted, recruited, and total women in each department. Pitch your topic with ease and precision using this Metric Dashboard Showcasing Measurement Of Gender Diversity Pay Gap Sample PDF. This layout presents information on Marketing, Screened, Delivery. It is also available for immediate download and adjustment. So, changes can be made in the color, design, graphics or any other component to create a unique layout.

Automated Internet Marketing Dashboard With Key Metrics Information PDF
The following slide highlights dashboard for digital advertising for graphical representation of marketing performance. It includes components such as cost of advertisements, cost per click, advertisements, no. of page views etc. Showcasing this set of slides titled Automated Internet Marketing Dashboard With Key Metrics Information PDF. The topics addressed in these templates are Cost Advertisements, Clicks Advertisement, Cost Per Click. All the content presented in this PPT design is completely editable. Download it and make adjustments in color, background, font etc. as per your unique business setting.
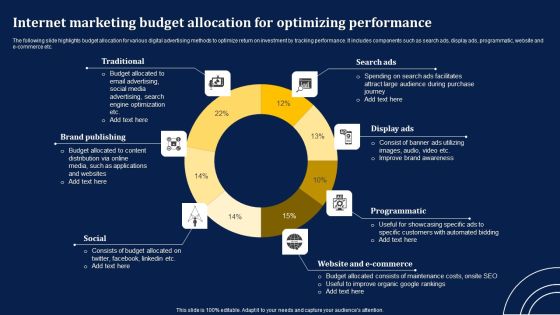
Internet Marketing Budget Allocation For Optimizing Performance Summary PDF
The following slide highlights budget allocation for various digital advertising methods to optimize return on investment by tracking performance. It includes components such as search ads, display ads, programmatic, website and e-commerce etc. Showcasing this set of slides titled Internet Marketing Budget Allocation For Optimizing Performance Summary PDF. The topics addressed in these templates are Search Ads, Display Ads, Programmatic. All the content presented in this PPT design is completely editable. Download it and make adjustments in color, background, font etc. as per your unique business setting.

Statistical Relationship Between Organic Growth Procedure And Profitability Rules PDF
This slide showcases graph depicting relationship between organic growth process and profit . It includes annual growth , annual profits , frequent , occasional and no researches etc. Pitch your topic with ease and precision using this Statistical Relationship Between Organic Growth Procedure And Profitability Rules PDF. This layout presents information on Key Insights, Frequency, Profitability. It is also available for immediate download and adjustment. So, changes can be made in the color, design, graphics or any other component to create a unique layout.

Overall Performance Improvement Across B2B Account Management Department Guidelines PDF
This slide provides information regarding improved overall performance in terms of increased revenue generation, improved lead generation and enhanced sales and marketing alignment. This Overall Performance Improvement Across B2B Account Management Department Guidelines PDF is perfect for any presentation, be it in front of clients or colleagues. It is a versatile and stylish solution for organizing your meetings. The product features a modern design for your presentation meetings. The adjustable and customizable slides provide unlimited possibilities for acing up your presentation. Slidegeeks has done all the homework before launching the product for you. So, do not wait, grab the presentation templates today

KPI Dashboard Showing Results Of Content Formulation Clipart PDF
This slide shows the dashboard which can be used by content manager to represent the impact of content development on the website. It includes metrics such as blog visitors, blog first touch, new customers. Showcasing this set of slides titled KPI Dashboard Showing Results Of Content Formulation Clipart PDF. The topics addressed in these templates are Blog Visitors, Blog First Touch, New Customers. All the content presented in this PPT design is completely editable. Download it and make adjustments in color, background, font etc. as per your unique business setting.

KPI Dashboard To Track Content Formulation Performance Microsoft PDF
This slide shows dashboard to which can be used by organizations to measure website performance after content development. It includes metrics such as total page visits, page overview, post summary, etc. Showcasing this set of slides titled KPI Dashboard To Track Content Formulation Performance Microsoft PDF. The topics addressed in these templates are Metric, Post Reach, Page Impressions. All the content presented in this PPT design is completely editable. Download it and make adjustments in color, background, font etc. as per your unique business setting.

Business Executive Financial Performance Report Download PDF
This slide showcase the executive financial summary report which includes the last four quarters EBITDA calculation and major expense budget variance. It includes elements such as cost of services, operating expenses, depreciation, advertisement, marketing etc.depreciation, advertisement, marketing etc. Showcasing this set of slides titled Business Executive Financial Performance Report Download PDF. The topics addressed in these templates are Revenue, Cost Services, Operating Expenses. All the content presented in this PPT design is completely editable. Download it and make adjustments in color, background, font etc. as per your unique business setting.

Business Income And Expense Financial Performance Report Formats PDF
This slide showcases financial summary report of organization in order to analyze amount of expenditure occurred and income generated. It includes elements such as account receivable, account payable current ratio, quick ratio etc. Showcasing this set of slides titled Business Income And Expense Financial Performance Report Formats PDF. The topics addressed in these templates are Net Profit Margin, Accounts Receivable, Accounts Payable. All the content presented in this PPT design is completely editable. Download it and make adjustments in color, background, font etc. as per your unique business setting.
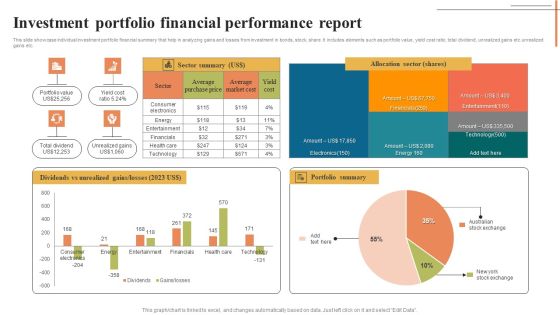
Investment Portfolio Financial Performance Report Pictures PDF
This slide showcase individual investment portfolio financial summary that help in analyzing gains and losses from investment in bonds, stock, share. It includes elements such as portfolio value, yield cost ratio, total dividend, unrealized gains etc.unrealized gains etc. Showcasing this set of slides titled Investment Portfolio Financial Performance Report Pictures PDF. The topics addressed in these templates are Allocation Sector, Portfolio Summary, Dividends. All the content presented in this PPT design is completely editable. Download it and make adjustments in color, background, font etc. as per your unique business setting.
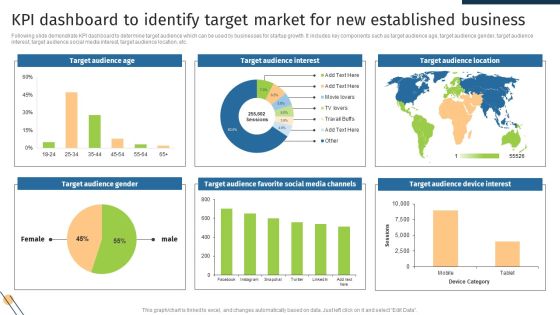
KPI Dashboard To Identify Target Market For New Established Business Formats PDF
Following slide demonstrate KPI dashboard to determine target audience which can be used by businesses for startup growth. It includes key components such as target audience age, target audience gender, target audience interest, target audience social media interest, target audience location, etc. Showcasing this set of slides titled KPI Dashboard To Identify Target Market For New Established Business Formats PDF. The topics addressed in these templates are Target Audience Age, Target Audience Interest, Target Audience Location. All the content presented in this PPT design is completely editable. Download it and make adjustments in color, background, font etc. as per your unique business setting.

KPI Dashboard To Track Best Market Opportunities For New Established Business Pictures PDF
Following slide showcases KPI dashboard to determine best market for launching new business. It includes key components such as growth rate by different industries, best states to launch startup, sales forecast, market growth forecast, projected sales by different states. Showcasing this set of slides titled KPI Dashboard To Track Best Market Opportunities For New Established Business Pictures PDF. The topics addressed in these templates are Forecasted Sales, Growth Rate, Startup Industries. All the content presented in this PPT design is completely editable. Download it and make adjustments in color, background, font etc. as per your unique business setting.

Business Operations Performance Assessment Dashboard Information PDF
This slide presents a dashboard to analyze and monitor business operational activities and gain insights of functional performance. It includes key components such as revenue, sigh ups, visitors, revenue by source, monthly sign ups, top performing agents, etc. Showcasing this set of slides titled Business Operations Performance Assessment Dashboard Information PDF. The topics addressed in these templates are Source, Monthly, Agents. All the content presented in this PPT design is completely editable. Download it and make adjustments in color, background, font etc. as per your unique business setting.
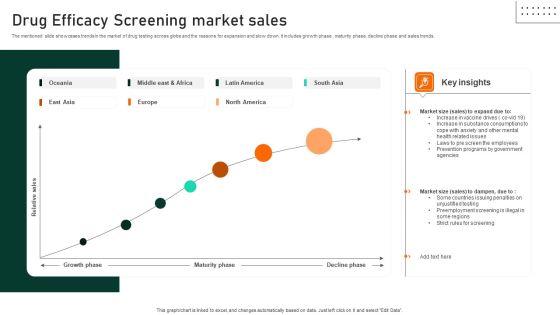
Drug Efficacy Screening Market Sales Portrait PDF
The mentioned slide showcases trends in the market of drug testing across globe and the reasons for expansion and slow down. It includes growth phase , maturity phase, decline phase and sales trends. Showcasing this set of slides titled Drug Efficacy Screening Market Sales Portrait PDF. The topics addressed in these templates are Market Size, Health Related Issues, Increase Vaccine Drives. All the content presented in this PPT design is completely editable. Download it and make adjustments in color, background, font etc. as per your unique business setting.
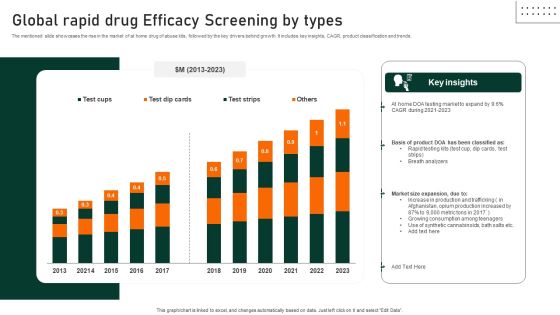
Global Rapid Drug Efficacy Screening By Types Background PDF
The mentioned slide showcases the rise in the market of at home drug of abuse kits, followed by the key drivers behind growth. It includes key insights, CAGR, product classification and trends. Showcasing this set of slides titled Global Rapid Drug Efficacy Screening By Types Background PDF. The topics addressed in these templates are Basis Product, Market Size Expansion, Increase Production. All the content presented in this PPT design is completely editable. Download it and make adjustments in color, background, font etc. as per your unique business setting.
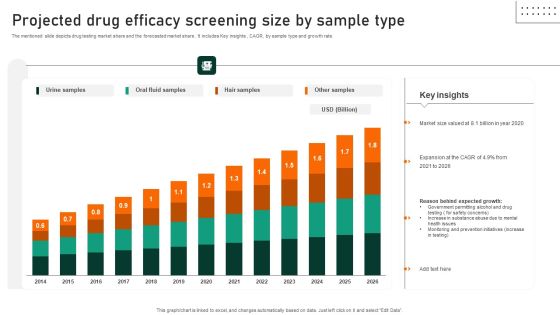
Projected Drug Efficacy Screening Size By Sample Type Portrait PDF
The mentioned slide depicts drug testing market share and the forecasted market share . It includes Key insights , CAGR, by sample type and growth rate. Showcasing this set of slides titled Projected Drug Efficacy Screening Size By Sample Type Portrait PDF. The topics addressed in these templates are Market Size Valued, Reason Behind Expected Growth, Government Permitting. All the content presented in this PPT design is completely editable. Download it and make adjustments in color, background, font etc. as per your unique business setting.

Audience Demographics Document For Social Media Marketing Demonstration PDF
This slide illustrates audience demographics for social media marketing aimed at targeting customer group and their interests for effective promotion. It covers monitoring of fans, page views, total actions, post likes by categorising target audience. Showcasing this set of slides titled Audience Demographics Document For Social Media Marketing Demonstration PDF. The topics addressed in these templates are Audience Growth, Page Views, Total Actions. All the content presented in this PPT design is completely editable. Download it and make adjustments in color, background, font etc. as per your unique business setting.

Dashboard For Monitoring Social Media Platforms Marketing Document Slides PDF
This slide provides marketing report for various social media platforms aimed at displaying data insights in one place using relevant key performance indicators. It covers four platforms with key insights on marketing performance measured by metrics. Showcasing this set of slides titled Dashboard For Monitoring Social Media Platforms Marketing Document Slides PDF. The topics addressed in these templates are Impressions, Engagement, Target. All the content presented in this PPT design is completely editable. Download it and make adjustments in color, background, font etc. as per your unique business setting.

Email Marketing Document With Device Comparison Inspiration PDF
This slide illustrates a dashboard for email marketing aimed at observing performance of emails to drive marketing efforts effectively. It covers number of requests, opens, clicks, and spam reports with device and browser comparison. Showcasing this set of slides titled Email Marketing Document With Device Comparison Inspiration PDF. The topics addressed in these templates are Device Comparison, Requests, Unsubscribes. All the content presented in this PPT design is completely editable. Download it and make adjustments in color, background, font etc. as per your unique business setting.

Dashboard For Tracking Sales Order Processing Rate Inspiration PDF
The following slide showcases sales order fulfilment rate dashboard to measure efficiency of shipping, process and packaging. It includes components such as partially fulfilled orders, pending orders, total number of orders etc. Showcasing this set of slides titled Dashboard For Tracking Sales Order Processing Rate Inspiration PDF. The topics addressed in these templates are Order Fulfilment, Partially Fulfilled, Pending. All the content presented in this PPT design is completely editable. Download it and make adjustments in color, background, font etc. as per your unique business setting.
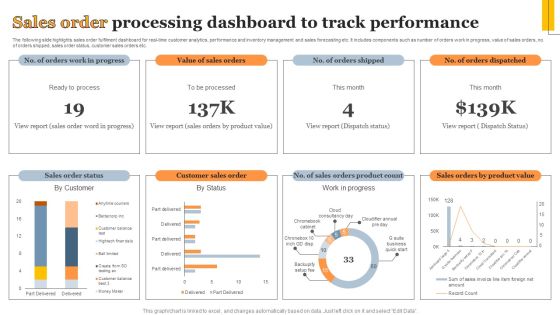
Sales Order Processing Dashboard To Track Performance Information PDF
The following slide highlights sales order fulfilment dashboard for real-time customer analytics, performance and inventory management and sales forecasting etc. It includes components such as number of orders work in progress, value of sales orders, no. of orders shipped, sales order status, customer sales orders etc. Showcasing this set of slides titled Sales Order Processing Dashboard To Track Performance Information PDF. The topics addressed in these templates are Sales Order Status, Customer Sales Order, Work Progress. All the content presented in this PPT design is completely editable. Download it and make adjustments in color, background, font etc. as per your unique business setting.

Business Intelligence And Web Analytics Dashboard To Track Marketing Kpis Inspiration PDF
In this business intelligence dashboard is displayed to help company in real time monitoring and reporting of relevant details. It includes KPIs such as visits, average session duration, bounce rate, page views, traffic sources, etc. Showcasing this set of slides titled Business Intelligence And Web Analytics Dashboard To Track Marketing Kpis Inspiration PDF. The topics addressed in these templates are Goal Conversion, Track Marketing Kpis, Web Analytics Dashboard. All the content presented in this PPT design is completely editable. Download it and make adjustments in color, background, font etc. as per your unique business setting.

Business Intelligence Dashboard For Food And Beverage Industry Diagrams PDF
This slide showcases BI dashboard to track overall performance of business operations. It further includes elements such as sales, total transactions, non labor margin, expenses by category, etc. Pitch your topic with ease and precision using this Business Intelligence Dashboard For Food And Beverage Industry Diagrams PDF. This layout presents information on Expenses, Sales, Business Intelligence Dashboard. It is also available for immediate download and adjustment. So, changes can be made in the color, design, graphics or any other component to create a unique layout.

Business Intelligence Dashboard Showcasing Fleet Management Metrics Elements PDF
This slide showcases BI dashboard to ensure smooth working of shipping and logistics operations. It includes KPIs such as vehicle cost trend, price per unit, fuel consumption, distance, accident, etc. Showcasing this set of slides titled Business Intelligence Dashboard Showcasing Fleet Management Metrics Elements PDF. The topics addressed in these templates are Cost Trend, Price Per Unit Trend, Vehicle Cost Trend. All the content presented in this PPT design is completely editable. Download it and make adjustments in color, background, font etc. as per your unique business setting.

Business Intelligence Dashboard To Monitor Performance Of Retail Business Infographics PDF
The following slide displays BI dashboard for real time tracking of key business financials. It further includes details about scorecard, sales distribution, supply and demand, etc. Pitch your topic with ease and precision using this Business Intelligence Dashboard To Monitor Performance Of Retail Business Infographics PDF. This layout presents information on Business Intelligence Dashboard, Monitor Performance, Retail Business. It is also available for immediate download and adjustment. So, changes can be made in the color, design, graphics or any other component to create a unique layout.

Business Intelligence Dashboard To Review Employee Performance Pictures PDF
The following slide showcases BI dashboard to drill down major aspects of personnel management for HR department. It includes information about absenteeism, training costs, overtime hours and overall labor effectiveness. Showcasing this set of slides titled Business Intelligence Dashboard To Review Employee Performance Pictures PDF. The topics addressed in these templates are Business Intelligence Dashboard, Review Employee Performance. All the content presented in this PPT design is completely editable. Download it and make adjustments in color, background, font etc. as per your unique business setting.

Business Intelligence Dashboard To Track Company Sales Rules PDF
This slide displays BI dashboard to monitor financial health and profitability of the company. It includes metrics such as margin, number of stores, average lead time, store locations, etc. Showcasing this set of slides titled Business Intelligence Dashboard To Track Company Sales Rules PDF. The topics addressed in these templates are Business Intelligence Dashboard, Track Company Sales. All the content presented in this PPT design is completely editable. Download it and make adjustments in color, background, font etc. as per your unique business setting.

Key Company Financials Business Intelligence Dashboard Graphics PDF
This slide showcases business intelligence dashboard to analyze key financial metrics for the organization. It includes information such as current working capital, vendor payment error rate, quick stats, budget variance, etc. Showcasing this set of slides titled Key Company Financials Business Intelligence Dashboard Graphics PDF. The topics addressed in these templates are Key Company Financials, Business Intelligence Dashboard. All the content presented in this PPT design is completely editable. Download it and make adjustments in color, background, font etc. as per your unique business setting.

Procurement Data Analytics And Business Intelligence Dashboard Pictures PDF
This slide showcases BI dashboard to help company in real time tracking of procurement KPIs. It includes information such as defect rate, supplier availability, lead time, etc. Pitch your topic with ease and precision using this Procurement Data Analytics And Business Intelligence Dashboard Pictures PDF. This layout presents information on Procurement Data Analytics, Business Intelligence Dashboard. It is also available for immediate download and adjustment. So, changes can be made in the color, design, graphics or any other component to create a unique layout.
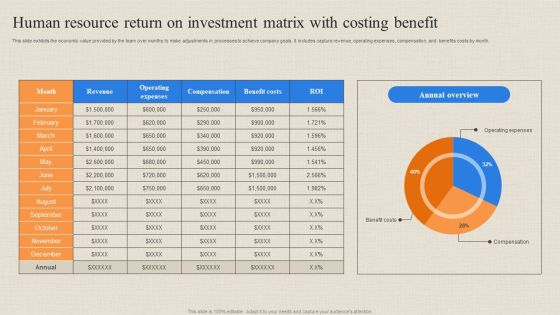
Human Resource Return On Investment Matrix With Costing Benefit Microsoft PDF
This slide exhibits the economic value provided by the team over months to make adjustments in processes to achieve company goals. It includes capture revenue, operating expenses, compensation, and benefits costs by month. Showcasing this set of slides titled Human Resource Return On Investment Matrix With Costing Benefit Microsoft PDF. The topics addressed in these templates are Operating Expenses, Benefit Costs, Revenue. All the content presented in this PPT design is completely editable. Download it and make adjustments in color, background, font etc. as per your unique business setting.

ABC Company Cloud Cost Management Interface Inspiration PDF
This slide shows ABC companys cloud cost optimization dashboard that highlights different areas of spending and savings during a year. It includes yearly investments and yearly savings on different sections like Virtual machines, reserved instances etc. Showcasing this set of slides titled ABC Company Cloud Cost Management Interface Inspiration PDF. The topics addressed in these templates are Yearly Investments ABC Company, Yearly Savings ABC Company, Cumulative Savings. All the content presented in this PPT design is completely editable. Download it and make adjustments in color, background, font etc. as per your unique business setting.
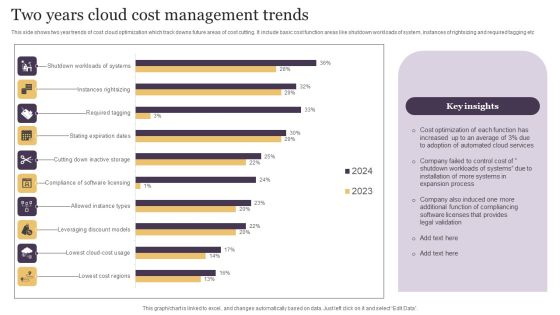
Two Years Cloud Cost Management Trends Portrait PDF
This side shows two year trends of cost cloud optimization which track downs future areas of cost cutting. It include basic cost function areas like shutdown workloads of system, instances of rightsizing and required tagging etc. Showcasing this set of slides titled Two Years Cloud Cost Management Trends Portrait PDF. The topics addressed in these templates are Cost Optimization, Expansion Process, Legal Validation. All the content presented in this PPT design is completely editable. Download it and make adjustments in color, background, font etc. as per your unique business setting.

Impact Of Product Corporate Diversification In Improving Business Performance Infographics PDF
This slide shows impact of product corporate diversification on business performance with various key performance indicators. It includes quality, productivity, profitability, market share, brand recognition etc. Showcasing this set of slides titled Impact Of Product Corporate Diversification In Improving Business Performance Infographics PDF. The topics addressed in these templates are Product Transportation Costs, Product Quality, Market Segments. All the content presented in this PPT design is completely editable. Download it and make adjustments in color, background, font etc. as per your unique business setting.
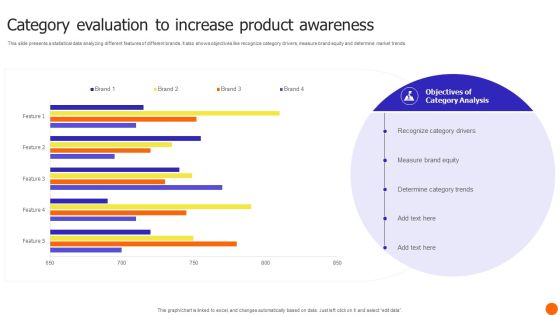
Category Evaluation To Increase Product Awareness Template PDF
This slide presents a statistical data analyzing different features of different brands. It also shows objectives like recognize category drivers, measure brand equity and determine market trends. Showcasing this set of slides titled Category Evaluation To Increase Product Awareness Template PDF. The topics addressed in these templates are Determine Category Trends, Measure Brand Equity, Recognize Category Drivers. All the content presented in this PPT design is completely editable. Download it and make adjustments in color, background, font etc. as per your unique business setting.

B2B Content Advertising Campaign Impact On Business Growth Sample PDF
Following slide demonstrates content marketing campaign impact on b2b company performance. It includes performance areas such as improved business awareness, lead generation, improve customer loyalty, increase sales, etc. Pitch your topic with ease and precision using this B2B Content Advertising Campaign Impact On Business Growth Sample PDF. This layout presents information on Key Insights, Growth, Marketing . It is also available for immediate download and adjustment. So, changes can be made in the color, design, graphics or any other component to create a unique layout.
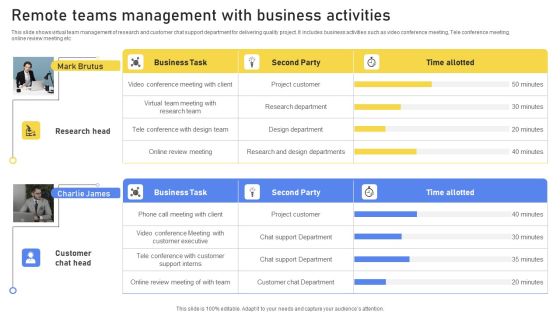
Remote Teams Management With Business Activities Graphics PDF
This slide shows virtual team management of research and customer chat support department for delivering quality project. It includes business activities such as video conference meeting, Tele conference meeting, online review meeting etc. Showcasing this set of slides titled Remote Teams Management With Business Activities Graphics PDF. The topics addressed in these templates are Research Head, Customer Chat Head, Business Task. All the content presented in this PPT design is completely editable. Download it and make adjustments in color, background, font etc. as per your unique business setting.
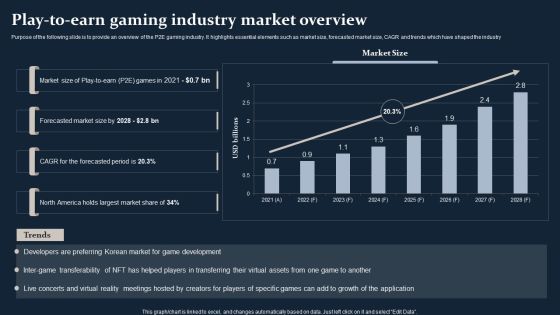
Smartphone Game Development And Advertising Technique Play To Earn Gaming Industry Market Overview Themes PDF
This Smartphone Game Development And Advertising Technique Play To Earn Gaming Industry Market Overview Themes PDF is perfect for any presentation, be it in front of clients or colleagues. It is a versatile and stylish solution for organizing your meetings. The Smartphone Game Development And Advertising Technique Play To Earn Gaming Industry Market Overview Themes PDF features a modern design for your presentation meetings. The adjustable and customizable slides provide unlimited possibilities for acing up your presentation. Slidegeeks has done all the homework before launching the product for you. So, do not wait, grab the presentation templates today

Chat Messenger Investor Funding Elevator Pitch Deck Key Facts Clipart PDF
The slide mentions the key statistic related to the company including the number of messages processed per month, percent of messages in sticker form and organic downloads. This Chat Messenger Investor Funding Elevator Pitch Deck Key Facts Clipart PDF is perfect for any presentation, be it in front of clients or colleagues. It is a versatile and stylish solution for organizing your meetings. The product features a modern design for your presentation meetings. The adjustable and customizable slides provide unlimited possibilities for acing up your presentation. Slidegeeks has done all the homework before launching the product for you. So, do not wait, grab the presentation templates today
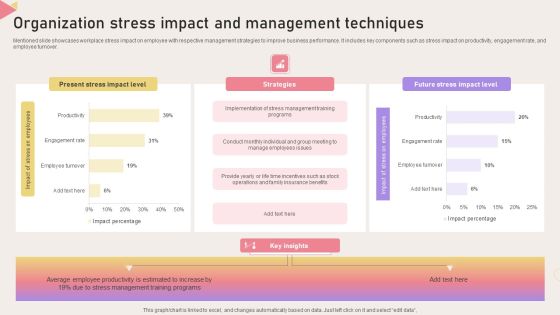
Organization Stress Impact And Management Techniques Sample PDF
Mentioned slide showcases workplace stress impact on employee with respective management strategies to improve business performance. It includes key components such as stress impact on productivity, engagement rate, and employee turnover. Pitch your topic with ease and precision using this Organization Stress Impact And Management Techniques Sample PDF. This layout presents information on Strategies, Impact Level, Technique. It is also available for immediate download and adjustment. So, changes can be made in the color, design, graphics or any other component to create a unique layout.

Audio Centric Firm Capital Raising Pitch Deck Revenue Streams Background PDF
This slide provides an overview of the channels from where the firm generated revenue. Main revenue streams of a podcast company covered are subscriptions, merchandise, affiliate sales and sponsorships. This Audio Centric Firm Capital Raising Pitch Deck Revenue Streams Background PDF is perfect for any presentation, be it in front of clients or colleagues. It is a versatile and stylish solution for organizing your meetings. The product features a modern design for your presentation meetings. The adjustable and customizable slides provide unlimited possibilities for acing up your presentation. Slidegeeks has done all the homework before launching the product for you. So, do not wait, grab the presentation templates today


 Continue with Email

 Home
Home


