Program Components

Patient Health And Risk Key Performance Indicator Dashboard Ppt Infographic Template Summary PDF
The following slide highlights the patient health and safety key performance indicator dashboard illustrating admission by department, admission by cost, patient satisfaction, total patients, operations cost, patient density, total staff, waiting time, treatment satisfaction and treatment confidence. Pitch your topic with ease and precision using this Patient Health And Risk Key Performance Indicator Dashboard Ppt Infographic Template Summary PDF. This layout presents information on Admission By Department, Admission Vs Cost, Patient Satisfaction. It is also available for immediate download and adjustment. So, changes can be made in the color, design, graphics or any other component to create a unique layout.

Metrics To Manage Company Cash Flow Ppt Model Gridlines PDF
This slide showcases key metrics used by organizations to manage cashflow. The key performance indicators included are days, receivable, inventory and payable outstanding. Pitch your topic with ease and precision using this Metrics To Manage Company Cash Flow Ppt Model Gridlines PDF. This layout presents information on Days Receivable Outstanding, Days Inventory Outstanding, Days Payable Outstanding. It is also available for immediate download and adjustment. So, changes can be made in the color, design, graphics or any other component to create a unique layout.
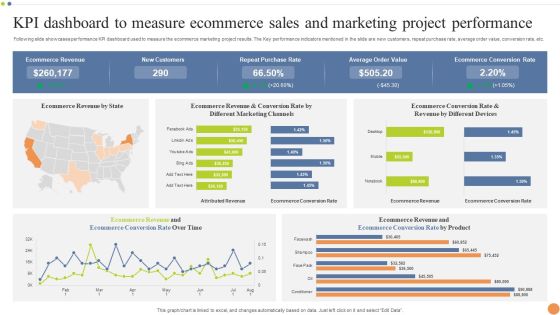
KPI Dashboard To Measure Ecommerce Sales And Marketing Project Performance Portrait PDF
Following slide showcases performance KPI dashboard used to measure the ecommerce marketing project results. The Key performance indicators mentioned in the slide are new customers, repeat purchase rate, average order value, conversion rate, etc. Pitch your topic with ease and precision using this KPI Dashboard To Measure Ecommerce Sales And Marketing Project Performance Portrait PDF. This layout presents information on Purchase Rate, Average Order Value, Ecommerce Conversion Rate. It is also available for immediate download and adjustment. So, changes can be made in the color, design, graphics or any other component to create a unique layout.
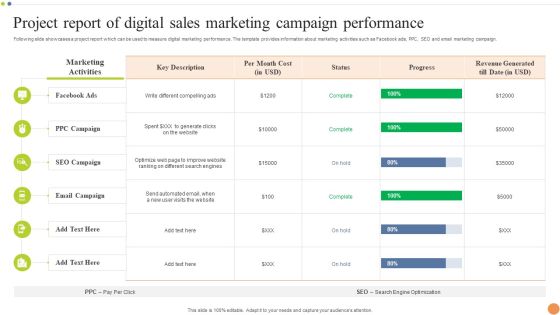
Project Report Of Digital Sales Marketing Campaign Performance Professional PDF
Following slide showcases a project report which can be used to measure digital marketing performance. The template provides information about marketing activities such as Facebook ads, PPC, SEO and email marketing campaign. Pitch your topic with ease and precision using this Project Report Of Digital Sales Marketing Campaign Performance Professional PDF. This layout presents information on Email Campaign, SEO Campaign, Marketing Activities. It is also available for immediate download and adjustment. So, changes can be made in the color, design, graphics or any other component to create a unique layout.
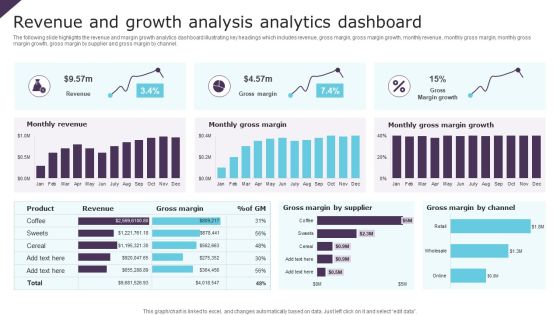
Revenue And Growth Analysis Analytics Dashboard Ppt Infographic Template Brochure PDF
The following slide highlights the revenue and margin growth analytics dashboard illustrating key headings which includes revenue, gross margin, gross margin growth, monthly revenue, monthly gross margin, monthly gross margin growth, gross margin by supplier and gross margin by channel. Pitch your topic with ease and precision using this Revenue And Growth Analysis Analytics Dashboard Ppt Infographic Template Brochure PDF. This layout presents information on Monthly Revenue, Monthly Gross Margin, Gross Margin Growth. It is also available for immediate download and adjustment. So, changes can be made in the color, design, graphics or any other component to create a unique layout.

Workforce Compensation And Salary Dashboard Brochure PDF
The following slide showcases compensation dashboard that highlights regular payroll tasks. The dashboard includes number of workforce, departments, average performance and sick days, headcount, salary breakdown and number of employees by salary. Pitch your topic with ease and precision using this Workforce Compensation And Salary Dashboard Brochure PDF. This layout presents information on Workforce Compensation, Salary Dashboard. It is also available for immediate download and adjustment. So, changes can be made in the color, design, graphics or any other component to create a unique layout.

Personnel Management Dashboard With Salary And Overtime Data Ideas PDF
The following slide highlights the payroll management dashboard with salary and overtime data illustrating key headings which includes employee cost, average salary, overtime per day, Average base salary and average overtime cost. Pitch your topic with ease and precision using this Personnel Management Dashboard With Salary And Overtime Data Ideas PDF. This layout presents information on Average, Customer Service, Cost. It is also available for immediate download and adjustment. So, changes can be made in the color, design, graphics or any other component to create a unique layout.
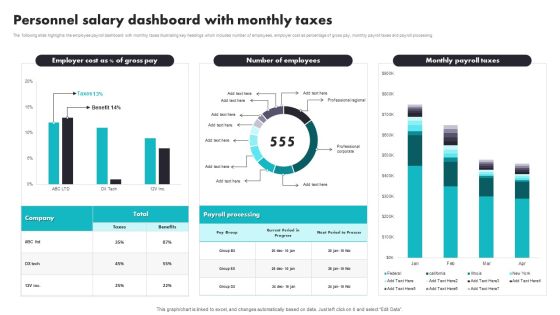
Personnel Salary Dashboard With Monthly Taxes Introduction PDF
The following slide highlights the employee payroll dashboard with monthly taxes illustrating key headings which includes number of employees, employer cost as percentage of gross pay, monthly payroll taxes and payroll processing. Pitch your topic with ease and precision using this Personnel Salary Dashboard With Monthly Taxes Introduction PDF. This layout presents information on Payroll Processing, Benefits. It is also available for immediate download and adjustment. So, changes can be made in the color, design, graphics or any other component to create a unique layout.

Personnel Salary Summary Dashboard With EPF And ESI Data Brochure PDF
The following highlights the slide employee payroll summary dashboard with EPF and ESI data illustrating key headings which includes payroll period, tasks to do, payroll deductions, employee summary and payroll cost. Pitch your topic with ease and precision using this Personnel Salary Summary Dashboard With EPF And ESI Data Brochure PDF. This layout presents information on Employee Provident Fund, Employee State Insurance, Tax Deducted At Source. It is also available for immediate download and adjustment. So, changes can be made in the color, design, graphics or any other component to create a unique layout.

Customer Service Delivery And Management Dashboard With Revenue Brochure PDF
The purpose of this slide is to monitor and evaluate service delivery KPIs to improve the customer support process. The major KPIs included are total requests, percentage of requests answered, total revenue, and support cost. Pitch your topic with ease and precision using this Customer Service Delivery And Management Dashboard With Revenue Brochure PDF. This layout presents information on Customer Service Delivery, Management Dashboard With Revenue. It is also available for immediate download and adjustment. So, changes can be made in the color, design, graphics or any other component to create a unique layout.

Retail Inventory Management Kpi Dashboard Rules PDF
This slide gives overview of inventory management in retail industry showcasing expected date of order placed for top selling item, sales return by product category, average inventory value in FY 2022 and purchase order summary. Pitch your topic with ease and precision using this Retail Inventory Management Kpi Dashboard Rules PDF. This layout presents information on Retail Inventory Management, Dashboard. It is also available for immediate download and adjustment. So, changes can be made in the color, design, graphics or any other component to create a unique layout.

Dashboard Showing Digital Marketing Campaign Report Ppt Infographic Template Template PDF
This slide represents the campaign report of digital marketing which includes total spend , impressions , clicks , acquisitions, cost per action that results in analyzing marketing efforts to improve market share of business. Pitch your topic with ease and precision using this Dashboard Showing Digital Marketing Campaign Report Ppt Infographic Template Template PDF. This layout presents information on Customer Acquisition, Total Impressions, Total Clicks, Total Acquisition. It is also available for immediate download and adjustment. So, changes can be made in the color, design, graphics or any other component to create a unique layout.

You Tube Advertising Influence Survey On Different Age Groups Ppt Diagram Ppt PDF
This slide represents the survey conducted by an organization in order to study the influence or effect which the you tube marketing has on various age groups of the country. Pitch your topic with ease and precision using this You Tube Advertising Influence Survey On Different Age Groups Ppt Diagram Ppt PDF. This layout presents information on Larger Influence, You Tube Marketing, Young Generation. It is also available for immediate download and adjustment. So, changes can be made in the color, design, graphics or any other component to create a unique layout.
Effect Of Pandemic On Education By Global School Closures Icons PDF
The slide illustrates the impact of COVID-19 on schools worldwide to estimate the educational loss to learners. The data included is the number of learners impacted by COVID from march 25 to april 30, 2020. Pitch your topic with ease and precision using this Effect Of Pandemic On Education By Global School Closures Icons PDF. This layout presents information on Total Estimated, Localized Level Educational, Institutions Closure. It is also available for immediate download and adjustment. So, changes can be made in the color, design, graphics or any other component to create a unique layout.

Effect Of Pandemic On Remote Education Learning Platforms Sample PDF
The slide contains various remote learning platforms used by different income-level groups to face COVID effects. Various platforms included are online and broadcasts, television, radio, etc. Pitch your topic with ease and precision using this Effect Of Pandemic On Remote Education Learning Platforms Sample PDF. This layout presents information on Pandemic Situation, High Income Level, Technical Platforms. It is also available for immediate download and adjustment. So, changes can be made in the color, design, graphics or any other component to create a unique layout.

Research Team Members Performance Evaluation Summary Portrait PDF
This slide shows the report prepared by the director of research team of an organization in order to evaluate the performance of his team members which would help him in taking decision regarding their promotion to higher positions. Pitch your topic with ease and precision using this Research Team Members Performance Evaluation Summary Portrait PDF. This layout presents information on Research Team Members, Performance Evaluation Summary. It is also available for immediate download and adjustment. So, changes can be made in the color, design, graphics or any other component to create a unique layout.

Category Wise Operation Expenses Of The Company Topics PDF
This slide displays the division of operating expenses that a company is incurring in the three financial years 2020,2021 and 2022 to compare the different expense on multiple steps.Pitch your topic with ease and precision using this Category Wise Operation Expenses Of The Company Topics PDF. This layout presents information on Travelling Expenses, Increased Restrictions, Relaxation. It is also available for immediate download and adjustment. So, changes can be made in the color, design, graphics or any other component to create a unique layout.

Graph Showing Total Operation Expenses By Quarter Themes PDF
This slide contains a graph showing the quarter wise operating expenses of an organization that will help the managers or directors of the company to make decisions for the betterment of an organization.Pitch your topic with ease and precision using this Graph Showing Total Operation Expenses By Quarter Themes PDF. This layout presents information on Operating Expenses, Equipment Purchase, Office Expansion. It is also available for immediate download and adjustment. So, changes can be made in the color, design, graphics or any other component to create a unique layout.
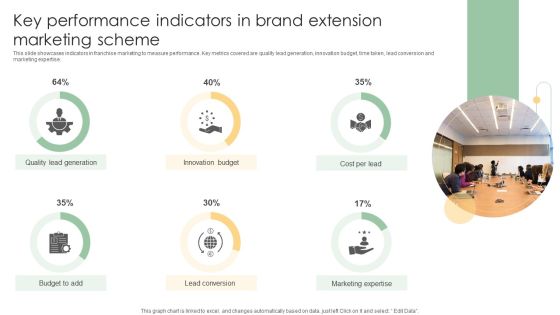
Key Performance Indicators In Brand Extension Marketing Scheme Ideas PDF
This slide showcases indicators in franchise marketing to measure performance. Key metrics covered are quality lead generation, innovation budget, time taken, lead conversion and marketing expertise.Pitch your topic with ease and precision using this Key Performance Indicators In Brand Extension Marketing Scheme Ideas PDF. This layout presents information on Quality Lead Generation, Innovation Budget, Lead Conversion. It is also available for immediate download and adjustment. So, changes can be made in the color, design, graphics or any other component to create a unique layout.
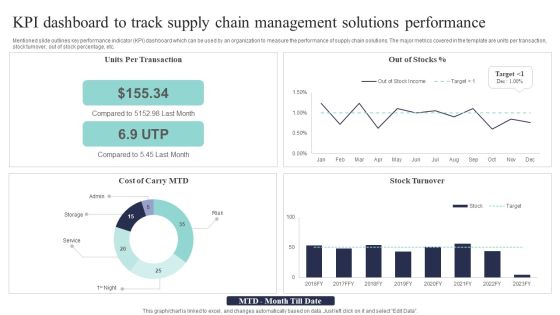
KPI Dashboard To Track Supply Chain Management Solutions Performance Background PDF
Mentioned slide outlines key performance indicator KPI dashboard which can be used by an organization to measure the performance of supply chain solutions. The major metrics covered in the template are units per transaction, stock turnover, out of stock percentage, etc. Pitch your topic with ease and precision using this KPI Dashboard To Track Supply Chain Management Solutions Performance Background PDF. This layout presents information on Per Transaction, Compared Last, Stock Turnover. It is also available for immediate download and adjustment. So, changes can be made in the color, design, graphics or any other component to create a unique layout.

Employee Performance Assessment Comparative Survey Ideas PDF
The given slide highlights the outcome of a skill assessment survey of employees from two different departments Research and Technical. The various skills include team-working, analytical reasoning, complex problem solving, and decision making along with key insights. Pitch your topic with ease and precision using this Employee Performance Assessment Comparative Survey Ideas PDF. This layout presents information on Agility And Adaptability, Team, Research Department. It is also available for immediate download and adjustment. So, changes can be made in the color, design, graphics or any other component to create a unique layout.

Plant Safety Measures Dashboard With Incidents Work Accidents And Near Misses Template PDF
This slide showcases dashboard to monitor plant safety measures performance indicators. Key metrics covered are incident and injury type, root cause, location, contributing factor, employees at risk and investigation. Pitch your topic with ease and precision using this Plant Safety Measures Dashboard With Incidents Work Accidents And Near Misses Template PDF. This layout presents information on Plant Safety Measures Dashboard, Incidents Work Accidents. It is also available for immediate download and adjustment. So, changes can be made in the color, design, graphics or any other component to create a unique layout.
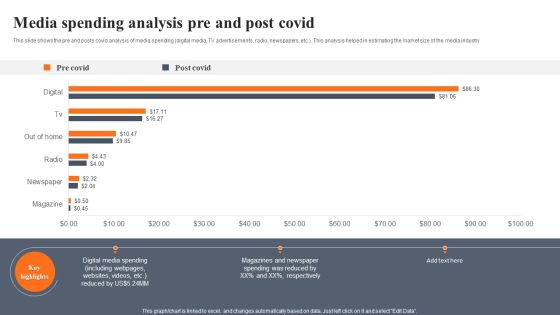
Media Spending Analysis Pre And Post Covid Elements PDF
This slide shows the pre and posts covid analysis of media spending digital media, TV advertisements, radio, newspapers, etc. This analysis helped in estimating the market size of the media industry. Pitch your topic with ease and precision using this Media Spending Analysis Pre And Post Covid Elements PDF. This layout presents information on Media Spending Analysis, Pre And Post Covid. It is also available for immediate download and adjustment. So, changes can be made in the color, design, graphics or any other component to create a unique layout.

Content Gap Analysis For E Commerce Staff Skills Icons PDF
The slide inculcates gap analysis for content team to formulate effective ,marketing strategies for e commerce business. Various types of content included are audio content, email content, blog content, case study, etc. Pitch your topic with ease and precision using this Content Gap Analysis For E Commerce Staff Skills Icons PDF. This layout presents information on Audio Content, Email Content, Blog Content. It is also available for immediate download and adjustment. So, changes can be made in the color, design, graphics or any other component to create a unique layout.
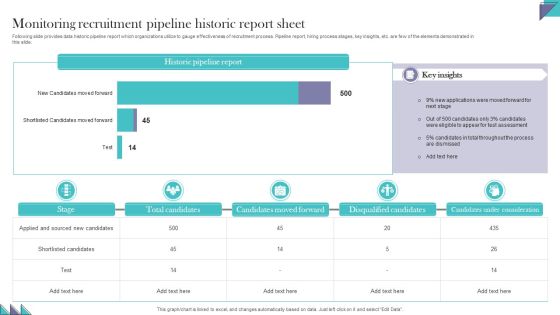
Monitoring Recruitment Pipeline Historic Report Sheet Pictures PDF
Following slide provides data historic pipeline report which organizations utilize to gauge effectiveness of recruitment process. Pipeline report, hiring process stages, key insights, etc. are few of the elements demonstrated in this slide. Pitch your topic with ease and precision using this Monitoring Recruitment Pipeline Historic Report Sheet Pictures PDF. This layout presents information on Candidates Moved Forward, Disqualified Candidates, Candidates Under Consideration. It is also available for immediate download and adjustment. So, changes can be made in the color, design, graphics or any other component to create a unique layout
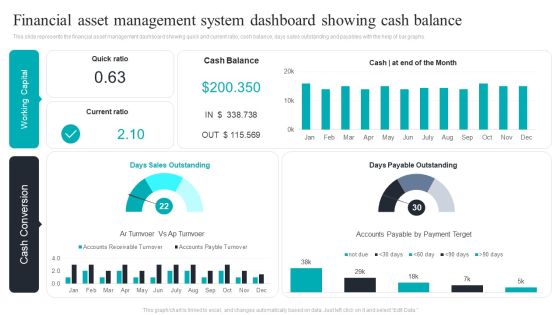
Financial Asset Management System Dashboard Showing Cash Balance Download PDF
This slide represents the financial asset management dashboard showing quick and current ratio, cash balance, days sales outstanding and payables with the help of bar graphs. Pitch your topic with ease and precision using this Financial Asset Management System Dashboard Showing Cash Balance Download PDF. This layout presents information on Financial Asset, Management System, Dashboard Showing, Cash Balance. It is also available for immediate download and adjustment. So, changes can be made in the color, design, graphics or any other component to create a unique layout.
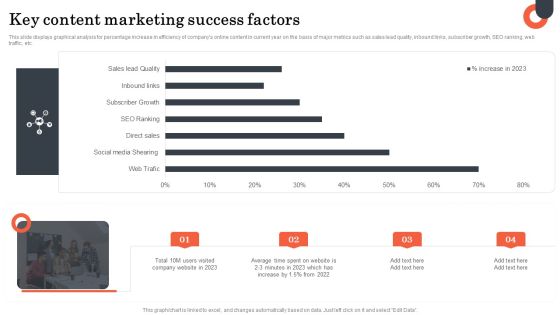
Key Content Marketing Success Factors Microsoft PDF
This slide displays graphical analysis for percentage increase in efficiency of companys online content in current year on the basis of major metrics such as sales lead quality, inbound links, subscriber growth, SEO ranking, web traffic, etc. Pitch your topic with ease and precision using this Key Content Marketing Success Factors Microsoft PDF. This layout presents information on Key Content, Marketing Success Factors. It is also available for immediate download and adjustment. So, changes can be made in the color, design, graphics or any other component to create a unique layout.
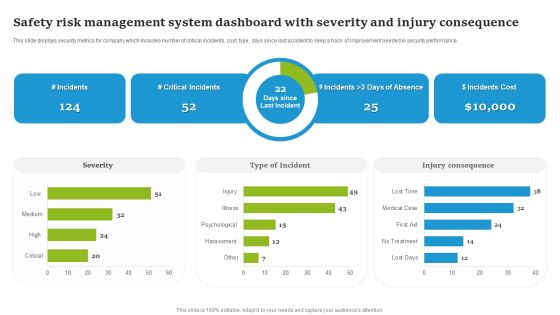
Safety Risk Management System Dashboard With Severity And Injury Consequence Clipart PDF
This slide displays security metrics for company which includes number of critical incidents, cost, type, days since last accident to keep a track of Improvement needed in security performance. Pitch your topic with ease and precision using this Safety Risk Management System Dashboard With Severity And Injury Consequence Clipart PDF. This layout presents information on Severity, Type Of Incident, Injury Consequence . It is also available for immediate download and adjustment. So, changes can be made in the color, design, graphics or any other component to create a unique layout.

Project Stakeholders Management Strategy And Dashboard Sample PDF
This slide showcases analytics for stakeholders for various business operations such as developing pricing strategy, new user sign up, analytics, product subscription improvement, etc. to track overall status of engagement and responsibility at various levels. Pitch your topic with ease and precision using this Project Stakeholders Management Strategy And Dashboard Sample PDF. This layout presents information on Pricing Strategy, Product Subscription Improvement. It is also available for immediate download and adjustment. So, changes can be made in the color, design, graphics or any other component to create a unique layout.

Stakeholders Management Strategy With Engagement Dashboard Infographics PDF
The following slide displays key parameters to map involvement of stakeholders in the business by analyzing them on the basis of influence, interest and impact to monitor and improve overall communication strategies of organization. Pitch your topic with ease and precision using this Stakeholders Management Strategy With Engagement Dashboard Infographics PDF. This layout presents information on Influence, Interest, Impact. It is also available for immediate download and adjustment. So, changes can be made in the color, design, graphics or any other component to create a unique layout.

Coronavirus Update On Most Administered Vaccine Throughout Globe Mockup PDF
This slide demonstrates most preferred type of vaccines among countries and territories which assist them in providing immunity against coronavirus. This slide includes information about most to least administered vaccines across world. Pitch your topic with ease and precision using this Coronavirus Update On Most Administered Vaccine Throughout Globe Mockup PDF. This layout presents information on Coronavirus Update, Most Administered Vaccine. It is also available for immediate download and adjustment. So, changes can be made in the color, design, graphics or any other component to create a unique layout.

Batch Processing KPI Metrics Dashboard With Rejection Rate Topics PDF
Mentioned slide highlights performance KPI dashboard of batch processing system. The KPIs covered in the slide are batch rejection rate by product, number of reprocessed lots, rejection by product and reasons for the rejection. Pitch your topic with ease and precision using this Batch Processing KPI Metrics Dashboard With Rejection Rate Topics PDF. This layout presents information on Batch Processing KPI Metrics, Dashboard Rejection Rate. It is also available for immediate download and adjustment. So, changes can be made in the color, design, graphics or any other component to create a unique layout.
KPI Dashboard For Tracking Commercial Banking And Financial Activities Download PDF
This slide depicts a dashboard for tracking the banking and financial activities of a business enterprise to measure the income and expenses. The key performing indicators are business accounts, paid, pending and cancelled transactions etc. Pitch your topic with ease and precision using this KPI Dashboard For Tracking Commercial Banking And Financial Activities Download PDF. This layout presents information on KPI Dashboard, Tracking Commercial Banking, Financial Activities. It is also available for immediate download and adjustment. So, changes can be made in the color, design, graphics or any other component to create a unique layout.

Email Marketing Digital Promotion Success Evaluation Dashboard Sample PDF
The slide demonstrates a dashboard to evaluate the success of marketing campaign for updating the strategies. Various KPIs included are average open rate per month, average click-through rate per month, average revenue on email per month, etc. Pitch your topic with ease and precision using this Email Marketing Digital Promotion Success Evaluation Dashboard Sample PDF. This layout presents information on Open Rate Per Month, Order Placed Per Month. It is also available for immediate download and adjustment. So, changes can be made in the color, design, graphics or any other component to create a unique layout.
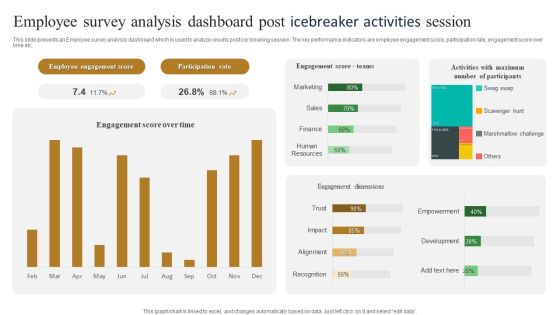
Employee Survey Analysis Dashboard Post Icebreaker Activities Session Slides PDF
This slide presents an Employee survey analysis dashboard which is used to analyze results post ice breaking session. The key performance indicators are employee engagement score, participation rate, engagement score over time etc. Pitch your topic with ease and precision using this Employee Survey Analysis Dashboard Post Icebreaker Activities Session Slides PDF. This layout presents information on Participation Rate, Employee Engagement Score. It is also available for immediate download and adjustment. So, changes can be made in the color, design, graphics or any other component to create a unique layout.

Dashboard To Depict Robot Utilization In Robotic Desktop Automation Download PDF
This slide consists of a Dashboard which can be used by managers to depict robot utilization in attended automation. Key performance indicators relate to total utilization, robot types, hours saved etc. Pitch your topic with ease and precision using this Dashboard To Depict Robot Utilization In Robotic Desktop Automation Download PDF. This layout presents information on Dashboard, Depict Robot Utilization, Robotic Desktop Automation. It is also available for immediate download and adjustment. So, changes can be made in the color, design, graphics or any other component to create a unique layout.

Revenue Statistics Of Multi Channel Marketing Strategies Microsoft PDF
This slide covers survey results of revenue generated from various communication channels. The purpose of this is to compare different communications channels based on revenue generated from them. The various channels are referrals, SEO, content marketing, outbound calling, paid search.Pitch your topic with ease and precision using this Revenue Statistics Of Multi Channel Marketing Strategies Microsoft PDF. This layout presents information on Referrals Marketing, Creates Maximum, Generates Leads. It is also available for immediate download and adjustment. So, changes can be made in the color, design, graphics or any other component to create a unique layout.

Traditional Multi Channel Marketing Strategies Budget Allocation Diagrams PDF
This slide covers budget allocation of communication channels for offline marketing. The purpose of this is to spend most on that channel that has the high conversion rate and customer reach. The different channels are phone calls, face to face meetings, direct mail, networking etc. Pitch your topic with ease and precision using this Traditional Multi Channel Marketing Strategies Budget Allocation Diagrams PDF. This layout presents information on Communication Channel, Budget Percentage, Speaking Engagements. It is also available for immediate download and adjustment. So, changes can be made in the color, design, graphics or any other component to create a unique layout.

Healthcare Employees Dashboard With Patient Satisfaction Mockup PDF
The following slide outlines KPI dashboard of healthcare workforce. The KPIs highlighted in the template are total patients, average treatment costs, average ER waiting time, available staff, patients by division, outpatients vs inpatients trend etc.Pitch your topic with ease and precision using this Healthcare Employees Dashboard With Patient Satisfaction Mockup PDF. This layout presents information on Patient Satisfaction, Outpatients Inpatients Trend, Doctor Understand. It is also available for immediate download and adjustment. So, changes can be made in the color, design, graphics or any other component to create a unique layout.
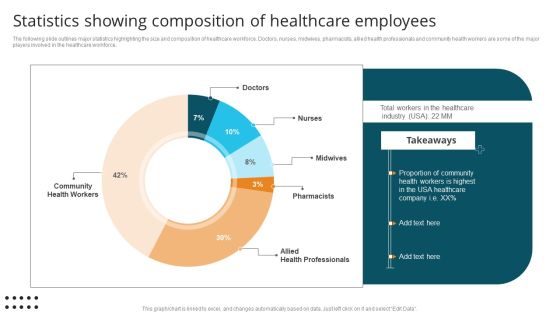
Statistics Showing Composition Of Healthcare Employees Themes PDF
The following slide outlines major statistics highlighting the size and composition of healthcare workforce. Doctors, nurses, midwives, pharmacists, allied health professionals and community health workers are some of the major players involved in the healthcare workforce. Pitch your topic with ease and precision using this Statistics Showing Composition Of Healthcare Employees Themes PDF. This layout presents information on Workers Healthcare, Proportion Community, Health Workers Highest. It is also available for immediate download and adjustment. So, changes can be made in the color, design, graphics or any other component to create a unique layout.
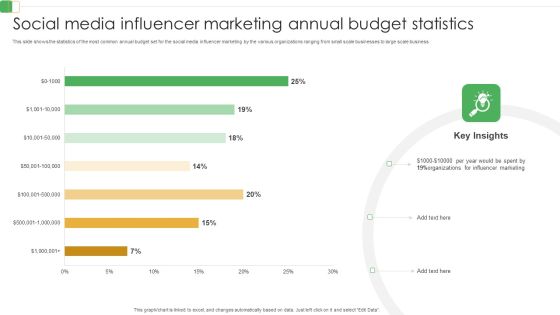
Social Media Influencer Marketing Annual Budget Statistics Ppt PowerPoint Presentation File Professional PDF
This slide shows the statistics of the most common annual budget set for the social media influencer marketing by the various organizations ranging from small scale businesses to large scale business. Pitch your topic with ease and precision using this Social Media Influencer Marketing Annual Budget Statistics Ppt PowerPoint Presentation File Professional PDF. This layout presents information on Social Media, Influencer Marketing, Annual Budget Statistics. It is also available for immediate download and adjustment. So, changes can be made in the color, design, graphics or any other component to create a unique layout.
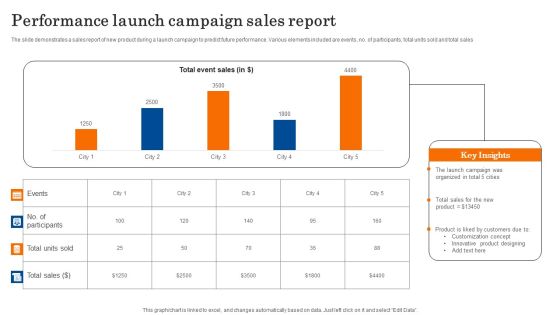
Performance Launch Campaign Sales Report Demonstration PDF
The slide demonstrates a sales report of new product during a launch campaign to predict future performance. Various elements included are events, no. of participants, total units sold and total sales. Pitch your topic with ease and precision using this Performance Launch Campaign Sales Report Demonstration PDF. This layout presents information on Sales, Product, Customization Concept. It is also available for immediate download and adjustment. So, changes can be made in the color, design, graphics or any other component to create a unique layout.
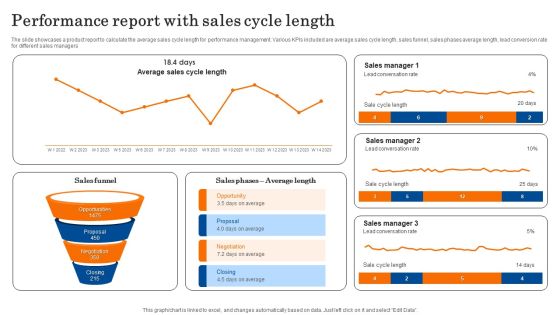
Performance Report With Sales Cycle Length Template PDF
The slide showcases a product report to calculate the average sales cycle length for performance management. Various KPIs included are average sales cycle length, sales funnel, sales phases average length, lead conversion rate for different sales managers. sPitch your topic with ease and precision using this Performance Report With Sales Cycle Length Template PDF. This layout presents information on Sales Manager, Conversation Rate, Opportunity. It is also available for immediate download and adjustment. So, changes can be made in the color, design, graphics or any other component to create a unique layout.

KPI Dashboard To Monitor Real Time Issues In Logistics Chain Rules PDF
This slide presents a dashboard which can be used by suppliers to monitor any issues taking place in the supply chain and take timely steps for improvement. The key performing indicators are activities due, issue severity, issues unassigned, issues under inspection etc. Pitch your topic with ease and precision using this KPI Dashboard To Monitor Real Time Issues In Logistics Chain Rules PDF. This layout presents information on Activities Due, Issues By Severity, Issues Rejected, Inspection Status. It is also available for immediate download and adjustment. So, changes can be made in the color, design, graphics or any other component to create a unique layout.

Dashboard To Monitor SEO Cost For Generating Website Traffic Management Slides PDF
This slide showcases dashboard that monitors cost associated with SEO services. Key cost elements included here are monthly spends on Google ads, Facebook ads, Instagram publicity, leads generated from each channel and cost per lead etc. Pitch your topic with ease and precision using this Dashboard To Monitor SEO Cost For Generating Website Traffic Management Slides PDF. This layout presents information on Google Ads, Conversions, Cost Per Conversion. It is also available for immediate download and adjustment. So, changes can be made in the color, design, graphics or any other component to create a unique layout.
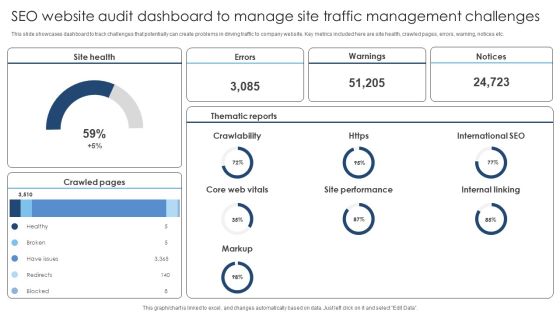
SEO Website Audit Dashboard To Manage Site Traffic Management Challenges Summary PDF
This slide showcases dashboard to track challenges that potentially can create problems in driving traffic to company website. Key metrics included here are site health, crawled pages, errors, warning, notices etc. Pitch your topic with ease and precision using this SEO Website Audit Dashboard To Manage Site Traffic Management Challenges Summary PDF. This layout presents information on Site Health, Errors, Warnings. It is also available for immediate download and adjustment. So, changes can be made in the color, design, graphics or any other component to create a unique layout.

Actual Time Marketing Challenges In Using Social Data Ppt PowerPoint Presentation Icon Infographics PDF
The slide inculcates a survey highlighting various barriers in real-time marketing for using social data to increase customer engagement. Various challenges included are inadequate budget, inappropriate skills, limited search analytical tools, etc. Pitch your topic with ease and precision using this Actual Time Marketing Challenges In Using Social Data Ppt PowerPoint Presentation Icon Infographics PDF. This layout presents information on Inadequate Budget, Inappropriate Skills, Limited Staff Abilities, Quick Responses. It is also available for immediate download and adjustment. So, changes can be made in the color, design, graphics or any other component to create a unique layout.
Yearly Status Report For Average Customer Effort Score Assessment Ppt Icon Layout Ideas PDF
The slide carries a summary report to assess average CES for predicting the customer behaviour and purchasing habits. Various elements included are average rating, yearly graphs and key takeaways. Pitch your topic with ease and precision using this Yearly Status Report For Average Customer Effort Score Assessment Ppt Icon Layout Ideas PDF. This layout presents information on Good Customer Experience, Easy To Purchase, Processes, Increase Churn Rate. It is also available for immediate download and adjustment. So, changes can be made in the color, design, graphics or any other component to create a unique layout.
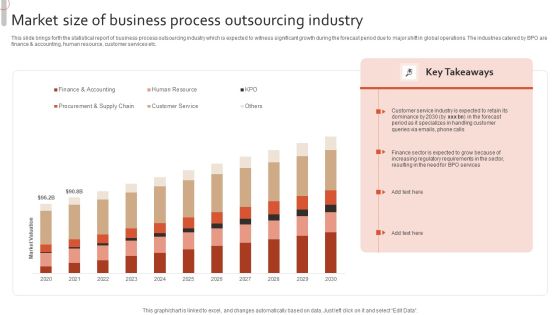
Market Size Of Business Process Outsourcing Industry Structure PDF
This slide brings forth the statistical report of business process outsourcing industry which is expected to witness significant growth during the forecast period due to major shift in global operations. The industries catered by BPO are finance and accounting, human resource, customer services etc. Pitch your topic with ease and precision using this Market Size Of Business Process Outsourcing Industry Structure PDF. This layout presents information on Customer Service, Phone Calls, Queries Via Emails. It is also available for immediate download and adjustment. So, changes can be made in the color, design, graphics or any other component to create a unique layout.

Virtual Customer Healthcare Trends Among Different Generations Professional PDF
The below slide depicts the consumer trends in healthcare industry. The graph includes the data for the past two years comparing the percentage of change in the virtual visits among different generations. Pitch your topic with ease and precision using this Virtual Customer Healthcare Trends Among Different Generations Professional PDF. This layout presents information on Millennial, Baby Boomers, Seniors. It is also available for immediate download and adjustment. So, changes can be made in the color, design, graphics or any other component to create a unique layout.
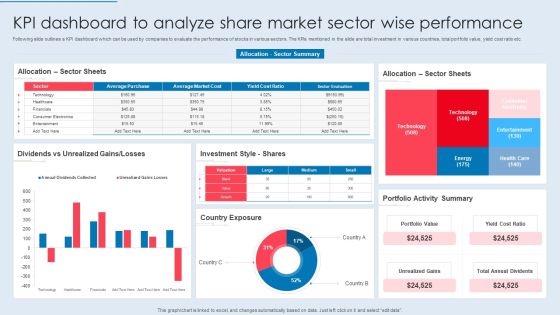
KPI Dashboard To Analyze Share Market Sector Wise Performance Summary PDF
Following slide outlines a KPI dashboard which can be used by companies to evaluate the performance of stocks in various sectors. The KPIs mentioned in the slide are total investment in various countries, total portfolio value, yield cost ratio etc. Pitch your topic with ease and precision using this KPI Dashboard To Analyze Share Market Sector Wise Performance Summary PDF. This layout presents information on Sector Sheets, Dividends Vs Unrealized, Investment Style. It is also available for immediate download and adjustment. So, changes can be made in the color, design, graphics or any other component to create a unique layout.

Share Market Dashboard Highlighting Price Moving Average Trend Themes PDF
Following slide outlines stock market dashboard of an industry. The various metrics highlighted in the slide are stock codes, previous day price of stock, percent of price change, maximum and lowest price of stock, moving average trend etc. Pitch your topic with ease and precision using this Share Market Dashboard Highlighting Price Moving Average Trend Themes PDF. This layout presents information on Moving Average, Stock Price, Performing Stocks. It is also available for immediate download and adjustment. So, changes can be made in the color, design, graphics or any other component to create a unique layout.

Share Portfolio Tracking Sheet To Analyze Market Indices Themes PDF
Following slide showcases portfolio tracking sheet to analyze stock market performance. This slide provides information about total number of shares purchased, price at which share bought, total cost, current market value of share, etc. Pitch your topic with ease and precision using this Share Portfolio Tracking Sheet To Analyze Market Indices Themes PDF. This layout presents information on Share Portfolio, Tracking Sheet, Market Indices. It is also available for immediate download and adjustment. So, changes can be made in the color, design, graphics or any other component to create a unique layout.
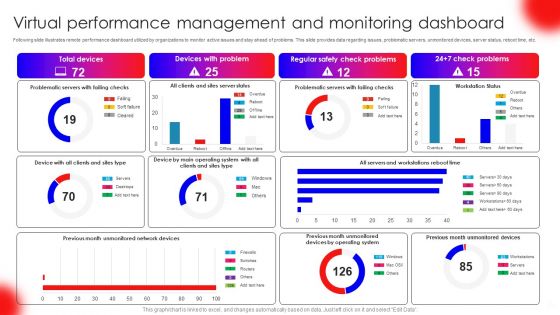
Virtual Performance Management And Monitoring Dashboard Pictures PDF
Following slide illustrates remote performance dashboard utilized by organizations to monitor active issues and stay ahead of problems. This slide provides data regarding issues, problematic servers, unmonitored devices, server status, reboot time, etc. Pitch your topic with ease and precision using this Virtual Performance Management And Monitoring Dashboard Pictures PDF. This layout presents information on Total Devices, Devices With Problem, Regular Safety Check Problems. It is also available for immediate download and adjustment. So, changes can be made in the color, design, graphics or any other component to create a unique layout.

KPI Dashboard To Measure Performance Of Saas Company Introduction PDF
This slide provides an overview of the SaaS metrics dashboard. The company can track the overall progress of their business model by tracking metrics such as quality leads, ARPA, signups past 4 weeks, net MRR churn rate, new business MRR, etc. Pitch your topic with ease and precision using this KPI Dashboard To Measure Performance Of Saas Company Introduction PDF. This layout presents information on Industry, Position, Customers, Quality Leads. It is also available for immediate download and adjustment. So, changes can be made in the color, design, graphics or any other component to create a unique layout.
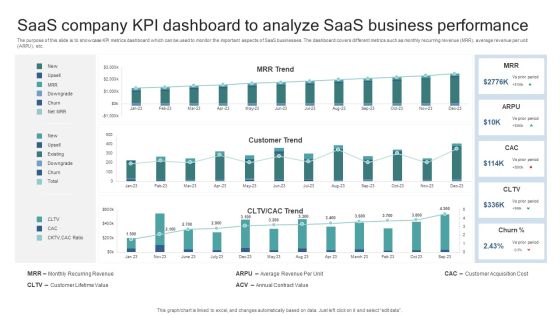
Saas Company KPI Dashboard To Analyze Saas Business Performance Elements PDF
The purpose of this slide is to showcase KPI metrics dashboard which can be used to monitor the important aspects of SaaS businesses. The dashboard covers different metrics such as monthly recurring revenue MRR, average revenue per unit ARPU, etc. Pitch your topic with ease and precision using this Saas Company KPI Dashboard To Analyze Saas Business Performance Elements PDF. This layout presents information on Monthly Recurring Revenue, Customer Lifetime Value, Average Revenue Per Unit, Annual Contract Value, Customer Acquisition Cost. It is also available for immediate download and adjustment. So, changes can be made in the color, design, graphics or any other component to create a unique layout.
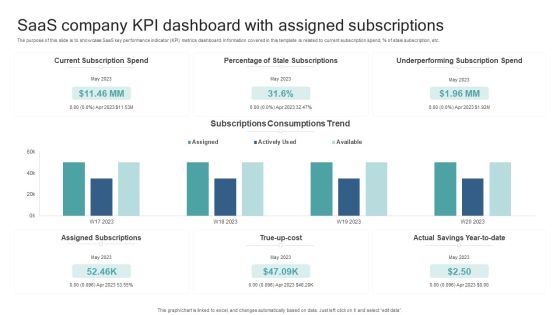
Saas Company KPI Dashboard With Assigned Subscriptions Formats PDF
The purpose of this slide is to showcase SaaS key performance indicator KPI metrics dashboard. Information covered in this template is related to current subscription spend, percent of stale subscription, etc. Pitch your topic with ease and precision using this Saas Company KPI Dashboard With Assigned Subscriptions Formats PDF. This layout presents information on Current Subscription Spend, Percentage Of Stale Subscriptions, True Up Cost, Underperforming Subscription Spend. It is also available for immediate download and adjustment. So, changes can be made in the color, design, graphics or any other component to create a unique layout.
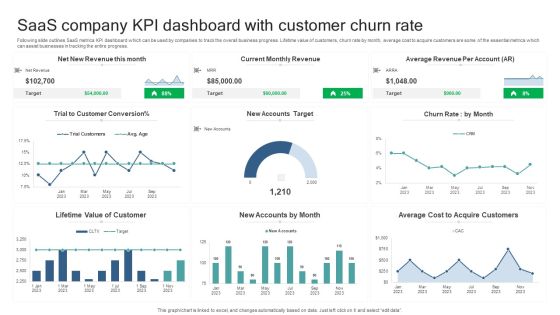
Saas Company KPI Dashboard With Customer Churn Rate Microsoft PDF
Following slide outlines SaaS metrics KPI dashboard which can be used by companies to track the overall business progress. Lifetime value of customers, churn rate by month, average cost to acquire customers are some of the essential metrics which can assist businesses in tracking the entire progress. Pitch your topic with ease and precision using this Saas Company KPI Dashboard With Customer Churn Rate Microsoft PDF. This layout presents information on Lifetime Value Of Customer, New Accounts By Month, Average Cost Acquire Customers. It is also available for immediate download and adjustment. So, changes can be made in the color, design, graphics or any other component to create a unique layout.
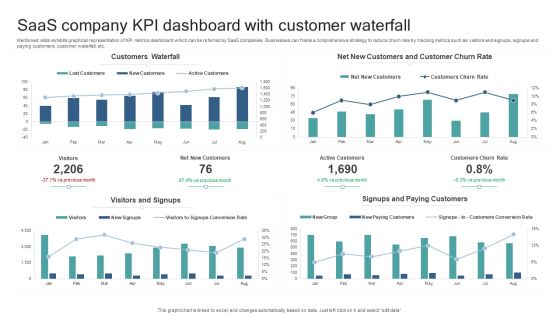
Saas Company KPI Dashboard With Customer Waterfall Slides PDF
Mentioned slide exhibits graphical representation of KPI metrics dashboard which can be referred by SaaS companies. Businesses can frame a comprehensive strategy to reduce churn rate by tracking metrics such as visitors and signups, signups and paying customers, customer waterfall, etc. Pitch your topic with ease and precision using this Saas Company KPI Dashboard With Customer Waterfall Slides PDF. This layout presents information on Customers Waterfall, Visitors And Signups, Signups And Paying Customers. It is also available for immediate download and adjustment. So, changes can be made in the color, design, graphics or any other component to create a unique layout.

Company Payout Dashboard For Transaction Data Collection Themes PDF
The slide covers a dashboard to highlight the status of current and previous transactions. Various elements included are card details, my cash, my savings, money sent, amount transfers, transaction history, etc. Pitch your topic with ease and precision using this Company Payout Dashboard For Transaction Data Collection Themes PDF. This layout presents information on Amount Transfers, Earning Month, Previous Transaction. It is also available for immediate download and adjustment. So, changes can be made in the color, design, graphics or any other component to create a unique layout.

Company Payout Dashboard Representing Accounts Payable Data Introduction PDF
The slide demonstrates a payment dashboard to measure and manage accounts payable. Various elements included are payable account, overdue, cash on hand, accounts payable funnel, invoice status, etc. Pitch your topic with ease and precision using this Company Payout Dashboard Representing Accounts Payable Data Introduction PDF. This layout presents information on Payable Accounts, Overdue, Invoices By Status, Account Payable Age. It is also available for immediate download and adjustment. So, changes can be made in the color, design, graphics or any other component to create a unique layout.

Strategic Dashboard To Track The Progress Of Drug Launch Structure PDF
Following slide presents a strategic dashboard which can be used by business organizations to track the progress of drug launch in the market. The key tasks are drug development, fund generation, testing, clinical trials, promotion, launch, feedback generation among many others. Pitch your topic with ease and precision using this Strategic Dashboard To Track The Progress Of Drug Launch Structure PDF. This layout presents information on Drug Development, Fund Generation, Testing, Clinical Trials, Promotion, Launch, Feedback Generation. It is also available for immediate download and adjustment. So, changes can be made in the color, design, graphics or any other component to create a unique layout.

Brand Recommendation Influence On Business Growth Diagrams PDF
Following slide demonstrates impact of brand endorsement on business market share to determine level of increased brand market share. This includes impacts on business such as leverage reputation, independent positioning, increase customer base and reduce. Pitch your topic with ease and precision using this Brand Recommendation Influence On Business Growth Diagrams PDF. This layout presents information on Leverage Reputation, Independent Positioning, Increase Customer Base, Customer Loyalty. It is also available for immediate download and adjustment. So, changes can be made in the color, design, graphics or any other component to create a unique layout.

Iot Agriculture Market And Growth Drivers By Services Ppt Infographic Template Elements PDF
This slide represents the smart agriculture market share by services component which shows expected market size for forecast period of 2018- 2025. It also cover key growth drivers behind growing market size. Find a pre-designed and impeccable Iot Agriculture Market And Growth Drivers By Services Ppt Infographic Template Elements PDF. The templates can ace your presentation without additional effort. You can download these easy-to-edit presentation templates to make your presentation stand out from others. So, what are you waiting for Download the template from Slidegeeks today and give a unique touch to your presentation.
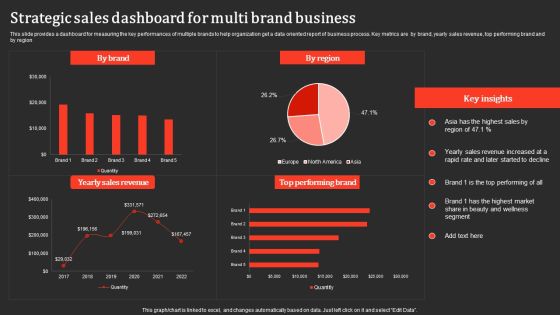
Strategic Sales Dashboard For Multi Brand Business Professional PDF
This slide provides a dashboard for measuring the key performances of multiple brands to help organization get a data oriented report of business process. Key metrics are by brand, yearly sales revenue, top performing brand and by region. Pitch your topic with ease and precision using this Strategic Sales Dashboard For Multi Brand Business Professional PDF. This layout presents information on Yearly Sales Revenue, Performing Brand. It is also available for immediate download and adjustment. So, changes can be made in the color, design, graphics or any other component to create a unique layout.

Major Abilities Required For Effective Corporate Communication Template PDF
The slide demonstrates a survey report highlighting the major communication skills required to share information within the organization. Various skills involved are non-verbal communication, written communication, emotional intelligence, etc. Pitch your topic with ease and precision using this Major Abilities Required For Effective Corporate Communication Template PDF. This layout presents information on Effective Communication, Skill Required, Boosts Teamwork. It is also available for immediate download and adjustment. So, changes can be made in the color, design, graphics or any other component to create a unique layout.

Overview Of Market Survey For New Product Survey Outcomes Survey SS
This slide illustrate the complete overview of new product market survey which will assist in to identify the potential gaps in a product. Result provided related to quality , quantity of products, etc. Pitch your topic with ease and precision using this Overview Of Market Survey For New Product Survey Outcomes Survey SS. This layout presents information on Overview Of Market Survey, Product Survey Outcomes . It is also available for immediate download and adjustment. So, changes can be made in the color, design, graphics or any other component to create a unique layout.
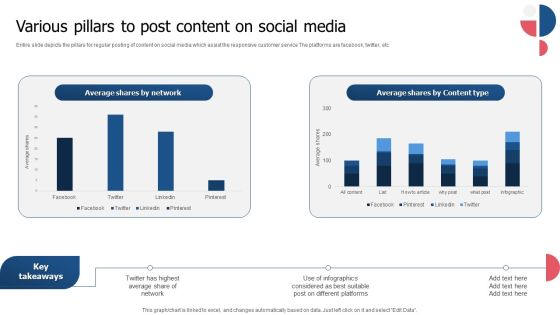
Various Pillars To Post Content On Social Media Mockup PDF
Entire slide depicts the pillars for regular posting of content on social media which assist the responsive customer service The platforms are facebook, twitter, etc. Pitch your topic with ease and precision using this Various Pillars To Post Content On Social Media Mockup PDF. This layout presents information on Average Shares Network, Average Shares Content Type, Average Share Network. It is also available for immediate download and adjustment. So, changes can be made in the color, design, graphics or any other component to create a unique layout.

Buyer Marketing Campaign Performance Dashboard Download PDF
Following dashboard depicts shopper marketing dashboard which can be used by managers to assess the performance of their campaigns. The key performance indicators are total customers, countries, website views, total campaigns, email sent, website traffic source etc. Pitch your topic with ease and precision using this Buyer Marketing Campaign Performance Dashboard Download PDF. This layout presents information on Total Customers, Countries, Website Views. It is also available for immediate download and adjustment. So, changes can be made in the color, design, graphics or any other component to create a unique layout.

Dashboard To Track Performance Of Buyer Marketing Campaign Infographics PDF
This slide depicts a Dashboard which can be used to track performance of shopper marketing campaign on digital platforms. The key performance indicators include Website leads, Current service users, Lead conversion rate, Lead satisfaction rate etc. Pitch your topic with ease and precision using this Dashboard To Track Performance Of Buyer Marketing Campaign Infographics PDF. This layout presents information on Social Media Campaign, Social Media Engagement, Current Service Users. It is also available for immediate download and adjustment. So, changes can be made in the color, design, graphics or any other component to create a unique layout.

Comparative Analysis Of Cash Earn And Burn Rate By Retail Companies Slides PDF
The following slide compares the runway of companies in retail merchandising followed by reasons of concern . The slide compares earn and burn rate . Pitch your topic with ease and precision using this Comparative Analysis Of Cash Earn And Burn Rate By Retail Companies Slides PDF. This layout presents information on Key Insights, Companies, Company. It is also available for immediate download and adjustment. So, changes can be made in the color, design, graphics or any other component to create a unique layout.
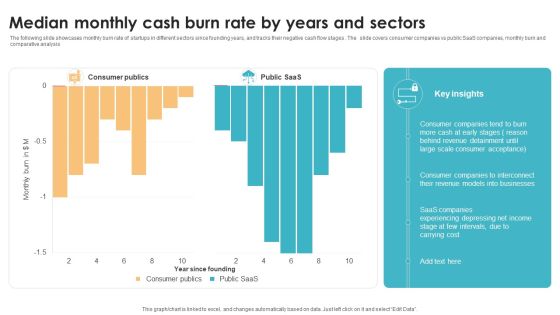
Median Monthly Cash Burn Rate By Years And Sectors Mockup PDF
The following slide showcases monthly burn rate of startups in different sectors since founding years, and tracks their negative cash flow stages . The slide covers consumer companies vs public SaaS companies, monthly burn and comparative analysis Pitch your topic with ease and precision using this Median Monthly Cash Burn Rate By Years And Sectors Mockup PDF. This layout presents information on Sectors, Key Insights, Consumer Acceptance. It is also available for immediate download and adjustment. So, changes can be made in the color, design, graphics or any other component to create a unique layout.

One Page Summary For Business To Business Marketing Analysis Survey Results Survey SS
The purpose of this slide is to summarize the results of a market research survey of potential businesses to take better business decisions. Results provided are related to business, product quality, and performance of technical support representative. Pitch your topic with ease and precision using this One Page Summary For Business To Business Marketing Analysis Survey Results Survey SS. This layout presents information on Business Related, Product Quality, Performance Of Technical, Quality Standards. It is also available for immediate download and adjustment. So, changes can be made in the color, design, graphics or any other component to create a unique layout.

Summary Of Business Product Survey Questionnaire Results Survey SS
This slide summarizing the overall result of product market survey conduct by owner to improve the quality of product and meet the customer demands . Results are provided related to quality of product, pricing of product etc. Pitch your topic with ease and precision using this Summary Of Business Product Survey Questionnaire Results Survey SS. This layout presents information on Summary Of Business, Product Survey, Questionnaire Results. It is also available for immediate download and adjustment. So, changes can be made in the color, design, graphics or any other component to create a unique layout.

Constructive Destructive Shoppers Experience And Feedback For Supermarket Clipart PDF
This slide displays response to survey conducted on convenience to find products to improve consumer experience at retail store. The results are evaluated on the basis of very easy, moderate and difficult. Pitch your topic with ease and precision using this Constructive Destructive Shoppers Experience And Feedback For Supermarket Clipart PDF. This layout presents information on Supermarket, Constructive, Shoppers. It is also available for immediate download and adjustment. So, changes can be made in the color, design, graphics or any other component to create a unique layout.

Android Automation Applications Comparative Survey Pictures PDF
The slide carries a survey for comparing different android RPA applications based on user ratings and usability. Various applications included are Pega System, Automate Plus, Blue Prism, Another Monday, Automai, TagUI, etc Pitch your topic with ease and precision using this Android Automation Applications Comparative Survey Pictures PDF. This layout presents information on Applications, Key Takeaways, Survey. It is also available for immediate download and adjustment. So, changes can be made in the color, design, graphics or any other component to create a unique layout.

Ad Campaign Dashboard New Product Release Strategy Guidelines PDF
This slide depicts advertisement campaign dashboard used by fintech company managers to track effectiveness of the campaign for new product launch. The key performance indicators are ad cost, total clicks, total impressions, ad impressions etc. Pitch your topic with ease and precision using this Ad Campaign Dashboard New Product Release Strategy Guidelines PDF. This layout presents information on Impressions, Conversion, Strategy. It is also available for immediate download and adjustment. So, changes can be made in the color, design, graphics or any other component to create a unique layout.

E Mail Performance Analytics Metrics Tracking Report Analysis Demonstration PDF
The purpose of this slide is to showcase an e-mail analytics mechanism in order to track the performance of certain e-mail marketing based on various metrics. Certain KPIs include open rate, click rate, unsubscribe rate etc. Pitch your topic with ease and precision using this E Mail Performance Analytics Metrics Tracking Report Analysis Demonstration PDF. This layout presents information on E Mail Performance Analytics, Metrics Tracking Report Analysis. It is also available for immediate download and adjustment. So, changes can be made in the color, design, graphics or any other component to create a unique layout.

Customer Decline Of Sales Analysis Dashboard Rules PDF
The following slide presents a key performance indicating dashboards that can be used by managers in order to analyse customer-lost sales. Major key performance indicators are lost deals rate, lost sales rate, customer data analytics, etc. Pitch your topic with ease and precision using this Customer Decline Of Sales Analysis Dashboard Rules PDF. This layout presents information on Customer Data Analytics. It is also available for immediate download and adjustment. So, changes can be made in the color, design, graphics or any other component to create a unique layout.

Inventory Stock Out And Decline Of Sales Analysis Dashboard Inspiration PDF
Following slide presents a key performance indicating dashboard that can be used by businesses to track Inventory stock out and lost sales. Major key performance indicators are percentage stockouts, amount of sales, lost sales accountability, etc. Pitch your topic with ease and precision using this Inventory Stock Out And Decline Of Sales Analysis Dashboard Inspiration PDF. This layout presents information on Lost Sales Summary, Stock Out Details It is also available for immediate download and adjustment. So, changes can be made in the color, design, graphics or any other component to create a unique layout.
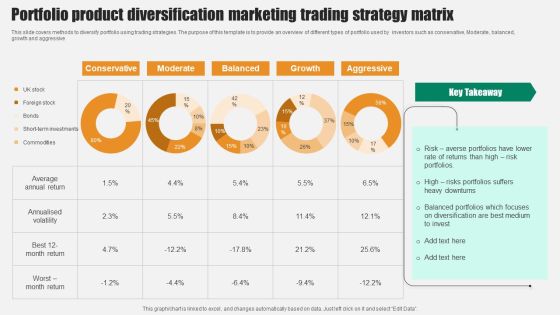
Portfolio Product Diversification Marketing Trading Strategy Matrix Clipart PDF
This slide covers methods to diversify portfolio using trading strategies. The purpose of this template is to provide an overview of different types of portfolio used by investors such as conservative, Moderate, balanced, growth and aggressive. Pitch your topic with ease and precision using this Portfolio Product Diversification Marketing Trading Strategy Matrix Clipart PDF. This layout presents information on Conservative, Moderate, Balanced, Growth, Aggressive. It is also available for immediate download and adjustment. So, changes can be made in the color, design, graphics or any other component to create a unique layout.
HR Attrition Rate By Company Size Elements PDF
This slide consists of turnover rate of employees which can be used by recruiters, business owners, industry decision-makers, organizations, and data analysts to obtain a general understanding of the turnover rate in the economy. Key elements covered are number of employees working in the organization, duration of employment and turnover rate. Pitch your topic with ease and precision using this HR Attrition Rate By Company Size Elements PDF. This layout presents information on Key Takeaways, Business Sizes, Employees. It is also available for immediate download and adjustment. So, changes can be made in the color, design, graphics or any other component to create a unique layout.
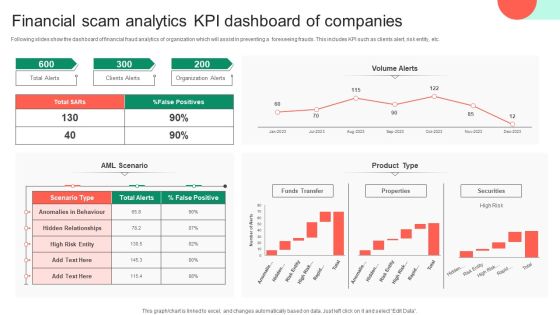
Financial Scam Analytics KPI Dashboard Of Companies Clipart PDF
Following slides show the dashboard of financial fraud analytics of organization which will assist in preventing a foreseeing frauds. This includes KPI such as clients alert, risk entity, etc. Pitch your topic with ease and precision using this Financial Scam Analytics KPI Dashboard Of Companies Clipart PDF. This layout presents information on Financial Scam Analytics, Kpi Dashboard Of Companies. It is also available for immediate download and adjustment. So, changes can be made in the color, design, graphics or any other component to create a unique layout.
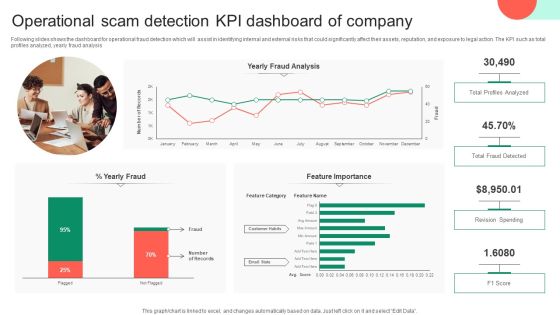
Operational Scam Detection KPI Dashboard Of Company Topics PDF
Following slides shows the dashboard for operational fraud detection which will assist in identifying internal and external risks that could significantly affect their assets, reputation, and exposure to legal action. The KPI such as total profiles analyzed, yearly fraud analysis. Pitch your topic with ease and precision using this Operational Scam Detection KPI Dashboard Of Company Topics PDF. This layout presents information on Profiles Analyzed, Operational Scam Detection, Kpi Dashboard Of Company. It is also available for immediate download and adjustment. So, changes can be made in the color, design, graphics or any other component to create a unique layout.
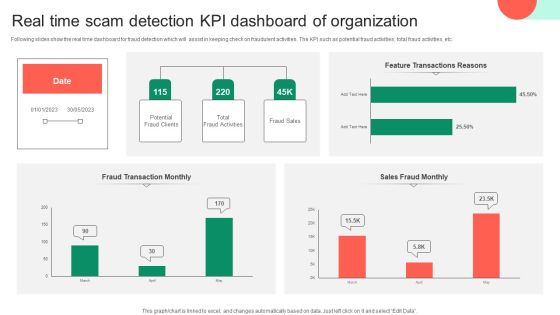
Real Time Scam Detection KPI Dashboard Of Organization Information PDF
Following slides show the real time dashboard for fraud detection which will assist in keeping check on fraudulent activities. The KPI such as potential fraud activities, total fraud activities, etc. Pitch your topic with ease and precision using this Real Time Scam Detection KPI Dashboard Of Organization Information PDF. This layout presents information on Real Time Scam Detection, Kpi Dashboard Of Organization. It is also available for immediate download and adjustment. So, changes can be made in the color, design, graphics or any other component to create a unique layout.

Scam Prevention Startup KPI Dashboard For Ecommerce Themes PDF
Following slides show the startup dashboard for fraud protection in e-commerce which will assist in identifies developing and fresh fraud attacks. The KPI such as active merchants, covered merchants, approved volume. Pitch your topic with ease and precision using this Scam Prevention Startup KPI Dashboard For Ecommerce Themes PDF. This layout presents information on Approved Volume, Chargebacks Rate, Kpi Dashboard For Ecommerce. It is also available for immediate download and adjustment. So, changes can be made in the color, design, graphics or any other component to create a unique layout.
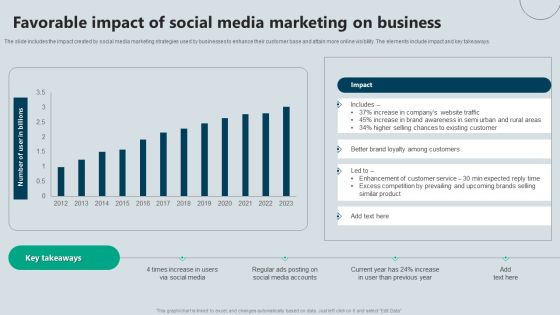
Favorable Impact Of Social Media Marketing On Business Themes PDF
The slide includes the impact created by social media marketing strategies used by businesses to enhance their customer base and attain more online visibility. The elements include impact and key takeaways. Pitch your topic with ease and precision using this Favorable Impact Of Social Media Marketing On Business Themes PDF. This layout presents information on Impact, Business, Existing Customer. It is also available for immediate download and adjustment. So, changes can be made in the color, design, graphics or any other component to create a unique layout.
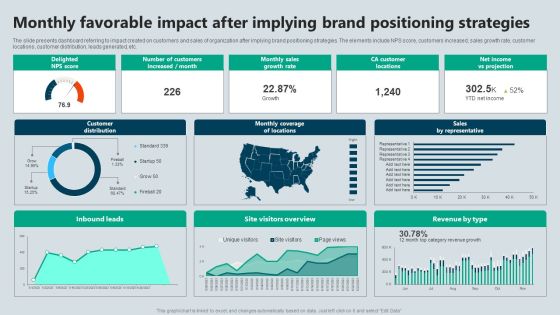
Monthly Favorable Impact After Implying Brand Positioning Strategies Demonstration PDF
The slide presents dashboard referring to impact created on customers and sales of organization after implying brand positioning strategies. The elements include NPS score, customers increased, sales growth rate, customer locations, customer distribution, leads generated, etc. Pitch your topic with ease and precision using this Monthly Favorable Impact After Implying Brand Positioning Strategies Demonstration PDF. This layout presents information on Strategies, Projection, Growth Rate. It is also available for immediate download and adjustment. So, changes can be made in the color, design, graphics or any other component to create a unique layout.

Customer Feedback Statistics In Owned Media Diagrams PDF
Following slide brings forth the customer feedback statistics by using earned media. Top customer responses include visit website, search for more reviews, visit business location, continue with search and contact the business Pitch your topic with ease and precision using this Customer Feedback Statistics In Owned Media Diagrams PDF. This layout presents information on Key Takeaways, Media, Customer. It is also available for immediate download and adjustment. So, changes can be made in the color, design, graphics or any other component to create a unique layout.

Dashboard To Track Effectiveness Of Owned Media Marketing Structure PDF
This slide illustrates a dashboard which can be used by brand managers to track the effectiveness of earned media in the domain of digital marketing. The key elements include brand mentions, social media reach, customer interactions, positive and negative feedback Pitch your topic with ease and precision using this Dashboard To Track Effectiveness Of Owned Media Marketing Structure PDF. This layout presents information on Brand Mentions, Social Media, Marketing. It is also available for immediate download and adjustment. So, changes can be made in the color, design, graphics or any other component to create a unique layout.
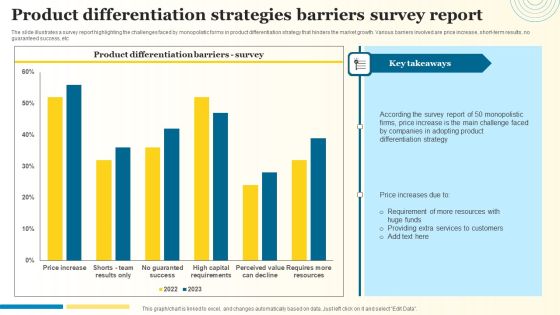
Product Differentiation Strategies Barriers Survey Report Introduction PDF
The slide illustrates a survey report highlighting the challenges faced by monopolistic forms in product differentiation strategy that hinders the market growth. Various barriers involved are price increase, short-term results, no guaranteed success, etc. Pitch your topic with ease and precision using this Product Differentiation Strategies Barriers Survey Report Introduction PDF. This layout presents information on Differentiation Strategy, Adopting Product, Price Increase. It is also available for immediate download and adjustment. So, changes can be made in the color, design, graphics or any other component to create a unique layout.
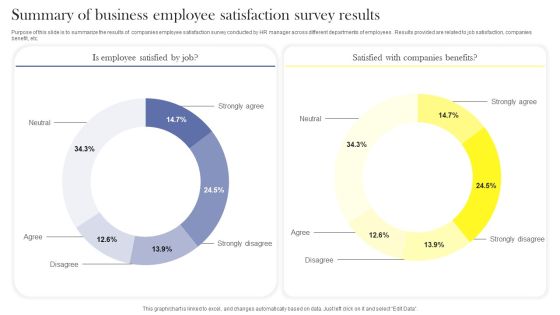
Summary Of Business Employee Satisfaction Survey Results Survey SS
Purpose of this slide is to summarize the results of companies employee satisfaction survey conducted by HR manager across different departments of employees . Results provided are related to job satisfaction, companies benefit, etc. Pitch your topic with ease and precision using this Summary Of Business Employee Satisfaction Survey Results Survey SS. This layout presents information on Neutral, Strongly Agree, Strongly Disagree, Disagree, Agree. It is also available for immediate download and adjustment. So, changes can be made in the color, design, graphics or any other component to create a unique layout.
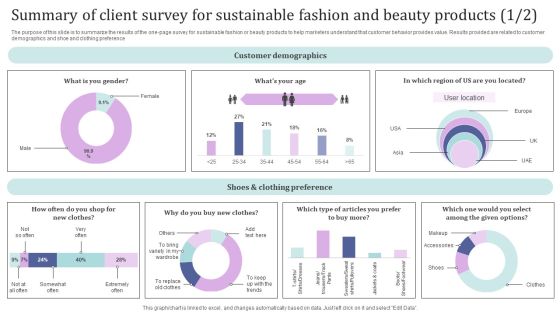
Summary Of Client Survey For Sustainable Fashion And Beauty Products Survey SS
The purpose of this slide is to summarize the results of the one-page survey for sustainable fashion or beauty products to help marketers understand that customer behavior provides value. Results provided are related to customer demographics and shoe and clothing preference. Pitch your topic with ease and precision using this Summary Of Client Survey For Sustainable Fashion And Beauty Products Survey SS. This layout presents information on Customer Demographics, Shoes And Clothing Preference, User Location. It is also available for immediate download and adjustment. So, changes can be made in the color, design, graphics or any other component to create a unique layout.
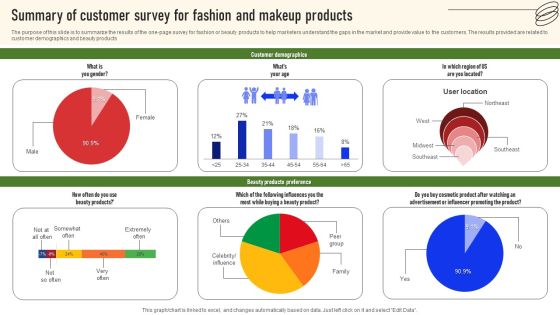
Summary Of Customer Survey For Fashion And Makeup Products Survey SS
The purpose of this slide is to summarize the results of the one-page survey for fashion or beauty products to help marketers understand the gaps in the market and provide value to the customers. The results provided are related to customer demographics and beauty products. Pitch your topic with ease and precision using this Summary Of Customer Survey For Fashion And Makeup Products Survey SS. This layout presents information on Customer Demographics, Beauty Products Preference. It is also available for immediate download and adjustment. So, changes can be made in the color, design, graphics or any other component to create a unique layout.
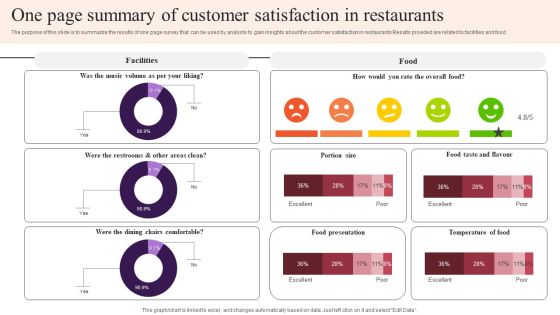
One Page Summary Of Customer Satisfaction In Restaurants Survey SS
The purpose of this slide is to summarize the results of one page survey that can be used by analysts to gain insights about the customer satisfaction in restaurants Results provided are related to facilities and food. Pitch your topic with ease and precision using this One Page Summary Of Customer Satisfaction In Restaurants Survey SS. This layout presents information on Facilities, Food Presentation, Temperature Of Food, Food Taste And Flavour. It is also available for immediate download and adjustment. So, changes can be made in the color, design, graphics or any other component to create a unique layout.

Summary Of Post Event Experience Survey Survey SS
The purpose of this slide is to summarize the results of one-page survey that can be used by businesses and event organizations to gather feedback about current events and make improvements in successive ones. The results provided are related to general questions and event questions. Pitch your topic with ease and precision using this Summary Of Post Event Experience Survey Survey SS. This layout presents information on General Questions, Event Questions, Location Of The Event, Social Media. It is also available for immediate download and adjustment. So, changes can be made in the color, design, graphics or any other component to create a unique layout.

Summary Of New Product Launch Feedback Questionnaire Survey SS
The purpose of this slide is to summarize the results of a one-page survey that can be used by product developers and business managers to gain insights from customers. The results provided are related to customer information and product usage. Pitch your topic with ease and precision using this Summary Of New Product Launch Feedback Questionnaire Survey SS. This layout presents information on Customer Information, Product Usage, Occupation, Value For Money, Product Quality. It is also available for immediate download and adjustment. So, changes can be made in the color, design, graphics or any other component to create a unique layout.

Summary Of Restaurant Experience Survey Results Survey SS
This slide summarizing the overall result of restaurant survey conduct by owner to enhance customer experience. Results are provided related to quality of service provided by owner, server, beverage products, etc. Pitch your topic with ease and precision using this Summary Of Restaurant Experience Survey Results Survey SS. This layout presents information on Quality Of Food Items, Quality Of Restaurant Cleanliness, Quality Of Beverage Products. It is also available for immediate download and adjustment. So, changes can be made in the color, design, graphics or any other component to create a unique layout.

Summary Of Financial Performance Of Present Business Survey SS
The purpose of this slide is to summarize the results of a one-page survey that can be used by policymakers to gain insights into the financial performance of all the businesses operating in the service industry to gain insights and take action accordingly. The results provided are related to executions and staffing. Pitch your topic with ease and precision using this Summary Of Financial Performance Of Present Business Survey SS. This layout presents information on Business Executions, Business Employees, Organization, Officers, Managers, Staff. It is also available for immediate download and adjustment. So, changes can be made in the color, design, graphics or any other component to create a unique layout.
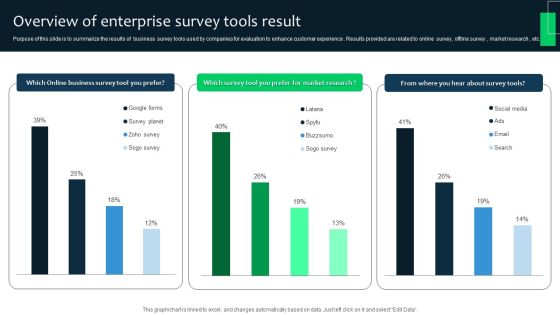
Overview Of Enterprise Survey Tools Result Survey SS
Purpose of this slide is to summarize the results of business survey tools used by companies for evaluation to enhance customer experience . Results provided are related to online survey, offline survey , market research , etc. Pitch your topic with ease and precision using this Overview Of Enterprise Survey Tools Result Survey SS. This layout presents information on Online Business Survey Tool, Market Research, Survey Tools, Social Media. It is also available for immediate download and adjustment. So, changes can be made in the color, design, graphics or any other component to create a unique layout.

Business Sales Procedures Improvement Dashboard Designs PDF
Following slide shows the dashboard for reengineering business sales processes which assist in accelerated processing times, lower costs, better customer service, and stronger employee retention. The KPI are proposals ,opportunities, etc. Pitch your topic with ease and precision using this Business Sales Procedures Improvement Dashboard Designs PDF. This layout presents information on Deals Opportunities Ratios, Opportunity, Deals Conversion Ratio. It is also available for immediate download and adjustment. So, changes can be made in the color, design, graphics or any other component to create a unique layout.

Dashboard To Track Impact Of Extensive Diversity Training On Workplace Management Portrait PDF
This slide showcases dashboard to track impact of diversity training on workplace management. Key metrics included here are gender distribution level, hire by gender, ethinicity distribution, promotion rate, termination rate etc. Pitch your topic with ease and precision using this Dashboard To Track Impact Of Extensive Diversity Training On Workplace Management Portrait PDF. This layout presents information on Dashboard To Track Impact, Extensive Diversity Training, Workplace Management. It is also available for immediate download and adjustment. So, changes can be made in the color, design, graphics or any other component to create a unique layout.

Corporate Resource Management Report With Indicators Ppt PowerPoint Presentation Portfolio Design Templates PDF
This slide presents the resource analysis table that shows tangible and intangible resources on the basis of characteristics and indicators such as private funding, internal assets, operational strategies, collaborative process, etc. Pitch your topic with ease and precision using this corporate resource management report with indicators ppt powerpoint presentation portfolio design templates pdf. This layout presents information on financial, technology, collaborative process . It is also available for immediate download and adjustment. So, changes can be made in the color, design, graphics or any other component to create a unique layout.

Healthcare Business Environment Evaluation With Issues And Impact Brochure PDF
This slide focuses on the healthcare business environmental analysis which shows issues and impact that includes issues such as political, economic, socio cultural, technological, legislation and environmental factors with impacts such as loss of businesses, focus on education, etc. Pitch your topic with ease and precision using this Healthcare Business Environment Evaluation With Issues And Impact Brochure PDF. This layout presents information on Economic, Environmental, Social. It is also available for immediate download and adjustment. So, changes can be made in the color, design, graphics or any other component to create a unique layout.

Ways To Reduce Environmental Impact Of Common Data Storage Ppt Show Ideas PDF
The following slide showcases approaches to be combined with other solutions to minimize the environmental impact of data storage. The approaches covered are using data storage technologies, reduce data quantity and data centre decommissioning. Pitch your topic with ease and precision using this Ways To Reduce Environmental Impact Of Common Data Storage Ppt Show Ideas PDF. This layout presents information on Reduce Data Quantity, Data Centre Decommissioning, Data Centre Decommissioning. It is also available for immediate download and adjustment. So, changes can be made in the color, design, graphics or any other component to create a unique layout.

Customer Server Architecture Assessment Checklist Mockup PDF
This slide exhibits checklist for assessment of client server architecture on basis of different parameters which helps to manage time and cost efficiently. Some of the parameters includes cost of infrastructure, cost of development and impact on performance with upgradation in technology Pitch your topic with ease and precision using this Customer Server Architecture Assessment Checklist Mockup PDF. This layout presents information on Criteria, Priority, Action Taken . It is also available for immediate download and adjustment. So, changes can be made in the color, design, graphics or any other component to create a unique layout.

Project Management Plan With Team Task Status Portrait PDF
In this slide we have showcased how task progress which are already assigned to team and future task which will be provide to them. We analyze the tasks on following parameters- progress, timeline and design element. Pitch your topic with ease and precision using this Project Management Plan With Team Task Status Portrait PDF. This layout presents information on Team Meeting, Suppliers, Development. It is also available for immediate download and adjustment. So, changes can be made in the color, design, graphics or any other component to create a unique layout.

Target Audience Checklist For Customer Communication Service Plan Professional PDF
The following slide highlights the target audience checklist for customer contact strategy illustrating key headings which includes parameters, description, status and recommendation. Where parameter includes market research, industry trend study, create buyer persona, ideal audience and optimize buyer persona. Pitch your topic with ease and precision using this Target Audience Checklist For Customer Communication Service Plan Professional PDF. This layout presents information on Market Research, Industry Trend Study, Create Buyer Personal. It is also available for immediate download and adjustment. So, changes can be made in the color, design, graphics or any other component to create a unique layout.
Timeline Plan For Job Training Management Ppt Icon Templates PDF
The slide inculcates a timeline for corporate coaching to ensure successful and productive training of business employees. Various types of training are email etiquette, technical training, commercial training, etc. Pitch your topic with ease and precision using this Timeline Plan For Job Training Management Ppt Icon Templates PDF. This layout presents information on Email Etiquette, Technical Training, Commercial Training. It is also available for immediate download and adjustment. So, changes can be made in the color, design, graphics or any other component to create a unique layout.
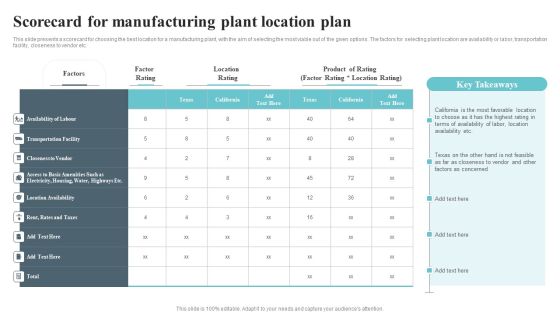
Scorecard For Manufacturing Plant Location Plan Microsoft PDF
This slide presents a scorecard for choosing the best location for a manufacturing plant, with the aim of selecting the most viable out of the given options. The factors for selecting plant location are availability or labor, transportation facility, closeness to vendor etc.Pitch your topic with ease and precision using this Scorecard For Manufacturing Plant Location Plan Microsoft PDF. This layout presents information on Transportation Facility, Location Availability, Favorable Location. It is also available for immediate download and adjustment. So, changes can be made in the color, design, graphics or any other component to create a unique layout.

Marketing Plan For Tourism And Hospitality Matrix Summary PDF
This slide contains a content marketing strategy to promote business across a variety of channels. These strategies include search engine optimization, testimonial and reviews, video creation, and social media accounts to encourage conversions for the business. Pitch your topic with ease and precision using this Marketing Plan For Tourism And Hospitality Matrix Summary PDF. This layout presents information on Search Engine Optimization, Testimonial And Reviews, Video Creation, Social Media Account. It is also available for immediate download and adjustment. So, changes can be made in the color, design, graphics or any other component to create a unique layout.

Social Media Tools Engaged With Incident Communication Plan Guidelines PDF
The slides highlight the usage of social media tools in crisis communication to connect with the community in times of emergency. The various modes include social networking, blogs, microblogging, content sharing, and Q and A sessions. Pitch your topic with ease and precision using this Social Media Tools Engaged With Incident Communication Plan Guidelines PDF. This layout presents information on Microblogging, Social Networking, Information. It is also available for immediate download and adjustment. So, changes can be made in the color, design, graphics or any other component to create a unique layout.

Various Categories Of Investment For Financial Planning Demonstration PDF
The slide covers the investment types to effectively manage the finances of the business. Various types of investments included are savings account, gold investment, equity stocks, fixed deposit investments, etc. Pitch your topic with ease and precision using this Various Categories Of Investment For Financial Planning Demonstration PDF. This layout presents information on Investment Period, Risk Reward, Liquidity Ratio. It is also available for immediate download and adjustment. So, changes can be made in the color, design, graphics or any other component to create a unique layout.
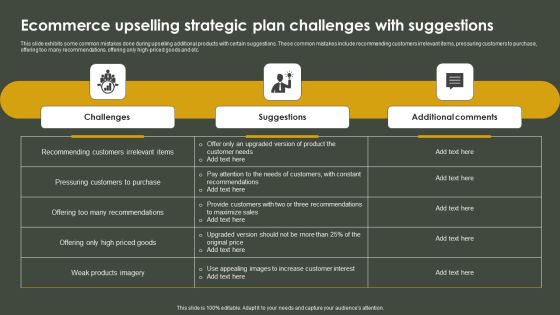
Ecommerce Upselling Strategic Plan Challenges With Suggestions Infographics PDF
This slide exhibits some common mistakes done during upselling additional products with certain suggestions. These common mistakes include recommending customers irrelevant items, pressuring customers to purchase, offering too many recommendations, offering only high-priced goods and etc. Pitch your topic with ease and precision using this Ecommerce Upselling Strategic Plan Challenges With Suggestions Infographics PDF.zip. This layout presents information on Challenges, Suggestions, Additional. It is also available for immediate download and adjustment. So, changes can be made in the color, design, graphics or any other component to create a unique layout.
Non Profit Financial Plan Business Inventory Budget Tracker Topics PDF
The following slide provides a business inventory budget tracker that helps enterprises continuously monitor the inventory owned. Major items monitored include initial inventory, sales, ending inventory, average markup, purchase at cost, etcPitch your topic with ease and precision using this Non Profit Financial Plan Business Inventory Budget Tracker Topics PDF. This layout presents information on Beginning Inventory, Employee Discounts. It is also available for immediate download and adjustment. So, changes can be made in the color, design, graphics or any other component to create a unique layout.

Risk Management Checklist With Vulnerability Management Pictures PDF
This slide showcases risk acceptance checklist which can be referred by IT management to accept or mitigate vulnerabilities with least amount of loss. It includes information about risks, date of occurrence, vulnerability level, next follow up, etc. Pitch your topic with ease and precision using this Risk Management Checklist With Vulnerability Management Pictures PDF. This layout presents information on Operating System, Risk, Intranet Traffic. It is also available for immediate download and adjustment. So, changes can be made in the color, design, graphics or any other component to create a unique layout.

Business Case Studies In Stagnant Industries Ppt PowerPoint Presentation Complete Deck With Slides
This complete deck acts as a great communication tool. It helps you in conveying your business message with personalized sets of graphics, icons etc. Comprising a set of forty two slides, this complete deck can help you persuade your audience. It also induces strategic thinking as it has been thoroughly researched and put together by our experts. Not only is it easily downloadable but also editable. The color, graphics, theme any component can be altered to fit your individual needs. So grab it now.

Evaluating Performance Ppt PowerPoint Presentation Complete Deck With Slides
This complete deck acts as a great communication tool. It helps you in conveying your business message with personalized sets of graphics, icons etc. Comprising a set of twenty five slides, this complete deck can help you persuade your audience. It also induces strategic thinking as it has been thoroughly researched and put together by our experts. Not only is it easily downloadable but also editable. The color, graphics, theme any component can be altered to fit your individual needs. So grab it now.

Cross Channel Marketing Benefits Ppt PowerPoint Presentation Complete Deck With Slides
This complete deck acts as a great communication tool. It helps you in conveying your business message with personalized sets of graphics, icons etc. Comprising a set of forty two slides, this complete deck can help you persuade your audience. It also induces strategic thinking as it has been thoroughly researched and put together by our experts. Not only is it easily downloadable but also editable. The color, graphics, theme any component can be altered to fit your individual needs. So grab it now.

SCR For Market Ppt PowerPoint Presentation Complete Deck With Slides
This complete deck acts as a great communication tool. It helps you in conveying your business message with personalized sets of graphics, icons etc. Comprising a set of forty Seven slides, this complete deck can help you persuade your audience. It also induces strategic thinking as it has been thoroughly researched and put together by our experts. Not only is it easily downloadable but also editable. The color, graphics, theme any component can be altered to fit your individual needs. So grab it now.
 Home
Home