Program Components
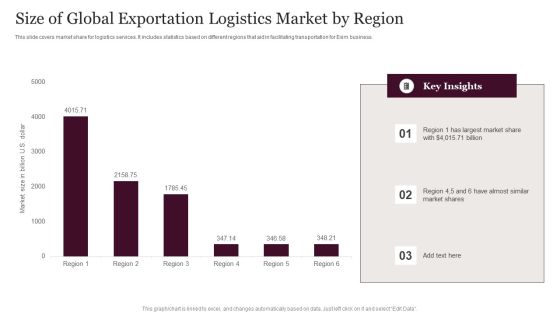
Size Of Global Exportation Logistics Market By Region Information PDF
This slide covers market share for logistics services. It includes statistics based on different regions that aid in facilitating transportation for Exim business. Pitch your topic with ease and precision using this Size Of Global Exportation Logistics Market By Region Information PDF. This layout presents information on Global Exportation Logistics, Market By Region. It is also available for immediate download and adjustment. So, changes can be made in the color, design, graphics or any other component to create a unique layout.
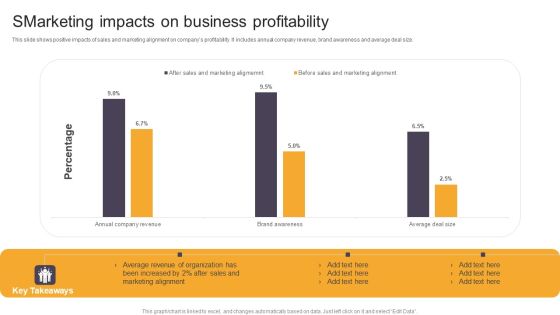
Smarketing Impacts On Business Profitability Ppt Outline Graphics Template PDF
This slide shows positive impacts of sales and marketing alignment on companys profitability. It includes annual company revenue, brand awareness and average deal size. Pitch your topic with ease and precision using this Smarketing Impacts On Business Profitability Ppt Outline Graphics Template PDF. This layout presents information on Sales And Marketing, Average Revenue, Organization. It is also available for immediate download and adjustment. So, changes can be made in the color, design, graphics or any other component to create a unique layout.
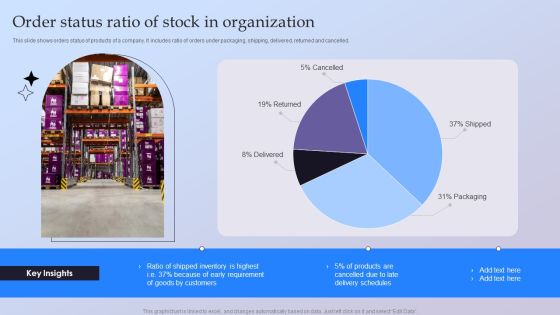
Order Status Ratio Of Stock In Organization Ppt Portfolio Examples PDF
This slide shows orders status of products of a company. It includes ratio of orders under packaging, shipping, delivered, returned and cancelled. Pitch your topic with ease and precision using this Order Status Ratio Of Stock In Organization Ppt Portfolio Examples PDF. This layout presents information on Shipped, Packaging, Delivered, Returned. It is also available for immediate download and adjustment. So, changes can be made in the color, design, graphics or any other component to create a unique layout.

Customer Acquisition Method In Brand Campaign Advertisement Themes PDF
This slide showcase the methods used by companies for product promotion in campaign. It includes influencer marketing, organic search and paid search. Pitch your topic with ease and precision using this Customer Acquisition Method In Brand Campaign Advertisement Themes PDF. This layout presents information on Product Promotion, Marketing, Organic Research. It is also available for immediate download and adjustment. So, changes can be made in the color, design, graphics or any other component to create a unique layout.

Communication Barriers Manager Dashboard For Analyzing Ppt PowerPoint Presentation Inspiration Grid PDF
This slide represents the dashboard of communication manager. It includes KPIs such as current conversation, performance, customers and opportunities.Pitch your topic with ease and precision using this Communication Barriers Manager Dashboard For Analyzing Ppt PowerPoint Presentation Inspiration Grid PDF. This layout presents information on Current Conversation, Economic Indicator, Conversation Calls. It is also available for immediate download and adjustment. So, changes can be made in the color, design, graphics or any other component to create a unique layout.

Social Media Marketing And Advertising Promotional Investments Projections Sample PDF
This slide depicts investment in different social media platforms. It includes stats for Facebook, LinkedIn, Google plus, twitter, YouTube, Pinterest and Instagram platforms.Pitch your topic with ease and precision using this Social Media Marketing And Advertising Promotional Investments Projections Sample PDF. This layout presents information on Advertisements, People Facebook, People Believe. It is also available for immediate download and adjustment. So, changes can be made in the color, design, graphics or any other component to create a unique layout.
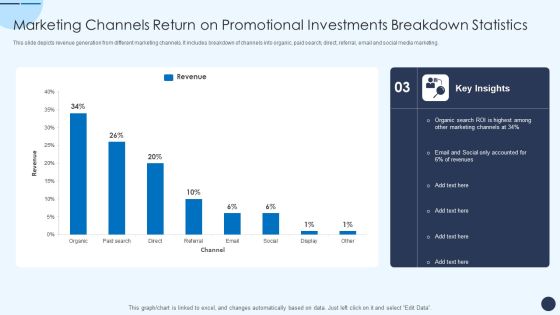
Marketing Channels Return On Promotional Investments Breakdown Statistics Information PDF
This slide depicts revenue generation from different marketing channels. It includes breakdown of channels into organic, paid search, direct, referral, email and social media marketing.Pitch your topic with ease and precision using this Marketing Channels Return On Promotional Investments Breakdown Statistics Information PDF. This layout presents information on Revenues Marketing, Organic Search, Social Accounted. It is also available for immediate download and adjustment. So, changes can be made in the color, design, graphics or any other component to create a unique layout.
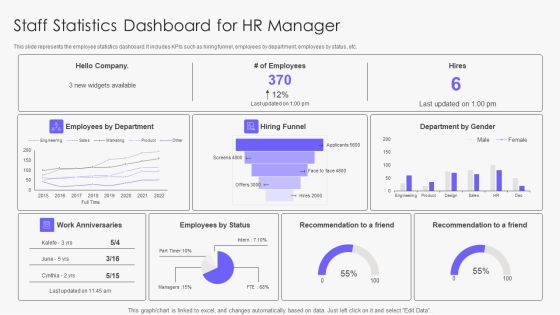
Staff Statistics Dashboard For Hr Manager Rules PDF
This slide represents the employee statistics dashboard. It includes KPIs such as hiring funnel, employees by department, employees by status, etc. Pitch your topic with ease and precision using this Staff Statistics Dashboard For Hr Manager Rules PDF. This layout presents information on Hiring Funnel, Employees By Status, Employees By Department. It is also available for immediate download and adjustment. So, changes can be made in the color, design, graphics or any other component to create a unique layout.

Yearly Staff Engagement Trend Statistics Demonstration PDF
This slide represents the line graph for analyzing employee engagement trend . It includes the statistics such as percentage of engaged and actively disengaged employees. Pitch your topic with ease and precision using this Yearly Staff Engagement Trend Statistics Demonstration PDF. This layout presents information on Team, Employees, Average. It is also available for immediate download and adjustment. So, changes can be made in the color, design, graphics or any other component to create a unique layout.

Campaign Cost Metrics With Online Advertising Overview Pictures PDF
This template covers about conversions per click and online advertising overview on monthly basis. Further, it includes cost per impression details. Pitch your topic with ease and precision using this Campaign Cost Metrics With Online Advertising Overview Pictures PDF. This layout presents information on Cost Per Conversion, Cost Per Click, Conversion Rate. It is also available for immediate download and adjustment. So, changes can be made in the color, design, graphics or any other component to create a unique layout.

Web Monthly Usage Analysis Summary Dashboard Clipart PDF
This slide depicts website usage analytics report for tracking performance. It involves number of users, sessions, bounce rate and average session duration. Pitch your topic with ease and precision using this Web Monthly Usage Analysis Summary Dashboard Clipart PDF. This layout presents information on Agency Metrics, Source Rate, Goal. It is also available for immediate download and adjustment. So, changes can be made in the color, design, graphics or any other component to create a unique layout.
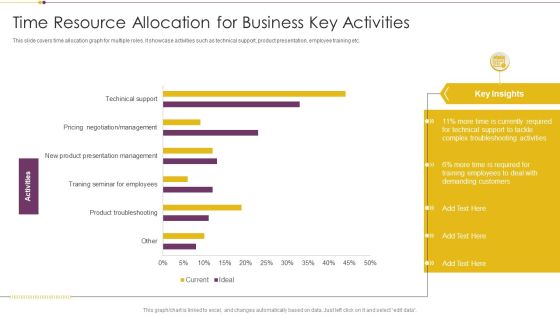
Time Resource Allocation For Business Key Activities Infographics PDF
This slide covers time allocation graph for multiple roles. It showcase activities such as technical support, product presentation, employee training etc. Pitch your topic with ease and precision using this Time Resource Allocation For Business Key Activities Infographics PDF. This layout presents information on Currently Required, Demanding Customers, Training Employees. It is also available for immediate download and adjustment. So, changes can be made in the color, design, graphics or any other component to create a unique layout.
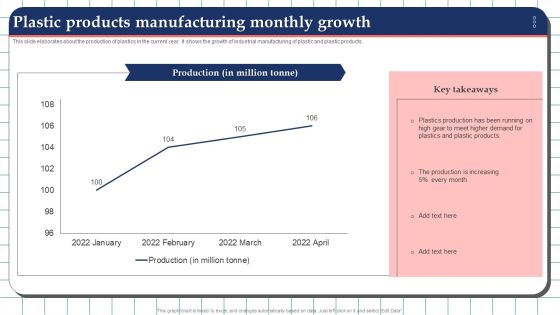
Plastic Products Manufacturing Monthly Growth Guidelines PDF
This slide elaborates about the production of plastics in the current year. It shows the growth of industrial manufacturing of plastic and plastic products. Pitch your topic with ease and precision using this Plastic Products Manufacturing Monthly Growth Guidelines PDF. This layout presents information on Production, Demand, Manufacturing Monthly Growth. It is also available for immediate download and adjustment. So, changes can be made in the color, design, graphics or any other component to create a unique layout.
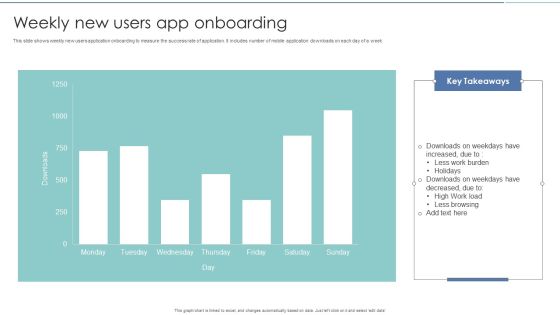
Weekly New Users App Onboarding Diagrams PDF
This slide shows weekly new users application onboarding to measure the success rate of application. It includes number of mobile application downloads on each day of a week. Pitch your topic with ease and precision using this Weekly New Users App Onboarding Diagrams PDF. This layout presents information on Weekly New Users, App Onboarding. It is also available for immediate download and adjustment. So, changes can be made in the color, design, graphics or any other component to create a unique layout.

Market Insights Of Data Center Architecture Management Elements PDF
This slide covers statistical information of data center infrastructure solutions market. It involves details such as CAGR growth, growth rate year over year and growth generated by APAC. Pitch your topic with ease and precision using this Market Insights Of Data Center Architecture Management Elements PDF. This layout presents information on Growth Rate, Market, Investors. It is also available for immediate download and adjustment. So, changes can be made in the color, design, graphics or any other component to create a unique layout.

Financial Feasibility Analysis Dashboard Depicting Income And Unemployment Analysis Download PDF
This slide illustrates economic feasibility dashboard depicting income and unemployment analysis. It contains information about household income, unemployment rate, poverty, status, etc. Pitch your topic with ease and precision using this Financial Feasibility Analysis Dashboard Depicting Income And Unemployment Analysis Download PDF. This layout presents information on Median Household Income, Unemployment Rate, Percent Living Poverty. It is also available for immediate download and adjustment. So, changes can be made in the color, design, graphics or any other component to create a unique layout.
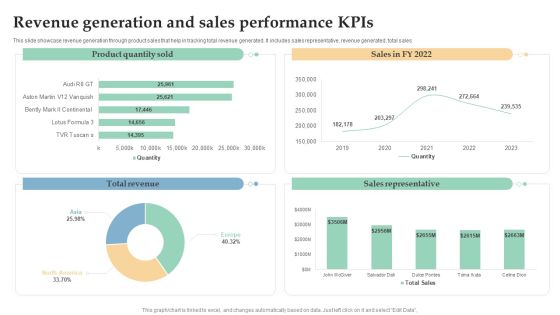
Revenue Generation And Sales Performance Kpis Ppt Inspiration Background Image PDF
This slide showcase revenue generation through product sales that help in tracking total revenue generated. It includes sales representative, revenue generated, total sales. Pitch your topic with ease and precision using this Revenue Generation And Sales Performance Kpis Ppt Inspiration Background Image PDF. This layout presents information on Total Revenue, Sales Representative, Product Quantity Sold. It is also available for immediate download and adjustment. So, changes can be made in the color, design, graphics or any other component to create a unique layout.

Dashboard To Business Success Measurement Of Email Marketing Campaign Professional PDF
This slide showcases dashboard to track effectiveness of email marketing campaign. It provides information about sent, direct, organic, paid, referral, analytics, sessions, etc. Pitch your topic with ease and precision using this Dashboard To Business Success Measurement Of Email Marketing Campaign Professional PDF. This layout presents information on Email Marketing, Analytics, Sessions. It is also available for immediate download and adjustment. So, changes can be made in the color, design, graphics or any other component to create a unique layout.

Customer Service Enterprise Workforce Dashboard Designs PDF
This slide ILLUSTRATES consumer support extended team dashboard. It provides information about average resolution time, cases transferred open cases, service level agreements SLAs, etc. Pitch your topic with ease and precision using this Customer Service Enterprise Workforce Dashboard Designs PDF. This layout presents information on Average Resolution Time, Active SLAs Breached, Average Customer. It is also available for immediate download and adjustment. So, changes can be made in the color, design, graphics or any other component to create a unique layout.

Earning Potential And Financial Forecasting Dashboard Summary PDF
This slide illustrates facts and figures related to sales figures. It includes data of monthly revenue generation FY23, yearly revenue, expected revenue generation FY23 etc. Pitch your topic with ease and precision using this Earning Potential And Financial Forecasting Dashboard Summary PDF. This layout presents information on Sales Revenue, Expected Revenue, Product. It is also available for immediate download and adjustment. So, changes can be made in the color, design, graphics or any other component to create a unique layout.
Enterprise Saas Vendor Market Share And Earnings Growth Icons PDF
This slide covers saas vendors comparative market share report. It also includes percentage of total annual revenue growth. Pitch your topic with ease and precision using this Enterprise Saas Vendor Market Share And Earnings Growth Icons PDF. This layout presents information on Annual Growth, Market Share, Revenue. It is also available for immediate download and adjustment. So, changes can be made in the color, design, graphics or any other component to create a unique layout.

Project Risk Mitigation And Management KPI Dashboard Designs PDF
The following slide highlights the project risk management dashboard to evaluate key preforming areas KPAs. It includes elements such as tasks status, progress, time, risk etc. Pitch your topic with ease and precision using this Project Risk Mitigation And Management KPI Dashboard Designs PDF. This layout presents information on Resource Actuals, Resource Allocations, Risk. It is also available for immediate download and adjustment. So, changes can be made in the color, design, graphics or any other component to create a unique layout.

Corporate Annual Financial Summary Report Ppt Portfolio Skills PDF
This slide represents annual financial statement snapshot. It covers gross profit margin, operating expenditure, operating profit, net profit margin, revenue, EBIT etc. Pitch your topic with ease and precision using this Corporate Annual Financial Summary Report Ppt Portfolio Skills PDF. This layout presents information on Operating Expenditure Ratio, Operating Profit, Net Profit Margin. It is also available for immediate download and adjustment. So, changes can be made in the color, design, graphics or any other component to create a unique layout.

Financial Summary Report Institute Showcasing Workplace Highlights Ppt Infographics Inspiration PDF
This slide represents financial institute snapshot. It showcase workplace highlights such as workplace demographics, work space, flexibility, workstation size station etc. Pitch your topic with ease and precision using this Financial Summary Report Institute Showcasing Workplace Highlights Ppt Infographics Inspiration PDF. This layout presents information on Shared Seating Arrangement, Flexibility Workplace, Workplace. It is also available for immediate download and adjustment. So, changes can be made in the color, design, graphics or any other component to create a unique layout.
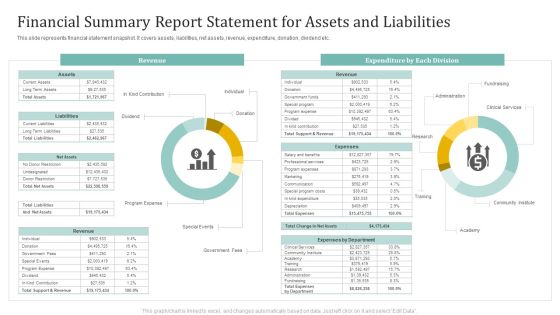
Financial Summary Report Statement For Assets And Liabilities Ppt Slides Guide PDF
This slide represents financial statement snapshot. It covers assets, liabilities, net assets, revenue, expenditure, donation, dividend etc. Pitch your topic with ease and precision using this Financial Summary Report Statement For Assets And Liabilities Ppt Slides Guide PDF. This layout presents information on Revenue, Expenditure Each Division, Fundraising. It is also available for immediate download and adjustment. So, changes can be made in the color, design, graphics or any other component to create a unique layout.
Five Years Sales Projection And Analysis Dashboard Icons PDF
This slide defines the dashboard for five years sales forecast and analysis . It includes information related to the estimated and actual sales. Pitch your topic with ease and precision using this Five Years Sales Projection And Analysis Dashboard Icons PDF. This layout presents information on Forecast Value, Forecast Accuracy, Won Opportunities. It is also available for immediate download and adjustment. So, changes can be made in the color, design, graphics or any other component to create a unique layout.
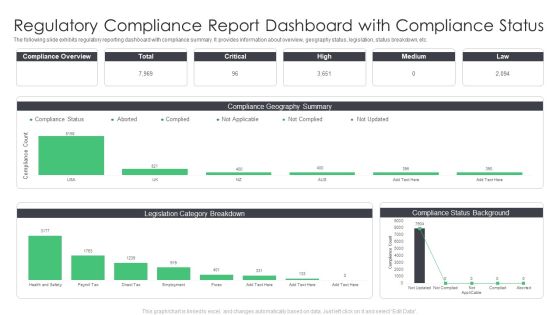
Regulatory Compliance Report Dashboard With Compliance Status Infographics PDF
The following slide exhibits regulatory reporting dashboard with compliance summary. It provides information about overview, geography status, legislation, status breakdown, etc. Pitch your topic with ease and precision using this Regulatory Compliance Report Dashboard With Compliance Status Infographics PDF. This layout presents information on Dashboard With Compliance Status, Regulatory Compliance Report. It is also available for immediate download and adjustment. So, changes can be made in the color, design, graphics or any other component to create a unique layout.

Media Company Quarterly Revenue Projection Dashboard Mockup PDF
This slide depicts estimation and actual revenue generated for a quarter. It also includes top ten customers, revenue by product and entity for media company. Pitch your topic with ease and precision using this Media Company Quarterly Revenue Projection Dashboard Mockup PDF. This layout presents information on Total Revenue, Quarterly Revenue Entity, Top 10 Customers. It is also available for immediate download and adjustment. So, changes can be made in the color, design, graphics or any other component to create a unique layout.
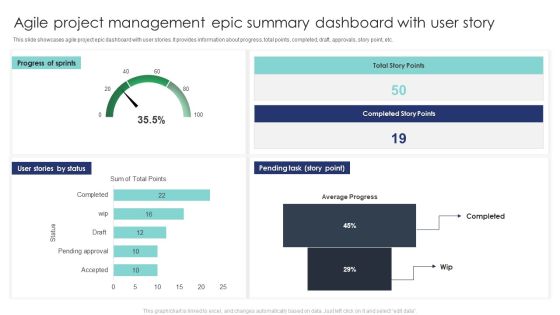
Agile Project Management Epic Summary Dashboard With User Story Formats PDF
This slide showcases agile project epic dashboard with user stories. It provides information about progress, total points, completed, draft, approvals, story point, etc. Pitch your topic with ease and precision using this Agile Project Management Epic Summary Dashboard With User Story Formats PDF. This layout presents information on Pending Tast, Progress Sprints, User Stories Status. It is also available for immediate download and adjustment. So, changes can be made in the color, design, graphics or any other component to create a unique layout.

KPI Dashboard To Measure Strategic Monetary Performance Graphics PDF
This slide shows KPI dashboard to measure strategic monetary performance. It includes gross profit margin, opex ratio, operating profit margin, revenue, etc. Pitch your topic with ease and precision using this KPI Dashboard To Measure Strategic Monetary Performance Graphics PDF. This layout presents information on Gross Profit Margin, Opex Ratio, Operating Profit Margin. It is also available for immediate download and adjustment. So, changes can be made in the color, design, graphics or any other component to create a unique layout.

Real Time Dashboard For Change Impact Analysis Ppt Pictures Layouts PDF
This slide represents business change impact assessment metric dashboard. It includes impacted organizations and groups, impact severity, impacted users, impacted jobs etc. Pitch your topic with ease and precision using this Real Time Dashboard For Change Impact Analysis Ppt Pictures Layouts PDF. This layout presents information on Impact Severity, Role Changes Impact, High, Low, Medium. It is also available for immediate download and adjustment. So, changes can be made in the color, design, graphics or any other component to create a unique layout.

Monthly Project Progress Report With Total Budget Ppt Inspiration Shapes PDF
This slide showcases monthly project status with total budget. It provides information about project understanding, design, development, internal and external testing, deployment, etc. Pitch your topic with ease and precision using this Monthly Project Progress Report With Total Budget Ppt Inspiration Shapes PDF. This layout presents information on Pending, Completed, Project Understanding. It is also available for immediate download and adjustment. So, changes can be made in the color, design, graphics or any other component to create a unique layout.

Customer NPS Metric With Revenue Growth Impact Ppt Show Portrait PDF
This slide illustrates net promoter score with revenue growth impact. It provides information about market average NPS, respondents, promoter, detractor, passive, etc. Pitch your topic with ease and precision using this Customer NPS Metric With Revenue Growth Impact Ppt Show Portrait PDF. This layout presents information on Promoter, Detractor, Passive. It is also available for immediate download and adjustment. So, changes can be made in the color, design, graphics or any other component to create a unique layout.

Asset Assessment Dashboard Indicating Revenue And Productivity Infographics PDF
This slide showcases asset valuation dashboard highlighting company revenue and productivity index. It provides information about geographical evaluation, development cost, commercial cost, etc.Pitch your topic with ease and precision using this Asset Assessment Dashboard Indicating Revenue And Productivity Infographics PDF. This layout presents information on Projected Development, Productivity Index, Geographical Evaluation. It is also available for immediate download and adjustment. So, changes can be made in the color, design, graphics or any other component to create a unique layout.

Asset Assessment Dashboard With ROI Metrics Topics PDF
This slide illustrates asset valuation dashboard with return on investment metrics. It provides information about internal rate of return, investment type, deal size, asset type, Pitch your topic with ease and precision using this Asset Assessment Dashboard With ROI Metrics Topics PDF. This layout presents information on Investment Amount, Asset Valuation, Internal Return. It is also available for immediate download and adjustment. So, changes can be made in the color, design, graphics or any other component to create a unique layout.
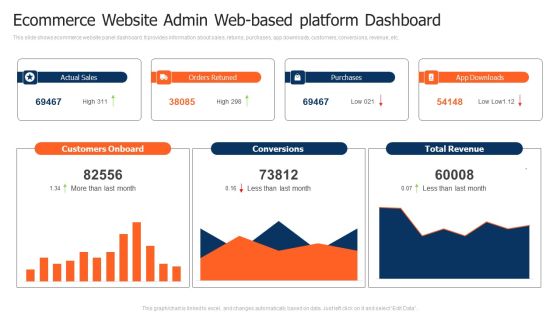
Ecommerce Website Admin Web Based Platform Dashboard Pictures PDF
This slide shows ecommerce website panel dashboard. It provides information about sales, returns, purchases, app downloads, customers, conversions, revenue, etc. Pitch your topic with ease and precision using this Ecommerce Website Admin Web Based Platform Dashboard Pictures PDF. This layout presents information on Customers Onboard, Purchases, Total Revenue. It is also available for immediate download and adjustment. So, changes can be made in the color, design, graphics or any other component to create a unique layout.

Dashboard For Business Operational Activities Operations Administration Designs PDF
This slide represents dashboard for management of business operational activities. It includes marketing, product, human resource, sales, finance, services and support. Pitch your topic with ease and precision using this Dashboard For Business Operational Activities Operations Administration Designs PDF. This layout presents information on Marketing, Product, Human Resources. It is also available for immediate download and adjustment. So, changes can be made in the color, design, graphics or any other component to create a unique layout.

Kpi Dashboard To Track Business To Business E Commerce Performance Slides PDF
This slide shows KPI dashboard of online B2B trade performance. It includes sales, purchases and orders amount. Pitch your topic with ease and precision using this Kpi Dashboard To Track Business To Business E Commerce Performance Slides PDF. This layout presents information on Dashboard, Track Business, Performance. It is also available for immediate download and adjustment. So, changes can be made in the color, design, graphics or any other component to create a unique layout.

Cost Reduction Bar Graph For Organization Optimization Ppt Inspiration Vector PDF
This slide represent cost saving with benefits in an organization and areas where more efficiencies are utilized. It includes travel, administrative and hiring. Pitch your topic with ease and precision using this Cost Reduction Bar Graph For Organization Optimization Ppt Inspiration Vector PDF. This layout presents information on Total Cost Benefits, Promoting Employees, Providing Perks. It is also available for immediate download and adjustment. So, changes can be made in the color, design, graphics or any other component to create a unique layout.
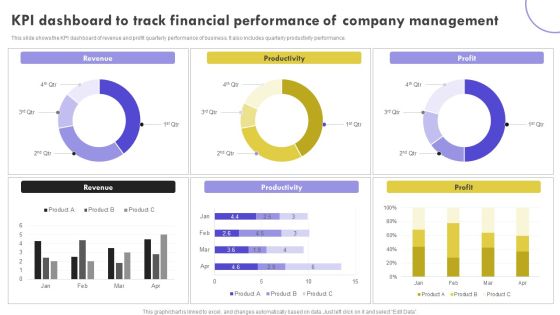
KPI Dashboard To Track Financial Performance Of Company Management Clipart PDF
This slide shows the KPI dashboard of revenue and profit quarterly performance of business. It also includes quarterly productivity performance. Pitch your topic with ease and precision using this KPI Dashboard To Track Financial Performance Of Company Management Clipart PDF. This layout presents information on Revenue, Productivity, Profit. It is also available for immediate download and adjustment. So, changes can be made in the color, design, graphics or any other component to create a unique layout.

Target Market Assessment With Audience Demographics Inspiration PDF
This slide covers the dashboard for target audience analysis. It includes demographics based on gender, age, region, population density, household structure, and income. Pitch your topic with ease and precision using this Target Market Assessment With Audience Demographics Inspiration PDF. This layout presents information on Target Market Assessment, Audience Demographics . It is also available for immediate download and adjustment. So, changes can be made in the color, design, graphics or any other component to create a unique layout.

Employee Compensation And Salary Dashboard By Gender And Location Download PDF
The following slide showcases compensation dashboard that assist in analyzing your companys employee compensation costs. It includes total salary, bonus, commission, employee and sick days. Pitch your topic with ease and precision using this Employee Compensation And Salary Dashboard By Gender And Location Download PDF. This layout presents information on Employee By Location, Location, Employee. It is also available for immediate download and adjustment. So, changes can be made in the color, design, graphics or any other component to create a unique layout.

Company Incident Management Dashboard With Priority Microsoft PDF
The following slide showcases workplace incident management and classification dashboard. It includes active incident priorities, support groups and problems by department. Pitch your topic with ease and precision using this Company Incident Management Dashboard With Priority Microsoft PDF. This layout presents information on Active Incident Classifications, Active Incident Support, Active Incident Priorities . It is also available for immediate download and adjustment. So, changes can be made in the color, design, graphics or any other component to create a unique layout.
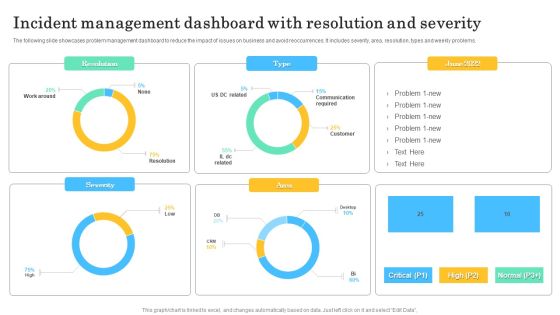
Incident Management Dashboard With Resolution And Severity Guidelines PDF
The following slide showcases problem management dashboard to reduce the impact of issues on business and avoid reoccurrences. It includes severity, area, resolution, types and weekly problems. Pitch your topic with ease and precision using this Incident Management Dashboard With Resolution And Severity Guidelines PDF. This layout presents information on Resolution, Severity, Area. It is also available for immediate download and adjustment. So, changes can be made in the color, design, graphics or any other component to create a unique layout.
Email Marketing Campaign Kpis Tracking Dashboard Graphics PDF
This slide shows key performance indicators KPI dashboard for measuring effectiveness of email campaigns. It provides information about sent, delivered, opens, clicks, unsubscribed, bounces, complaints, etc. Pitch your topic with ease and precision using this Email Marketing Campaign Kpis Tracking Dashboard Graphics PDF. This layout presents information on Email Marketing Campaign, Tracking Dashboard. It is also available for immediate download and adjustment. So, changes can be made in the color, design, graphics or any other component to create a unique layout.

Dashboard For Project Stakeholder Engagement And Management Metrics Brochure PDF
This slide showcases a dashboard for project stakeholders illustrating KPIs for measurement. It includes types of stakeholders, stakeholder receptiveness etc. Pitch your topic with ease and precision using this Dashboard For Project Stakeholder Engagement And Management Metrics Brochure PDF. This layout presents information on Types Of Stakeholders, Receptiveness, Number Of Stakeholders. It is also available for immediate download and adjustment. So, changes can be made in the color, design, graphics or any other component to create a unique layout.

Public Healthcare Administration Dashboard For Hospital Guidelines PDF
This slide illustrates facts and figures related to patient healthcare in a hospital. It includes metrics such as patient statistics, latest patients, total patients, total staff, etc.Pitch your topic with ease and precision using this Public Healthcare Administration Dashboard For Hospital Guidelines PDF. This layout presents information on Total Patients, Total Rooms, Patient Statistics. It is also available for immediate download and adjustment. So, changes can be made in the color, design, graphics or any other component to create a unique layout.
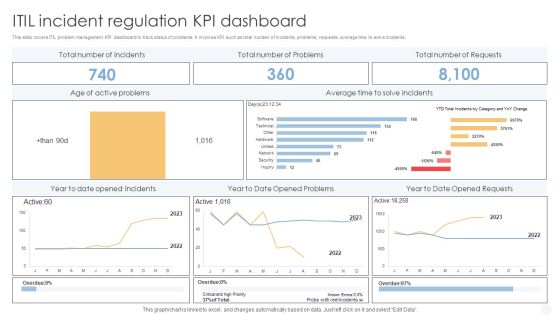
ITIL Incident Regulation Kpi Dashboard Background PDF
This slide covers ITIL problem management KPI dashboard to track status of problems. It involves KPI such as total number of incidents, problems, requests, average time to solve incidents.Pitch your topic with ease and precision using this ITIL Incident Regulation Kpi Dashboard Background PDF. This layout presents information on Active Problems, Average Incidents, Opened Problems. It is also available for immediate download and adjustment. So, changes can be made in the color, design, graphics or any other component to create a unique layout.

Engineering Performance Metrics Dashboard For Measuring Performance Download PDF
This slide covers engineering KPI dashboard to measure performance. It involves KPIs such as cycle time breakdown, risk breakdown, activities on focus and timeline. Pitch your topic with ease and precision using this Engineering Performance Metrics Dashboard For Measuring Performance Download PDF. This layout presents information on Average, Risk Breakdown, Measuring Performance. It is also available for immediate download and adjustment. So, changes can be made in the color, design, graphics or any other component to create a unique layout.
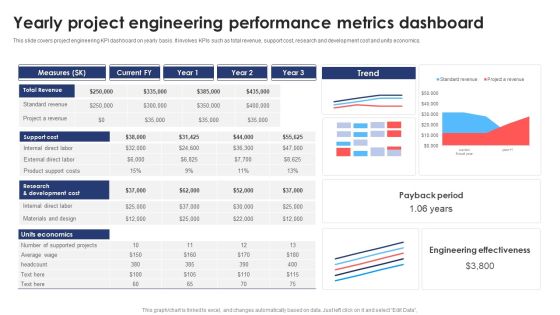
Yearly Project Engineering Performance Metrics Dashboard Information PDF
This slide covers project engineering KPI dashboard on yearly basis. It involves KPIs such as total revenue, support cost, research and development cost and units economics. Pitch your topic with ease and precision using this Yearly Project Engineering Performance Metrics Dashboard Information PDF. This layout presents information on Support Cost, Revenue, Measures. It is also available for immediate download and adjustment. So, changes can be made in the color, design, graphics or any other component to create a unique layout.

Monthly Sales Capability Statistical Data Background PDF
This slide illustrates graphical representation and tabular data of forecasted and cumulative sales to evaluate companys future targets and achievements. It includes month wise revenue generation. Pitch your topic with ease and precision using this Monthly Sales Capability Statistical Data Background PDF. This layout presents information on Monthly Sales, Capability Statistical Data. It is also available for immediate download and adjustment. So, changes can be made in the color, design, graphics or any other component to create a unique layout.

Scrum Project Sprint Report Guidelines PDF
This slide illustrates sprint summary overview of scrum project management. It includes estimate, actual, difference from estimate, percent difference, goal percent difference, no. of tasks, etc. Pitch your topic with ease and precision using this Scrum Project Sprint Report Guidelines PDF. This layout presents information on Scrum Project, Sprint Report. It is also available for immediate download and adjustment. So, changes can be made in the color, design, graphics or any other component to create a unique layout.

Sprint Metrics And Backlog Summary Report Brochure PDF
This slide illustrates summary of Jira project management sprint testing. It includes sprint highlights, overall issues and risks, retrospective points, sprint spillover, etc. Pitch your topic with ease and precision using this Sprint Metrics And Backlog Summary Report Brochure PDF. This layout presents information on Sprint Metrics And Backlog, Summary Report. It is also available for immediate download and adjustment. So, changes can be made in the color, design, graphics or any other component to create a unique layout.

Annual Diversified Investment Portfolio Report Introduction PDF
This slide illustrates report on performance of a diversified investment portfolio. It includes investments like UK stocks, foreign stocks, bonds with average annual return, annualized volatility etc.Pitch your topic with ease and precision using this Annual Diversified Investment Portfolio Report Introduction PDF. This layout presents information on Foreign Stocks, Month Return, Term Investments. It is also available for immediate download and adjustment. So, changes can be made in the color, design, graphics or any other component to create a unique layout.

Business Performance Report Across Diversified Segments Microsoft PDF
This slide illustrates report on business performance on different segments . It includes order won, replacement business, new business across different products etc.Pitch your topic with ease and precision using this Business Performance Report Across Diversified Segments Microsoft PDF. This layout presents information on Replacement Business, New Business, Replacement Business. It is also available for immediate download and adjustment. So, changes can be made in the color, design, graphics or any other component to create a unique layout.
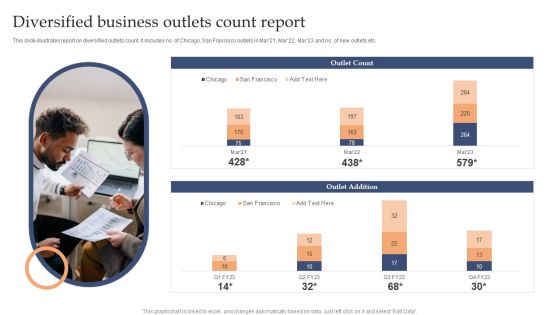
Diversified Business Outlets Count Report Background PDF
This slide illustrates report on diversified outlets count. It includes no. of Chicago, San Francisco outlets in Mar21, Mar22, Mar23 and no. of new outlets etc.Pitch your topic with ease and precision using this Diversified Business Outlets Count Report Background PDF. This layout presents information on Outlet Count, Outlet Addition, Chicago. It is also available for immediate download and adjustment. So, changes can be made in the color, design, graphics or any other component to create a unique layout.
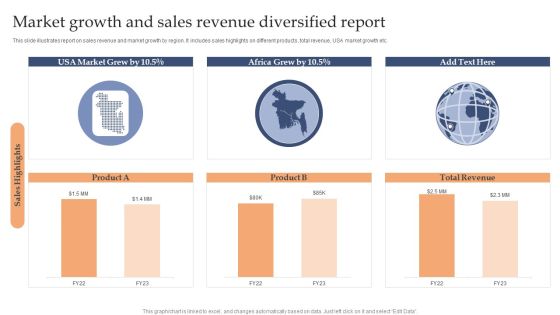
Market Growth And Sales Revenue Diversified Report Sample PDF
This slide illustrates report on sales revenue and market growth by region. It includes sales highlights on different products, total revenue, USA market growth etc.Pitch your topic with ease and precision using this Market Growth And Sales Revenue Diversified Report Sample PDF. This layout presents information on Market Grew, Africa Grew, Total Revenue. It is also available for immediate download and adjustment. So, changes can be made in the color, design, graphics or any other component to create a unique layout.
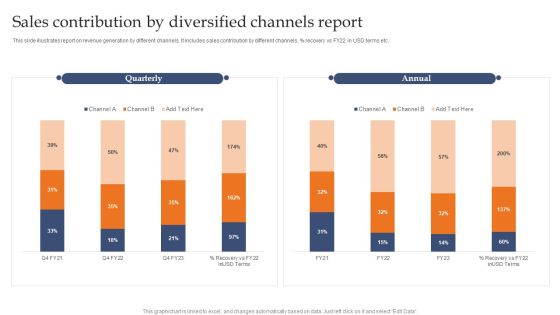
Sales Contribution By Diversified Channels Report Demonstration PDF
This slide illustrates report on revenue generation by different channels. It includes sales contribution by different channels, precent recovery vs FY22 in USD terms etc.Pitch your topic with ease and precision using this Sales Contribution By Diversified Channels Report Demonstration PDF. This layout presents information on Quarterly, Annual, Channel. It is also available for immediate download and adjustment. So, changes can be made in the color, design, graphics or any other component to create a unique layout.
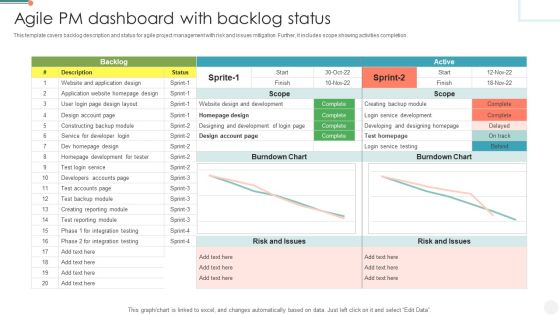
Agile PM Dashboard With Backlog Status Summary PDF
This template covers backlog description and status for agile project management with risk and issues mitigation. Further, it includes scope showing activities completion. Pitch your topic with ease and precision using this Agile PM Dashboard With Backlog Status Summary PDF. This layout presents information on Service For Developer Login, Risk And Issues, Service Development. It is also available for immediate download and adjustment. So, changes can be made in the color, design, graphics or any other component to create a unique layout.

Quarterly Information Dashboard For Website Performance Portrait PDF
This slide displays KPI dashboard to analyze website performance and overall experience of online customers. It includes details about loading speed, internal links, views and average time. Pitch your topic with ease and precision using this Quarterly Information Dashboard For Website Performance Portrait PDF. This layout presents information on Quarterly Information, Dashboard For Website Performance. It is also available for immediate download and adjustment. So, changes can be made in the color, design, graphics or any other component to create a unique layout.

Annual Graph For Human Resource Recruitment Trends Summary PDF
The slide shows the HR recruitment trend graph from year 2018 to 2022. It includes number of employees hired per year along with key takeaways. Pitch your topic with ease and precision using this Annual Graph For Human Resource Recruitment Trends Summary PDF. This layout presents information on Employee Recruitment, Rise Employee, Economic Reforms. It is also available for immediate download and adjustment. So, changes can be made in the color, design, graphics or any other component to create a unique layout.

Annual Sales Growth Trend Of The Product Summary PDF
The slide shows an increasing trend year-on-year in the sales of the product. It include the sales from 2011 to 2021 with key takeaways.Pitch your topic with ease and precision using this Annual Sales Growth Trend Of The Product Summary PDF. This layout presents information on Increase Sales, Company Growing, Rise Population. It is also available for immediate download and adjustment. So, changes can be made in the color, design, graphics or any other component to create a unique layout.

Revenue Generated Through Personnel Performance Evaluation Report Mockup PDF
This template covers about monthly leads, deals closed in month and revenue generated in whole month . Further, it includes revenue generated by account manager.Pitch your topic with ease and precision using this Revenue Generated Through Personnel Performance Evaluation Report Mockup PDF. This layout presents information on Monthly Lead, Team Activities, Account Manage. It is also available for immediate download and adjustment. So, changes can be made in the color, design, graphics or any other component to create a unique layout.

Change Requests Management And Management Dashboard Clipart PDF
This slide illustrates facts and figures related to managing change requests. It includes request statistics, latest change requests, status by assignee, status by priority, etc. Pitch your topic with ease and precision using this Change Requests Management And Management Dashboard Clipart PDF. This layout presents information on Status By Assignee, Status By Priority, Request Statistics. It is also available for immediate download and adjustment. So, changes can be made in the color, design, graphics or any other component to create a unique layout.

Internal Audit Metrics Dashboard And Status Ppt Layouts Graphic Images PDF
This slide covers the key performance indicator dashboard and status for internal audit. It includes information related to the audit status and risk rating. Pitch your topic with ease and precision using this Internal Audit Metrics Dashboard And Status Ppt Layouts Graphic Images PDF. This layout presents information on Audit Status, Risk Rating, Auditable Entry. It is also available for immediate download and adjustment. So, changes can be made in the color, design, graphics or any other component to create a unique layout.
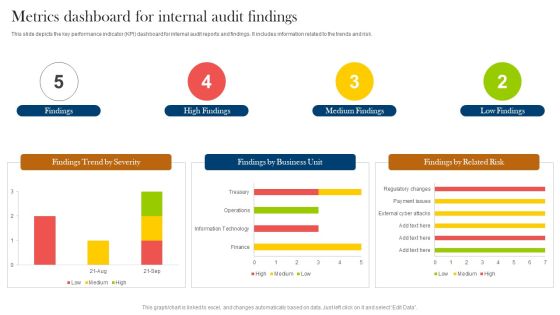
Metrics Dashboard For Internal Audit Findings Ppt Styles Gallery PDF
This slide depicts the key performance indicator KPI dashboard for internal audit reports and findings. It includes information related to the trends and risk. Pitch your topic with ease and precision using this Metrics Dashboard For Internal Audit Findings Ppt Styles Gallery PDF. This layout presents information on Findings, High Findings, Medium Findings, Low Findings. It is also available for immediate download and adjustment. So, changes can be made in the color, design, graphics or any other component to create a unique layout.

Multiplayer Startup Online Business Simulation Dashboard Demonstration PDF
This slide showcases multiplier startup business simulation dashboard. It provides information about individuals, statistics, team processes, adoption, effectiveness, meetings, alignment, communication, etc. Pitch your topic with ease and precision using this Multiplayer Startup Online Business Simulation Dashboard Demonstration PDF. This layout presents information on Individuals, Team Processes, Statistics. It is also available for immediate download and adjustment. So, changes can be made in the color, design, graphics or any other component to create a unique layout.

Online Business Simulation Activity Dashboard With Quarterly Performance Details Guidelines PDF
This slide shows business simulation tasks with performance information. It provides information about financial and production advisor comments, revenue, rivals, profit, strategies, etc. Pitch your topic with ease and precision using this Online Business Simulation Activity Dashboard With Quarterly Performance Details Guidelines PDF. This layout presents information on Financial Adviser, Production Adviser, Revenue. It is also available for immediate download and adjustment. So, changes can be made in the color, design, graphics or any other component to create a unique layout.

Weekly Sales Performance KPI Dashboard For Revenue Generation Brochure PDF
The following slide exhibits dashboard to maintain revenue and management under control. It presents information related to profits, cross selling, costs, etc. Pitch your topic with ease and precision using this Weekly Sales Performance KPI Dashboard For Revenue Generation Brochure PDF. This layout presents information on Total Sales, Revenue, Profit, Cost. It is also available for immediate download and adjustment. So, changes can be made in the color, design, graphics or any other component to create a unique layout.
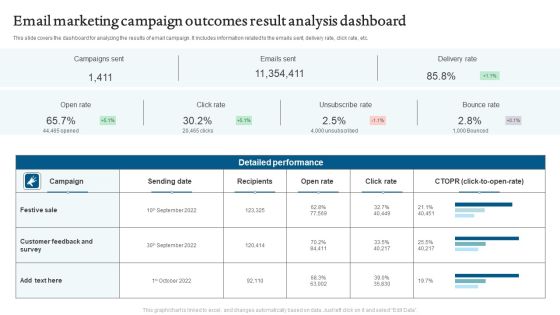
Email Marketing Campaign Outcomes Result Analysis Dashboard Mockup PDF
This slide covers the dashboard for analyzing the email campaign metrics. It includes information related to engagement a key performance indicator KPIs. Pitch your topic with ease and precision using this Email Marketing Campaign Outcomes Result Analysis Dashboard Mockup PDF. This layout presents information on Campaigns Sent, Emails Sent, Delivery Rate. It is also available for immediate download and adjustment. So, changes can be made in the color, design, graphics or any other component to create a unique layout.
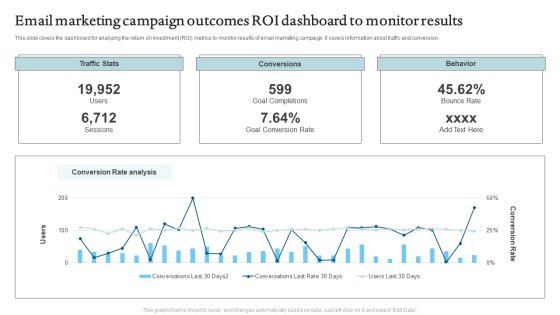
Email Marketing Campaign Outcomes ROI Dashboard To Monitor Results Formats PDF
This slide depicts the dashboard for analyzing the marketing results and campaign performance. It includes information related email sent, delivered, conversions, etc. Pitch your topic with ease and precision using this Email Marketing Campaign Outcomes ROI Dashboard To Monitor Results Formats PDF. This layout presents information on Traffic Stats, Conversions, Behavior. It is also available for immediate download and adjustment. So, changes can be made in the color, design, graphics or any other component to create a unique layout.

US Economic Survey Analysis Representing Household Spending Slides PDF
This slide shows united states economic survey showing residential population spends. It provides information about food and beverages, consumption, maintenance, education, transportation, etc. Pitch your topic with ease and precision using this US Economic Survey Analysis Representing Household Spending Slides PDF. This layout presents information on US Economic Survey, Analysis Representing Household. It is also available for immediate download and adjustment. So, changes can be made in the color, design, graphics or any other component to create a unique layout.
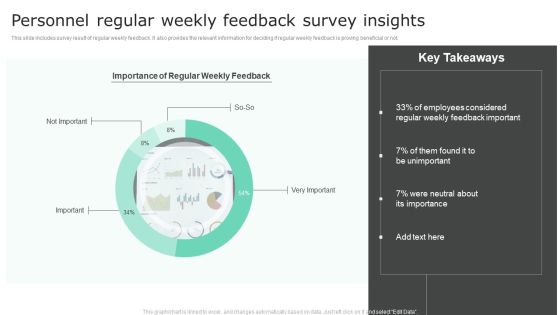
Personnel Regular Weekly Feedback Survey Insights Structure PDF
This slide includes survey result of regular weekly feedback. It also provides the relevant information for deciding if regular weekly feedback is proving beneficial or not. Pitch your topic with ease and precision using this Personnel Regular Weekly Feedback Survey Insights Structure PDF. This layout presents information on Feedback Important, Survey Insights. It is also available for immediate download and adjustment. So, changes can be made in the color, design, graphics or any other component to create a unique layout.

Personnel Survey Insights Analysis Dashboard Inspiration PDF
This slide includes a dashboard of employees survey result significant for understanding employee engagement. It is also important to determine the motivation levels of the employees. Pitch your topic with ease and precision using this Personnel Survey Insights Analysis Dashboard Inspiration PDF. This layout presents information on Employee Survey Result, Overall Survey Results. It is also available for immediate download and adjustment. So, changes can be made in the color, design, graphics or any other component to create a unique layout.

Brand Awareness And Popularity Assessment Dashboard Topics PDF
This slide illustrates graphical representation of facts and figures related with brand awareness. It includes popularity ratings, brand awareness graph, people ratings of brand slogans etc. Pitch your topic with ease and precision using thisBrand Awareness And Popularity Assessment Dashboard Topics PDF. This layout presents information on Customers By Age, Brand Ambassador Analysis, Brand Awareness. It is also available for immediate download and adjustment. So, changes can be made in the color, design, graphics or any other component to create a unique layout.

Artificial Intelligence Capabilities And Applications In Retail Sector Themes PDF
This slide illustrates statistics related to AI application in retail industry. It includes AI types like machine learning, chatbots, natural language processing and swarm intelligence etc. Pitch your topic with ease and precision using this Artificial Intelligence Capabilities And Applications In Retail Sector Themes PDF. This layout presents information on Capabilities And Applications, Retail Sector. It is also available for immediate download and adjustment. So, changes can be made in the color, design, graphics or any other component to create a unique layout.

Artificial Intelligence Sales Capabilities And Revenue Dashboard Portrait PDF
This slide illustrates artificial intelligence and business intelligence corporate revenue dashboard. It includes pipeline for Aug 2023, revenue for Sep 2023, AI augmented opportunities etc. Pitch your topic with ease and precision using this Artificial Intelligence Sales Capabilities And Revenue Dashboard Portrait PDF. This layout presents information on Sales Capabilities, Revenue Dashboard. It is also available for immediate download and adjustment. So, changes can be made in the color, design, graphics or any other component to create a unique layout.

Social Media Artificial Intelligence Data Visualization Capabilities Dashboard Inspiration PDF
This slide illustrates graphical representation of visualization abilities of artificial intelligence on social media. It includes total impressions, total clicks, performance review etc. Pitch your topic with ease and precision using this Social Media Artificial Intelligence Data Visualization Capabilities Dashboard Inspiration PDF. This layout presents information on Artificial Intelligence, Data Visualization Capabilities. It is also available for immediate download and adjustment. So, changes can be made in the color, design, graphics or any other component to create a unique layout.

Client Analytics Relationship Management Dashboard With Conversion Funnel Demonstration PDF
The following slide depicts the key performing areas in lead management. It includes traffic, potential customers, category wise closing percentages, financial insights etc. Pitch your topic with ease and precision using this Client Analytics Relationship Management Dashboard With Conversion Funnel Demonstration PDF. This layout presents information on Potential Customers, Social Media Followers, Social Media Subscribers. It is also available for immediate download and adjustment. So, changes can be made in the color, design, graphics or any other component to create a unique layout.

Client Support KPI Dashboard Rules PDF
This slide shows key performance indicators of customer service delivery. It includes service level, request volume, cost of revenue, customer satisfaction, customer retention, etc. Pitch your topic with ease and precision using this Client Support KPI Dashboard Rules PDF. This layout presents information on Customer Retention, Cost Per Support, Average Issue Solving Time. It is also available for immediate download and adjustment. So, changes can be made in the color, design, graphics or any other component to create a unique layout.

Client Support Management Dashboard Designs PDF
This slide shows KPI dashboard of customer service delivery management. It includes key performance indicators such as total support requests received, support status, total solved and unsolved issues, etc. Pitch your topic with ease and precision using this Client Support Management Dashboard Designs PDF. This layout presents information on Client Support, Management Dashboard. It is also available for immediate download and adjustment. So, changes can be made in the color, design, graphics or any other component to create a unique layout.

Client Support Resolution Dashboard Graphics PDF
This slide shows dashboard which can be used by organization in customer service resolution delivery. It includes KPIs such as first call resolution, unsolved issues, average response time, etc. Pitch your topic with ease and precision using this Client Support Resolution Dashboard Graphics PDF. This layout presents information on Client Support, Resolution Dashboard. It is also available for immediate download and adjustment. So, changes can be made in the color, design, graphics or any other component to create a unique layout.
KPI Dashboard Of Client Support Icons PDF
This slide shows customer service delivery key performance indicators dashboard. It includes KPIs such as issues received, average time to close issues, first call resolution, top performers, etc. Pitch your topic with ease and precision using this KPI Dashboard Of Client Support Icons PDF. This layout presents information on KPI Dashboard, Client Support. It is also available for immediate download and adjustment. So, changes can be made in the color, design, graphics or any other component to create a unique layout.
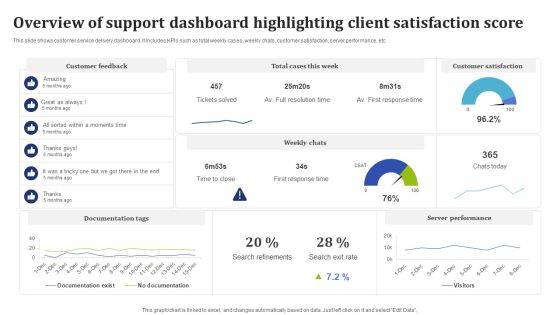
Overview Of Support Dashboard Highlighting Client Satisfaction Score Guidelines PDF
This slide shows customer service delivery dashboard. It includes KPIs such as total weekly cases, weekly chats, customer satisfaction, server performance, etc. Pitch your topic with ease and precision using this Overview Of Support Dashboard Highlighting Client Satisfaction Score Guidelines PDF. This layout presents information on Documentation Tags, Server Performance, Customer Satisfaction. It is also available for immediate download and adjustment. So, changes can be made in the color, design, graphics or any other component to create a unique layout.
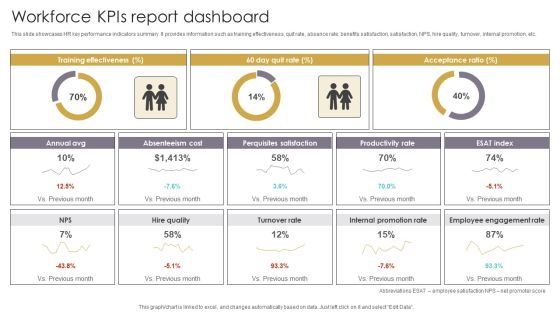
Workforce Kpis Report Dashboard Slides PDF
This slide showcases HR key performance indicators summary. It provides information such as training effectiveness, quit rate, absence rate, benefits satisfaction, satisfaction, NPS, hire quality, turnover, internal promotion, etc. Pitch your topic with ease and precision using this Workforce Kpis Report Dashboard Slides PDF. This layout presents information on Acceptance Ratio, Absenteeism Cost, Perquisites Satisfaction. It is also available for immediate download and adjustment. So, changes can be made in the color, design, graphics or any other component to create a unique layout.

Workforce Report Dashboard For Talent Management Template PDF
This slide showcases human resources report dashboard for managing workforce. It provides information such as monthly salary, vacancies, NPS, hiring stats, ratings, turnover rate, etc. Pitch your topic with ease and precision using this Workforce Report Dashboard For Talent Management Template PDF. This layout presents information on Employees, Training Costs, Talent Turnover Rate. It is also available for immediate download and adjustment. So, changes can be made in the color, design, graphics or any other component to create a unique layout.
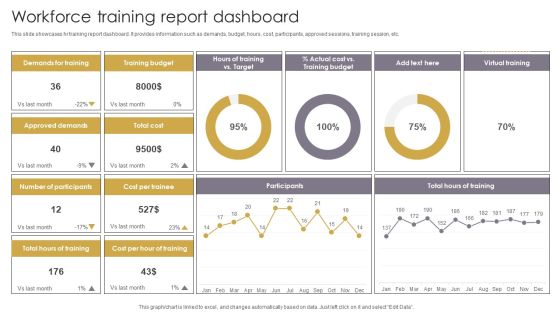
Workforce Training Report Dashboard Elements PDF
This slide showcases hr training report dashboard. It provides information such as demands, budget, hours, cost, participants, approved sessions, training session, etc. Pitch your topic with ease and precision using this Workforce Training Report Dashboard Elements PDF. This layout presents information on Training Budget, Demands For Training, Approved Demands. It is also available for immediate download and adjustment. So, changes can be made in the color, design, graphics or any other component to create a unique layout.

Project Limitations Dashboard With Cost And Time Graphics PDF
This slide showcases dashboard to track key metrics necessary for project success and effective management of constraints. It includes elements such as health, tasks, progress, workload, etc. Pitch your topic with ease and precision using this Project Limitations Dashboard With Cost And Time Graphics PDF. This layout presents information on Time, Workload, Tasks, Progress. It is also available for immediate download and adjustment. So, changes can be made in the color, design, graphics or any other component to create a unique layout.

Return On Investment From Email Marketing Campaign Themes PDF
This slide shows return on per dollar marketing investment spend. It includes email, catalogs, search engine optimization, mobile, etc. Pitch your topic with ease and precision using this Return On Investment From Email Marketing Campaign Themes PDF. This layout presents information on Email Marketing, Email Roi, Reducing Email Bounce Rate. It is also available for immediate download and adjustment. So, changes can be made in the color, design, graphics or any other component to create a unique layout.

KPI Dashboard Showcasing Product Management Guidelines PDF
This slide showcases dashboard providing product development team performance status with determined KPIs. It provides details such as product development team score, average result scores and result KPIs. Pitch your topic with ease and precision using this KPI Dashboard Showcasing Product Management Guidelines PDF. This layout presents information on Average Rating, Innovation, Design. It is also available for immediate download and adjustment. So, changes can be made in the color, design, graphics or any other component to create a unique layout.
Service Desk Tracker Sheet To Monitor Status Of Ticket Professional PDF
This slide showcases tracker sheet that includes ticket details. It includes ticket number, priority, description, reported date and responsible person. Pitch your topic with ease and precision using this Service Desk Tracker Sheet To Monitor Status Of Ticket Professional PDF. This layout presents information on Ticket Number, Description, Responsible Person. It is also available for immediate download and adjustment. So, changes can be made in the color, design, graphics or any other component to create a unique layout.
New Commodity Development Assessment Metrics Icons PDF
The following slide highlights the key metrics to evaluate product performance. It includes elements such as product wise revenue, time to the market etc.Pitch your topic with ease and precision using this New Commodity Development Assessment Metrics Icons PDF. This layout presents information on Annual Product, Wise Revenue, Shown Continuous. It is also available for immediate download and adjustment. So, changes can be made in the color, design, graphics or any other component to create a unique layout.

Budget Assessment Dashboard With Total Incomes And Expenses Information PDF
The following slides shows budget portfolio dashboard with incomes and expenses. It includes information about accounts payable, actual income, month, balance, Pitch your topic with ease and precision using this Budget Assessment Dashboard With Total Incomes And Expenses Information PDF. This layout presents information on Actual Income, Actual Expenses. It is also available for immediate download and adjustment. So, changes can be made in the color, design, graphics or any other component to create a unique layout.
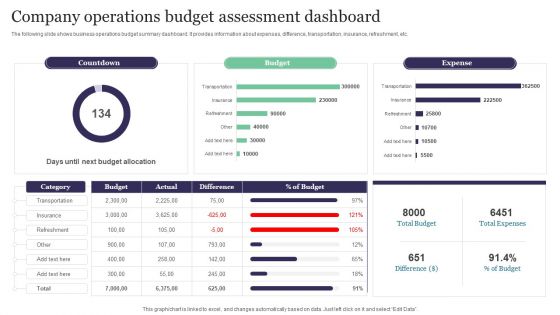
Company Operations Budget Assessment Dashboard Template PDF
The following slide shows business operations budget summary dashboard. It provides information about expenses, difference, transportation, insurance, refreshment, etc. Pitch your topic with ease and precision using this Company Operations Budget Assessment Dashboard Template PDF. This layout presents information on Countdown, Budget, Expense. It is also available for immediate download and adjustment. So, changes can be made in the color, design, graphics or any other component to create a unique layout.
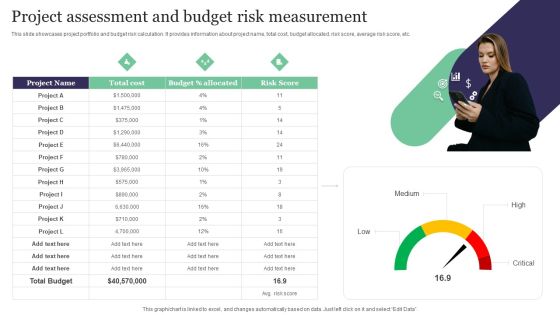
Project Assessment And Budget Risk Measurement Pictures PDF
This slide showcases project portfolio and budget risk calculation. It provides information about project name, total cost, budget allocated, risk score, average risk score, etc. Pitch your topic with ease and precision using this Project Assessment And Budget Risk Measurement Pictures PDF. This layout presents information on Project Assessment, Budget Risk, Measurement. It is also available for immediate download and adjustment. So, changes can be made in the color, design, graphics or any other component to create a unique layout.
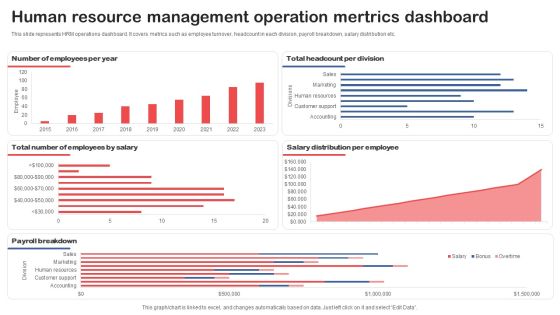
Human Resource Management Operation Mertrics Dashboard Background PDF
This slide represents HRM operations dashboard. It covers metrics such as employee turnover, headcount in each division, payroll breakdown, salary distribution etc. Pitch your topic with ease and precision using thisHuman Resource Management Operation Mertrics Dashboard Background PDF. This layout presents information on Number Of Employees, Headcount Per Division, Employees By Salary. It is also available for immediate download and adjustment. So, changes can be made in the color, design, graphics or any other component to create a unique layout.
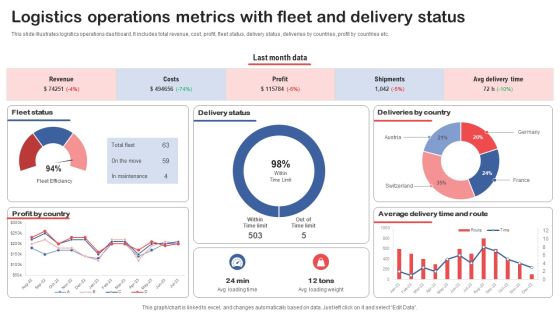
Logistics Operations Metrics With Fleet And Delivery Status Slides PDF
This slide illustrates logistics operations dashboard. It includes total revenue, cost, profit, fleet status, delivery status, deliveries by countries, profit by countries etc. Pitch your topic with ease and precision using this Logistics Operations Metrics With Fleet And Delivery Status Slides PDF. This layout presents information on Fleet Status, Delivery Status, Deliveries By Country. It is also available for immediate download and adjustment. So, changes can be made in the color, design, graphics or any other component to create a unique layout.
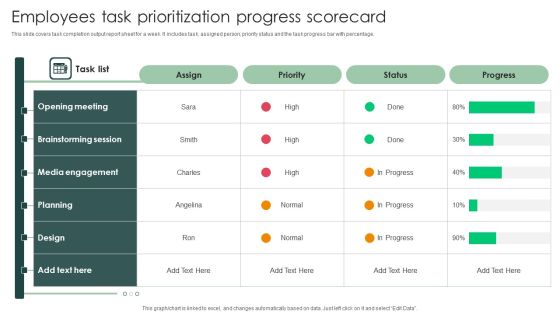
Employees Task Prioritization Progress Scorecard Download PDF
This slide covers task completion output report sheet for a week. It includes task, assigned person, priority status and the task progress bar with percentage.Pitch your topic with ease and precision using this Employees Task Prioritization Progress Scorecard Download PDF. This layout presents information on Communication Skills Development, Manager Training, Area Sales . It is also available for immediate download and adjustment. So, changes can be made in the color, design, graphics or any other component to create a unique layout.

Project Prioritization Progress Scorecard With Assigned Employees Diagrams PDF
This slide covers report of multiple projects with assigned project manager. It also includes priority status, time frame, completion bar along with variances found. Pitch your topic with ease and precision using this Project Prioritization Progress Scorecard With Assigned Employees Diagrams PDF. This layout presents information on Project Prioritization, Progress Scorecard, Assigned Employees. It is also available for immediate download and adjustment. So, changes can be made in the color, design, graphics or any other component to create a unique layout.

HR Monthly Headcount Report Sample PDF
This slide represents the monthly headcount report of the human resources department of the organization. It includes details related to headcount, ARC by grade, leavers, joiners, promotions etc. Pitch your topic with ease and precision using this HR Monthly Headcount Report Sample PDF. This layout presents information on Global, Reduction, Cost. It is also available for immediate download and adjustment. So, changes can be made in the color, design, graphics or any other component to create a unique layout.

HR Monthly Turnover Report Template PDF
This slide represents the monthly employee turnover report prepared by the human resource department. It includes details related to period, starting, ending, net change, change percent, termination and retention percent. Pitch your topic with ease and precision using this HR Monthly Turnover Report Template PDF. This layout presents information on Product, Sales, Turnover Report. It is also available for immediate download and adjustment. So, changes can be made in the color, design, graphics or any other component to create a unique layout.

Data And Analytics Impact Analysis On Business Slides PDF
This slide covers potential impact of data and analytics on location based services and other sectors. It also includes major barriers to adoption disrupting the process. Pitch your topic with ease and precision using this Data And Analytics Impact Analysis On Business Slides PDF. This layout presents information on Retail, Manufacturing, Location Based Data. It is also available for immediate download and adjustment. So, changes can be made in the color, design, graphics or any other component to create a unique layout.

Social Media Online Content Marketing Strategy Dashboard Clipart PDF
This slide represents dashboard for social media content marketing. It covers page visits, post reach, page overview, total click rate, post summary etc. Pitch your topic with ease and precision using this Social Media Online Content Marketing Strategy Dashboard Clipart PDF. This layout presents information on Social Media, Online Content Marketing, Strategy Dashboard. It is also available for immediate download and adjustment. So, changes can be made in the color, design, graphics or any other component to create a unique layout.
Pareto Analysis Shipping Tracking Metrics Dashboard Guidelines PDF
This slide showcases dashboard for analyzing on-time delivery trends. It also includes KPIs such as Pareto analysis and on-time deliveries by shipping organizations. Pitch your topic with ease and precision using this Pareto Analysis Shipping Tracking Metrics Dashboard Guidelines PDF. This layout presents information on Pareto Analysis, Deliveries Trends, Shipping Organization. It is also available for immediate download and adjustment. So, changes can be made in the color, design, graphics or any other component to create a unique layout.
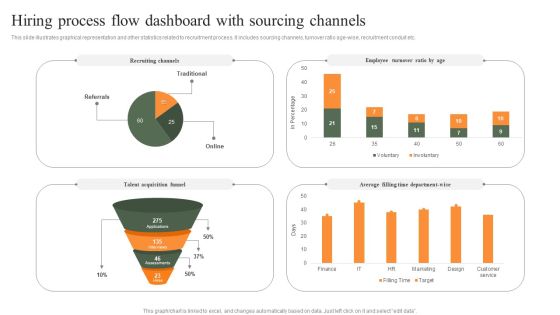
Hiring Process Flow Dashboard With Sourcing Channels Professional PDF
This slide illustrates graphical representation and other statistics related to recruitment process. It includes sourcing channels, turnover ratio age-wise, recruitment conduit etc. Pitch your topic with ease and precision using this Hiring Process Flow Dashboard With Sourcing Channels Professional PDF. This layout presents information on Employee Turnover Ratio, Recruiting Channels, Average. It is also available for immediate download and adjustment. So, changes can be made in the color, design, graphics or any other component to create a unique layout.

Google Adwords Strategic Campaign Dashboard For Marketing Department Download PDF
This slide showcases KPI dashboard for real time tracking google adwords campaign metrics. It includes key elements such as impressions, clicks, costs, spend, etc. Pitch your topic with ease and precision using this Google Adwords Strategic Campaign Dashboard For Marketing Department Download PDF. This layout presents information on Impressions, Clicks, Costs. It is also available for immediate download and adjustment. So, changes can be made in the color, design, graphics or any other component to create a unique layout.

Customer Relationship Management Dashboard With Industry Operations Data Statistics Pictures PDF
This slide illustrates graphical representation of statistical data of sales operation. It includes sales pipeline, closed operations, open operations, operations by closing date etc. Pitch your topic with ease and precision using this Customer Relationship Management Dashboard With Industry Operations Data Statistics Pictures PDF. This layout presents information on Sales Pipeline, Insurance, Telecommunic. It is also available for immediate download and adjustment. So, changes can be made in the color, design, graphics or any other component to create a unique layout.
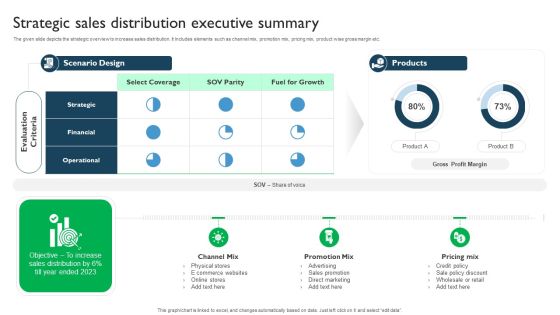
Strategic Sales Distribution Executive Summary Demonstration PDF
The given slide depicts the strategic overview to increase sales distribution. It Includes elements such as channel mix, promotion mix, pricing mix, product wise gross margin etc. Pitch your topic with ease and precision using this Strategic Sales Distribution Executive Summary Demonstration PDF. This layout presents information on E Commerce Websites, Sales Promotion, Advertising. It is also available for immediate download and adjustment. So, changes can be made in the color, design, graphics or any other component to create a unique layout.
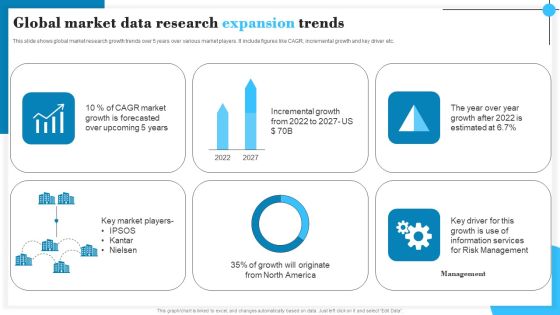
Global Market Data Research Expansion Trends Graphics PDF
This slide shows global market research growth trends over 5 years over various market players. It include figures like CAGR, incremental growth and key driver etc. Pitch your topic with ease and precision using this Global Market Data Research Expansion Trends Graphics PDF. This layout presents information on CAGR Market, Incremental Growth, Management. It is also available for immediate download and adjustment. So, changes can be made in the color, design, graphics or any other component to create a unique layout.
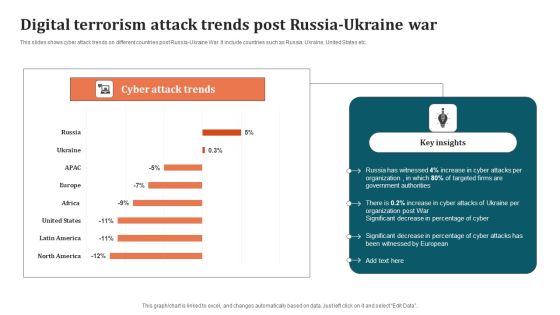
Digital Terrorism Attack Trends Post Russia Ukraine War Graphics PDF
This slides shows cyber attack trends on different countries post Russia-Ukraine War. It include countries such as Russia, Ukraine, United States etc. Pitch your topic with ease and precision using this Digital Terrorism Attack Trends Post Russia Ukraine War Graphics PDF. This layout presents information on Organization, Digital Terrorism Attack Trends. It is also available for immediate download and adjustment. So, changes can be made in the color, design, graphics or any other component to create a unique layout.

Private Wealth Administration Business In Different Countries Mockup PDF
The following slide showcases statistical data about different countries for managing wealth based on investor. It presents information related to north America, Europe, etc. Pitch your topic with ease and precision using this Private Wealth Administration Business In Different Countries Mockup PDF. This layout presents information on Private Wealth Administration Business, Wealth Management. It is also available for immediate download and adjustment. So, changes can be made in the color, design, graphics or any other component to create a unique layout.
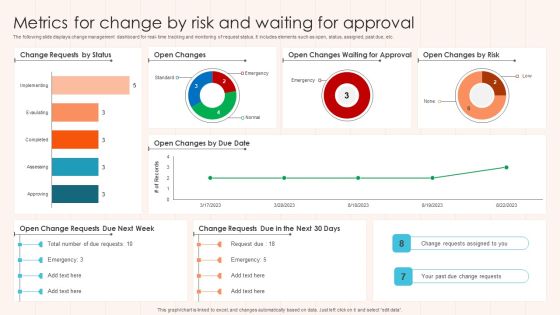
Metrics For Change By Risk And Waiting For Approval Diagrams PDF
The following slide displays change management dashboard for real- time tracking and monitoring of request status. It includes elements such as open, status, assigned, past due, etc. Pitch your topic with ease and precision using this Metrics For Change By Risk And Waiting For Approval Diagrams PDF This layout presents information on Approval, Risk, Status. It is also available for immediate download and adjustment. So, changes can be made in the color, design, graphics or any other component to create a unique layout.
Project Management Tracking Dashboard To Review Decision Download PDF
The below slide depicts the key performing indicators in project decision making. It includes elements such as overall status, progress, progress, time, cost and work volume. Pitch your topic with ease and precision using this Project Management Tracking Dashboard To Review Decision Download PDF. This layout presents information on Progress, Activity Status, Overall Status. It is also available for immediate download and adjustment. So, changes can be made in the color, design, graphics or any other component to create a unique layout.
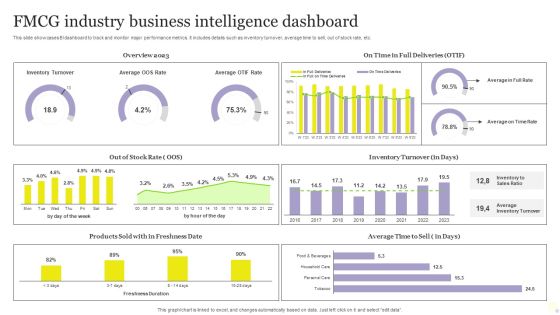
FMCG Industry Business Intelligence Dashboard Mockup PDF
This slide showcases BI dashboard to track and monitor major performance metrics. It includes details such as inventory turnover, average time to sell, out of stock rate, etc. Pitch your topic with ease and precision using this FMCG Industry Business Intelligence Dashboard Mockup PDF. This layout presents information on Average, Inventory Turnover, Business Intelligence Dashboard. It is also available for immediate download and adjustment. So, changes can be made in the color, design, graphics or any other component to create a unique layout.
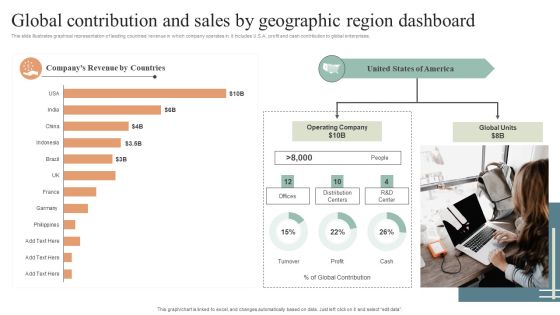
Global Contribution And Sales By Geographic Region Dashboard Diagrams PDF
This slide illustrates graphical representation of leading countries revenue in which company operates in. it includes U.S.A. profit and cash contribution to global enterprises. Pitch your topic with ease and precision using this Global Contribution And Sales By Geographic Region Dashboard Diagrams PDF. This layout presents information on Global Contribution, Sales By Geographic, Region Dashboard. It is also available for immediate download and adjustment. So, changes can be made in the color, design, graphics or any other component to create a unique layout.

Pre And Post Process Results Of Cyber Security Process Changes Sample PDF
This slide shows reduction in threats percentage after adopting cyber security. It includes computer virus, data breach, DOS and phishing. Pitch your topic with ease and precision using this Pre And Post Process Results Of Cyber Security Process Changes Sample PDF. This layout presents information on Process Results, Process Changes, Key Insights. It is also available for immediate download and adjustment. So, changes can be made in the color, design, graphics or any other component to create a unique layout.

Icon For Investment Risk Analysis Infographics PDF
This slide shows the evaluation of risk related to stocks. It includes risk levels, historical trends and future projection of investments Pitch your topic with ease and precision using this Icon For Investment Risk Analysis Infographics PDF. This layout presents information on Investment, Risk, Analysis. It is also available for immediate download and adjustment. So, changes can be made in the color, design, graphics or any other component to create a unique layout.

Securities Risk Assessment In Investment Topics PDF
This slide shows the risk percentage of three securities purchased by an investor. It includes risk level during four quarters of all three securities. Pitch your topic with ease and precision using this Securities Risk Assessment In Investment Topics PDF. This layout presents information on Investment, Key Takeaways, Continuous Increase. It is also available for immediate download and adjustment. So, changes can be made in the color, design, graphics or any other component to create a unique layout.

Corporate Bonus Payouts And Performance Incentives Dashboard Mockup PDF
This slide illustrates facts and figures related to performance bonus in a corporation. It includes total monthly payouts, eligible employee payout, target achievement analysis etc. Pitch your topic with ease and precision using this Corporate Bonus Payouts And Performance Incentives Dashboard Mockup PDF. This layout presents information on Monthly Payouts, Employee Payout, Average Employee. It is also available for immediate download and adjustment. So, changes can be made in the color, design, graphics or any other component to create a unique layout.

Call Center Kpis Customer Service Dashboard Pictures PDF
This slide covers contact center customer service metrics KPI dashboard. It involves details such as ticket status, chats created, self serve performance and customer feedback. Pitch your topic with ease and precision using this Call Center Kpis Customer Service Dashboard Pictures PDF. This layout presents information on Response Time, Customer, Dashboard. It is also available for immediate download and adjustment. So, changes can be made in the color, design, graphics or any other component to create a unique layout.
 Home
Home