AI PPT Maker
Templates
PPT Bundles
Design Services
Business PPTs
Business Plan
Management
Strategy
Introduction PPT
Roadmap
Self Introduction
Timelines
Process
Marketing
Agenda
Technology
Medical
Startup Business Plan
Cyber Security
Dashboards
SWOT
Proposals
Education
Pitch Deck
Digital Marketing
KPIs
Project Management
Product Management
Artificial Intelligence
Target Market
Communication
Supply Chain
Google Slides
Research Services
 One Pagers
All Categories
-
Home
- Customer Favorites
- Profitability Ratio
Profitability Ratio
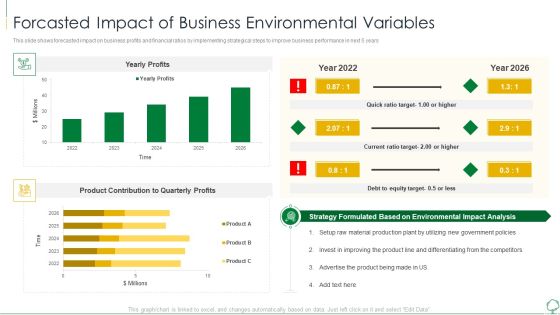
Environmental Examination Tools And Approaches Forcasted Impact Of Business Diagrams PDF
This slide shows forecasted impact on business profits and financial ratios by implementing strategical steps to improve business performance in next 5 years. Deliver an awe inspiring pitch with this creative environmental examination tools and approaches forcasted impact of business diagrams pdf bundle. Topics like product, quarterly profits, material, analysis can be discussed with this completely editable template. It is available for immediate download depending on the needs and requirements of the user.

Corporate Annual Financial Summary Report Ppt Portfolio Skills PDF
This slide represents annual financial statement snapshot. It covers gross profit margin, operating expenditure, operating profit, net profit margin, revenue, EBIT etc. Pitch your topic with ease and precision using this Corporate Annual Financial Summary Report Ppt Portfolio Skills PDF. This layout presents information on Operating Expenditure Ratio, Operating Profit, Net Profit Margin. It is also available for immediate download and adjustment. So, changes can be made in the color, design, graphics or any other component to create a unique layout.

Environmental Assessment Forecasted Impact Of The Environmental Variables Ppt Show Layout PDF
This slide shows forecasted impact on business profits and financial ratios by implementing strategical steps to improve business performance in next 5 years Deliver and pitch your topic in the best possible manner with this environmental assessment forecasted impact of the environmental variables ppt show layout pdf. Use them to share invaluable insights on product contribution, increasing performance, equity target and impress your audience. This template can be altered and modified as per your expectations. So, grab it now.

Internal And External Business Environment Analysis Forcasted Impact Of Business Environmental Variables Portrait PDF
This slide shows forecasted impact on business profits and financial ratios by implementing strategical steps to improve business performance in next 5 years Deliver an awe inspiring pitch with this creative internal and external business environment analysis forcasted impact of business environmental variables portrait pdf bundle. Topics like material production, improving the product, differentiating from the competitors can be discussed with this completely editable template. It is available for immediate download depending on the needs and requirements of the user.
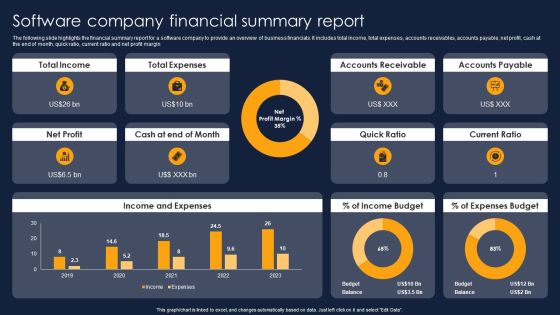
Software Company Financial Summary Report Financial Performance Report Of Software Firm Rules PDF
The following slide highlights the financial summary report for a software company to provide an overview of business financials. It includes total income, total expenses, accounts receivables, accounts payable, net profit, cash at the end of month, quick ratio, current ratio and net profit margin. If your project calls for a presentation, then Slidegeeks is your go-to partner because we have professionally designed, easy-to-edit templates that are perfect for any presentation. After downloading, you can easily edit Software Company Financial Summary Report Financial Performance Report Of Software Firm Rules PDF and make the changes accordingly. You can rearrange slides or fill them with different images. Check out all the handy templates

Analytical Incrementalism Business Performance Measurement Metrics Sales Infographics PDF
The purpose of this slide is to provide a glimpse about the business marketing performance measurement metrics after logical incrementalism approach. Deliver an awe-inspiring pitch with this creative analytical incrementalism business performance measurement metrics sales infographics pdf bundle. Topics like gross profit margin, revenue, quick ratio can be discussed with this completely editable template. It is available for immediate download depending on the needs and requirements of the user.
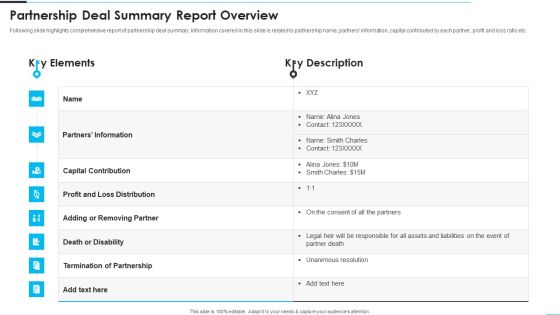
Partnership Deal Summary Report Overview Rules PDF
Following slide highlights comprehensive report of partnership deal summary. Information covered in this slide is related to partnership name, partners information, capital contributed by each partner, profit and loss ratio etc. Showcasing this set of slides titled Partnership Deal Summary Report Overview Rules PDF. The topics addressed in these templates are Capital Contribution, Profit, Termination Of Partnership. All the content presented in this PPT design is completely editable. Download it and make adjustments in color, background, font etc. as per your unique business setting.

Executive Summary Health And Property Insurance Company Profile Professional PDF
The slide highlights brief company details which depict company outline, key statistics, brand value and global market share. The major statistics covered are CAGR, revenue, combined ratio, net profit, employees count, countries presence, and policyholder count. Deliver and pitch your topic in the best possible manner with this Executive Summary Health And Property Insurance Company Profile Professional PDF. Use them to share invaluable insights on Revenue, Combined Ratio, Net Profit, Countries Presence and impress your audience. This template can be altered and modified as per your expectations. So, grab it now.

Improving Business Procedures Enterprise Resource Planning System Financial Performance Management Summary PDF
The following slide highlights the impact of adopting enterprise resource planning ERP software on financial performance to measure its success. It includes key performance indicators such as gross profit margin, operating ratio, net profit margin, liquidity status etc. Welcome to our selection of the Improving Business Procedures Enterprise Resource Planning System Financial Performance Management Summary PDF. These are designed to help you showcase your creativity and bring your sphere to life. Planning and Innovation are essential for any business that is just starting out. This collection contains the designs that you need for your everyday presentations. All of our PowerPoints are 100 percent editable, so you can customize them to suit your needs. This multi purpose template can be used in various situations. Grab these presentation templates today.
Overview Healthcare Business Management Health System Financial Analysis Icons PDF
Presenting this set of slides with name overview healthcare business management health system financial analysis icons pdf. The topics discussed in these slides are ratio or statistic, profitability, debt position, liquidity. This is a completely editable PowerPoint presentation and is available for immediate download. Download now and impress your audience.

Series B Funding Highly Attractive Investments Microsoft PDF
This slide provides the glimpse about the funding investments based on monitory card spend, annual revenue, gross profit, loan to value ratio, reference customers for seed, series A, B, C, D investments. Deliver an awe inspiring pitch with this creative series b funding highly attractive investments microsoft pdf bundle. Topics like annual revenue, reference customer, annual gross profit can be discussed with this completely editable template. It is available for immediate download depending on the needs and requirements of the user.

Graphical Representation Of Business Payment Analysis Ppt PowerPoint Presentation Ideas Slide Portrait PDF
Presenting this set of slides with name graphical representation of business payment analysis ppt powerpoint presentation ideas slide portrait pdf. The topics discussed in these slide is particulars, net profit, dividends, dividends payout ratio. This is a completely editable PowerPoint presentation and is available for immediate download. Download now and impress your audience.
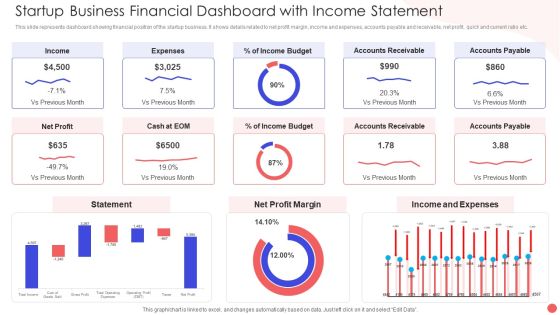
Startup Business Financial Dashboard With Income Statement Portrait PDF
This slide represents dashboard showing financial position of the startup business. It shows details related to net profit margin, income and expenses, accounts payable and receivable, net profit, quick and current ratio etc. Showcasing this set of slides titled Startup Business Financial Dashboard With Income Statement Portrait PDF. The topics addressed in these templates are Accounts Receivable Income, Income And Expenses, Net Profit Margin. All the content presented in this PPT design is completely editable. Download it and make adjustments in color, background, font etc. as per your unique business setting.
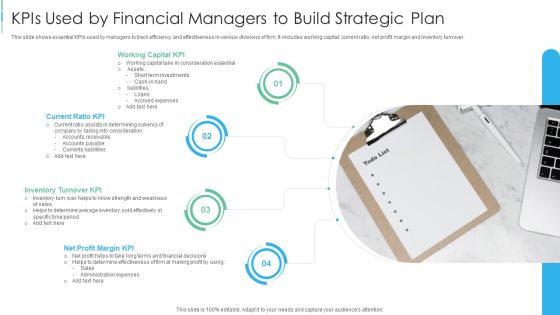
Kpis Used By Financial Managers To Build Strategic Plan Diagrams PDF
This slide shows essential KPIs used by managers to track efficiency and effectiveness in various divisions of firm. It includes working capital, current ratio, net profit margin and inventory turnover.Presenting Kpis Used By Financial Managers To Build Strategic Plan Diagrams PDF to dispense important information. This template comprises four stages. It also presents valuable insights into the topics including Working Capital KPI, Current Ratio KPI, Inventory Turnover KPI. This is a completely customizable PowerPoint theme that can be put to use immediately. So, download it and address the topic impactfully.

Quarterly Revenue And Loss Statement Comparison Dashboard Portrait PDF
This slide showcases a comprehensive P and L report for representing the financial outcomes. It also helps to take financial performance management decisions. It includes financial analysis KPIs such as p and l statements, p and l structure dynamics, sales or margin quality performance analysis, DUPONT ratio, etc. Showcasing this set of slides titled Quarterly Revenue And Loss Statement Comparison Dashboard Portrait PDF. The topics addressed in these templates are Profitability, Debt Coverage Ratios, Margin Quality Performa. All the content presented in this PPT design is completely editable. Download it and make adjustments in color, background, font etc. as per your unique business setting.

Geo Energy Company Business Overview And Other Facts Graphics PDF
This slide shows details about GEO Energy Company such as employees, business units, headquarters, key competitors , Performance Ratio, Profitability, Wind Energy Level in MWH etc. This is a geo energy company business overview and other facts graphics pdf template with various stages. Focus and dispense information on three stages using this creative set, that comes with editable features. It contains large content boxes to add your information on topics like sources, value, industry, manufacturing, annual revenue. You can also showcase facts, figures, and other relevant content using this PPT layout. Grab it now.
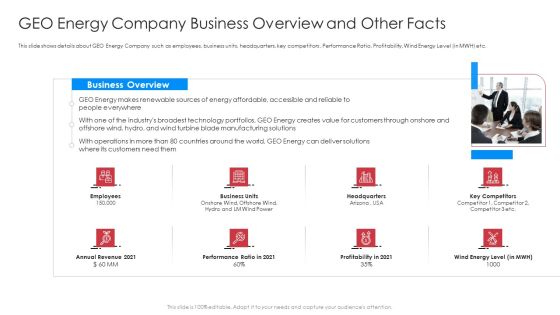
Geo Energy Company Business Overview And Other Facts Demonstration PDF
This slide shows details about GEO Energy Company such as employees, business units, headquarters, key competitors , Performance Ratio, Profitability, Wind Energy Level in MWH etc. This is a geo energy company business overview and other facts demonstration pdf template with various stages. Focus and dispense information on eight stages using this creative set, that comes with editable features. It contains large content boxes to add your information on topics like onshore wind, offshore wind hydro and lm wind power, business overview, solutions where its customers. You can also showcase facts, figures, and other relevant content using this PPT layout. Grab it now.
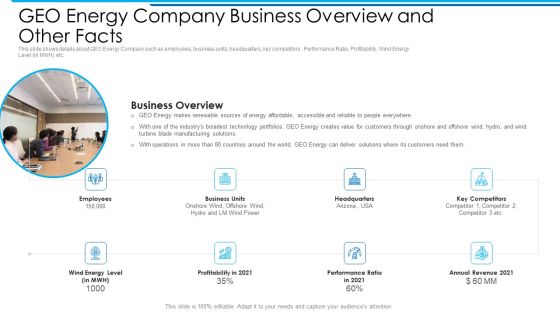
Geo Energy Company Business Overview And Other Facts Designs PDF
This slide shows details about GEO Energy Company such as employees, business units, headquarters, key competitors , Performance Ratio, Profitability, Wind Energy Level in MWH etc. This is a geo energy company business overview and other facts designs pdf template with various stages. Focus and dispense information on eight stages using this creative set, that comes with editable features. It contains large content boxes to add your information on topics like business units, headquarters, key competitors. You can also showcase facts, figures, and other relevant content using this PPT layout. Grab it now.
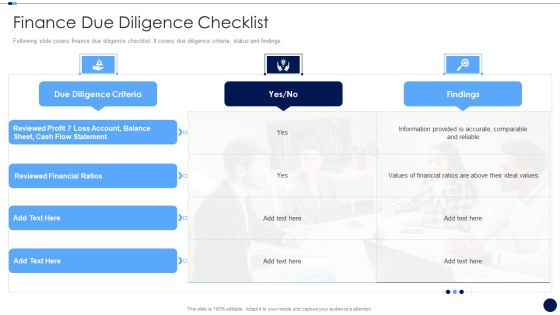
Merger And Acquisition Due Diligence Checklist Finance Due Diligence Checklist Download PDF
Following slide covers finance due diligence checklist. It covers due diligence criteria, status and findings.Deliver an awe inspiring pitch with this creative merger and acquisition due diligence checklist finance due diligence checklist download pdf bundle. Topics like reviewed financial ratios, reviewed profit, due diligence criteria can be discussed with this completely editable template. It is available for immediate download depending on the needs and requirements of the user.

Series B Capital Funding Pitch Deck Highly Attractive Investments Inspiration PDF
This slide provides the glimpse about the funding investments based on monitory card spend, annual revenue, gross profit, loan to value ratio, reference customers for seed, series A, B, C, D investments. Deliver and pitch your topic in the best possible manner with this series b capital funding pitch deck highly attractive investments inspiration pdf. Use them to share invaluable insights on annual revenue, annual gross profit and impress your audience. This template can be altered and modified as per your expectations. So, grab it now.
Highly Attractive Investments Series B Round Venture Funding Ppt Portfolio Visuals PDF
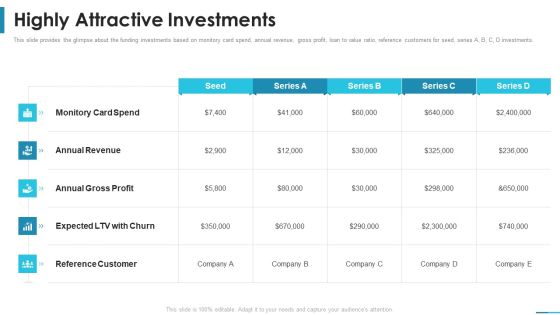
This slide provides the glimpse about the funding investments based on monitory card spend, annual revenue, gross profit, loan to value ratio, reference customers for seed, series A, B, C, D investments. Deliver an awe inspiring pitch with this creative highly attractive investments series b round venture funding ppt portfolio visuals pdf bundle. Topics like monitory card spend, annual revenue, annual gross profit can be discussed with this completely editable template. It is available for immediate download depending on the needs and requirements of the user.
Executive Dashboards For Tracking Financial Health Of Enterprise Diagrams PDF
This slide represents the CEO dashboard to track the financial health of an organization. It includes key performance indicators such as revenue, expenses, activity ratio, gross profit margin, EBIT etc. Pitch your topic with ease and precision using this Executive Dashboards For Tracking Financial Health Of Enterprise Diagrams PDF. This layout presents information on Revenue, Expense, Activity Ratio. It is also available for immediate download and adjustment. So, changes can be made in the color, design, graphics or any other component to create a unique layout.

Account Payable Metrics With Income Budget Ppt PowerPoint Presentation Layouts Master Slide PDF
Presenting this set of slides with name account payable metrics with income budget ppt powerpoint presentation layouts master slide pdf. The topics discussed in these slides are total income, total expenses, net profit margin, accounts receivable, accounts payable, net profit, cash at end of month, quick ratio, current ratio, expenses budget, income budget, cash at end of month. This is a completely editable PowerPoint presentation and is available for immediate download. Download now and impress your audience.

Key Performance Indicators Of Geo Energy Company With Future Targets Ideas PDF
The slide shows the key Performance Indicator KPIs which will help the company to track the success rate of implemented strategies. Some of the KPIs are Revenue , Return on Investment, Performance Ratio , Wind Energy Levels , Plant Availability, Profitability etc.Deliver an awe inspiring pitch with this creative key performance indicators of geo energy company with future targets ideas pdf bundle. Topics like return on investment, performance ratio, key performance indicators can be discussed with this completely editable template. It is available for immediate download depending on the needs and requirements of the user.
Key Performance Indicators Of GEO Energy Company With Future Targets Topics PDF
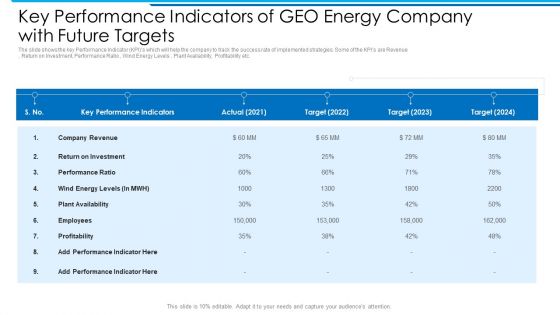
The slide shows the key Performance Indicator KPIs which will help the company to track the success rate of implemented strategies. Some of the KPIs are Revenue , Return on Investment, Performance Ratio , Wind Energy Levels , Plant Availability, Profitability etc.Deliver and pitch your topic in the best possible manner with this key performance indicators of geo energy company with future targets topics pdf. Use them to share invaluable insights on return on investment, plant availability, key performance indicators and impress your audience. This template can be altered and modified as per your expectations. So, grab it now.

Current Scenario Highlighting Financial Performance Insights Demonstration PDF
This slide showcases overview of current financial scenario to give brief idea about unfavorable KPIs. It provides details about net profit margins, debt to equity ratio, financial process efficiency, etc. Want to ace your presentation in front of a live audience Our Current Scenario Highlighting Financial Performance Insights Demonstration PDF can help you do that by engaging all the users towards you.. Slidegeeks experts have put their efforts and expertise into creating these impeccable powerpoint presentations so that you can communicate your ideas clearly. Moreover, all the templates are customizable, and easy-to-edit and downloadable. Use these for both personal and commercial use.
Highly Attractive Investments Sequence B Funding Ppt Show Format PDF
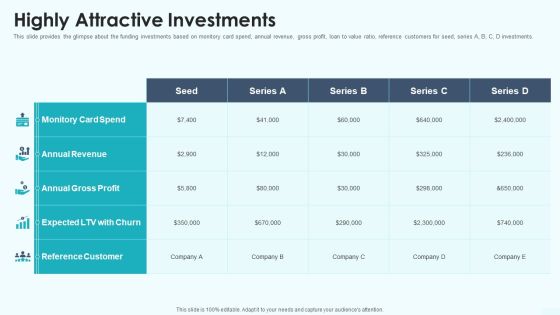
This slide provides the glimpse about the funding investments based on monitory card spend, annual revenue, gross profit, loan to value ratio, reference customers for seed, series A, B, C, D investments. Deliver and pitch your topic in the best possible manner with this highly attractive investments sequence b funding ppt show format pdf. Use them to share invaluable insights on annual revenue, annual gross profit, reference customer and impress your audience. This template can be altered and modified as per your expectations. So, grab it now.

Term Life And General Insurance Company Profile Executive Summary Topics PDF
The slide highlights brief company details which depict company outline, key statistics, brand value and global market share. The major statistics covered are CAGR, revenue, combined ratio, net profit, employees count, countries presence, and policyholder count. Deliver an awe inspiring pitch with this creative Term Life And General Insurance Company Profile Executive Summary Topics PDF bundle. Topics like Revenue, Net Profit, Employees can be discussed with this completely editable template. It is available for immediate download depending on the needs and requirements of the user.

Company Financial Accounting Key Performance Indicators Ppt Slides PDF
This slide shows the key metrics of finance used in every organization. It includes profitability, liquidity, leverage, efficiency and valuation ratios. Presenting Company Financial Accounting Key Performance Indicators Ppt Slides PDF to dispense important information. This template comprises five stages. It also presents valuable insights into the topics including Profitability, Liquidity, Leverage. This is a completely customizable PowerPoint theme that can be put to use immediately. So, download it and address the topic impactfully.

Insurance Services Firm Profile Executive Summary Template PDF
The slide highlights brief company details which depict company outline, key statistics, brand value and global market share. The major statistics covered are CAGR, revenue, combined ratio, net profit, employees count, countries presence, and policyholder count. Deliver and pitch your topic in the best possible manner with this Insurance Services Firm Profile Executive Summary Template PDF. Use them to share invaluable insights on Brand Value, Global Market Share, Revenue and impress your audience. This template can be altered and modified as per your expectations. So, grab it now.

Property And Casualties Insurance Business Profile Executive Summary Download PDF
The slide highlights brief company details which depict company outline, key statistics, brand value and global market share. The major statistics covered are CAGR, revenue, combined ratio, net profit, employees count, countries presence, and policyholder count. This is a Property And Casualties Insurance Business Profile Executive Summary Download PDF template with various stages. Focus and dispense information on two stages using this creative set, that comes with editable features. It contains large content boxes to add your information on topics like Global Market Share, Brand Value. You can also showcase facts, figures, and other relevant content using this PPT layout. Grab it now.

Case Study Become Market Leader Renewable Reliable Energy GEO Energy Company Business Overview And Other Facts Infographics PDF
This slide shows details about GEO Energy Company such as employees, business units, headquarters, key competitors , Performance Ratio, Profitability, Wind Energy Level in MWH etc. Presenting case study become market leader renewable reliable energy geo energy company business overview and other facts infographics pdf to provide visual cues and insights. Share and navigate important information on eight stages that need your due attention. This template can be used to pitch topics like business units onshore wind, offshore wind, hydro and lm wind power, headquarters arizona usa, key competitors ompetitor 1 competitor 2 competitor 3 etc In addtion, this PPT design contains high resolution images, graphics, etc, that are easily editable and available for immediate download.
Stages Of Pie Chart Data Interpretation Vending Machine Business Plan PowerPoint Slides
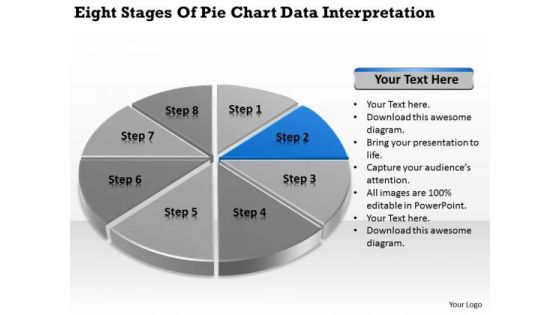
We present our stages of pie chart data interpretation vending machine business plan PowerPoint Slides.Present our Circle Charts PowerPoint Templates because You should Bet on your luck with our PowerPoint Templates and Slides. Be assured that you will hit the jackpot. Present our Marketing PowerPoint Templates because Our PowerPoint Templates and Slides will provide you the cutting edge. Slice through the doubts in the minds of your listeners. Download our Business PowerPoint Templates because you should Experience excellence with our PowerPoint Templates and Slides. They will take your breath away. Download our Shapes PowerPoint Templates because It will Raise the bar of your Thoughts. They are programmed to take you to the next level. Present our Process and Flows PowerPoint Templates because Our PowerPoint Templates and Slides will give good value for money. They also have respect for the value of your time.Use these PowerPoint slides for presentations relating to achievement, analysis, background, bank, banking, business, calculation, chart, circle, commerce, commercial, commission, concept, credit, crisis, debt, deposit, design, detail, diagram, earnings, economics, economy, element, finance, goal, gold, golden, graph, graphic, growth, icon, idea, illustration, income, increase, invest, isolated, level, loss, market, marketing, metal, modern, money, new, object, part, percent, percentage, pie, plot, politics, profit, progress, ratio, reflection, reflective. The prominent colors used in the PowerPoint template are Blue, Gray, Black.
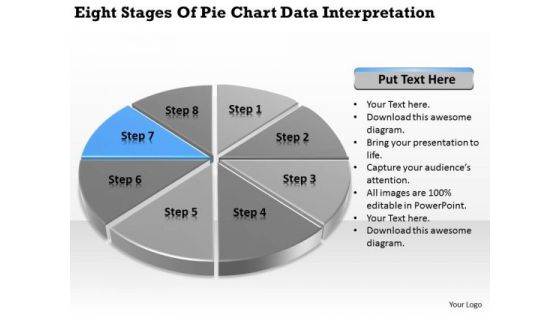
Stages Of Pie Chart Data Interpretation Business Plan Template PowerPoint Templates
We present our stages of pie chart data interpretation business plan template PowerPoint templates.Download and present our Circle Charts PowerPoint Templates because You can Stir your ideas in the cauldron of our PowerPoint Templates and Slides. Cast a magic spell on your audience. Download our Marketing PowerPoint Templates because Our PowerPoint Templates and Slides will let you Hit the target. Go the full distance with ease and elan. Use our Business PowerPoint Templates because Our PowerPoint Templates and Slides are truly out of this world. Even the MIB duo has been keeping tabs on our team. Download our Shapes PowerPoint Templates because Watching this your Audience will Grab their eyeballs, they wont even blink. Download our Process and Flows PowerPoint Templates because It will Give impetus to the hopes of your colleagues. Our PowerPoint Templates and Slides will aid you in winning their trust.Use these PowerPoint slides for presentations relating to achievement, analysis, background, bank, banking, business, calculation, chart, circle, commerce, commercial, commission, concept, credit, crisis, debt, deposit, design, detail, diagram, earnings, economics, economy, element, finance, goal, gold, golden, graph, graphic, growth, icon, idea, illustration, income, increase, invest, isolated, level, loss, market, marketing, metal, modern, money, new, object, part, percent, percentage, pie, plot, politics, profit, progress, ratio, reflection, reflective. The prominent colors used in the PowerPoint template are Blue, Gray, Black.
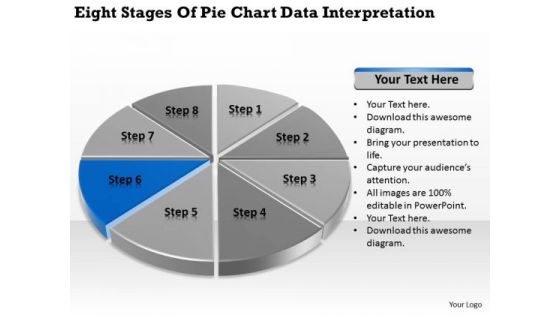
Stages Of Pie Chart Data Interpretation Example Business Plan PowerPoint Slides
We present our stages of pie chart data interpretation example business plan PowerPoint Slides.Download and present our Circle Charts PowerPoint Templates because It will let you Set new benchmarks with our PowerPoint Templates and Slides. They will keep your prospects well above par. Download our Marketing PowerPoint Templates because Our PowerPoint Templates and Slides will weave a web of your great ideas. They are gauranteed to attract even the most critical of your colleagues. Use our Business PowerPoint Templates because It will Strengthen your hand with your thoughts. They have all the aces you need to win the day. Present our Shapes PowerPoint Templates because It will get your audience in sync. Present our Process and Flows PowerPoint Templates because Our PowerPoint Templates and Slides will generate and maintain the level of interest you desire. They will create the impression you want to imprint on your audience.Use these PowerPoint slides for presentations relating to achievement, analysis, background, bank, banking, business, calculation, chart, circle, commerce, commercial, commission, concept, credit, crisis, debt, deposit, design, detail, diagram, earnings, economics, economy, element, finance, goal, gold, golden, graph, graphic, growth, icon, idea, illustration, income, increase, invest, isolated, level, loss, market, marketing, metal, modern, money, new, object, part, percent, percentage, pie, plot, politics, profit, progress, ratio, reflection, reflective. The prominent colors used in the PowerPoint template are Blue navy, Gray, Black.

Stages Of Pie Chart Data Interpretation How To Write Business Plan PowerPoint Templates
We present our stages of pie chart data interpretation how to write business plan PowerPoint templates.Present our Circle Charts PowerPoint Templates because Our PowerPoint Templates and Slides will provide you a launch platform. Give a lift off to your ideas and send them into orbit. Present our Marketing PowerPoint Templates because Our PowerPoint Templates and Slides will let you Hit the right notes. Watch your audience start singing to your tune. Use our Business PowerPoint Templates because Our PowerPoint Templates and Slides come in all colours, shades and hues. They help highlight every nuance of your views. Download our Shapes PowerPoint Templates because It can Leverage your style with our PowerPoint Templates and Slides. Charm your audience with your ability. Use our Process and Flows PowerPoint Templates because You can Connect the dots. Fan expectations as the whole picture emerges.Use these PowerPoint slides for presentations relating to achievement, analysis, background, bank, banking, business, calculation, chart, circle, commerce, commercial, commission, concept, credit, crisis, debt, deposit, design, detail, diagram, earnings, economics, economy, element, finance, goal, gold, golden, graph, graphic, growth, icon, idea, illustration, income, increase, invest, isolated, level, loss, market, marketing, metal, modern, money, new, object, part, percent, percentage, pie, plot, politics, profit, progress, ratio, reflection, reflective. The prominent colors used in the PowerPoint template are Blue, Gray, Black.

Business Solvency Management Action Plan Slides PDF
This slide showcases solvency management plan which can be referred by businesses to improve their financial performance. It provides details about debt-to equity ratio, current ratio, net profit margin, days sales outstanding, etc. Do you know about Slidesgeeks Business Solvency Management Action Plan Slides PDF These are perfect for delivering any kind od presentation. Using it, create PowerPoint presentations that communicate your ideas and engage audiences. Save time and effort by using our pre-designed presentation templates that are perfect for a wide range of topic. Our vast selection of designs covers a range of styles, from creative to business, and are all highly customizable and easy to edit. Download as a PowerPoint template or use them as Google Slides themes.

Due Diligence In Amalgamation And Acquisition Finance Due Diligence Checklist Topics PDF
Following slide covers finance due diligence checklist. It covers due diligence criteria, status and findings. This is a Due Diligence In Amalgamation And Acquisition Finance Due Diligence Checklist Topics PDF template with various stages. Focus and dispense information on three stages using this creative set, that comes with editable features. It contains large content boxes to add your information on topics like Reviewed Financial Ratios, Information, Reviewed Profit. You can also showcase facts, figures, and other relevant content using this PPT layout. Grab it now.
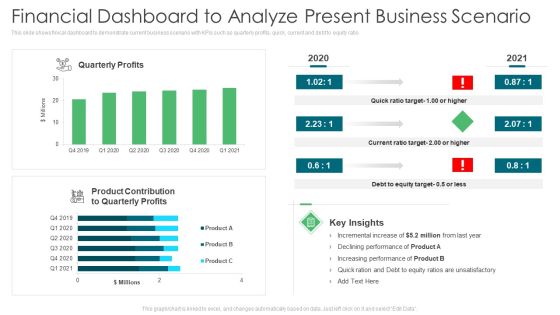
Environmental Assessment Financial Dashboard To Analyze Present Business Scenario Ppt Infographics Ideas PDF
This slide shows finical dashboard to demonstrate current business scenario with KPIs such as quarterly profits, quick, current and debt to equity ratio. Deliver an awe inspiring pitch with this creative environmental assessment financial dashboard to analyze present business scenario ppt infographics ideas pdf bundle. Topics like product contribution, increasing performance, equity target can be discussed with this completely editable template. It is available for immediate download depending on the needs and requirements of the user.

Environmental Examination Tools And Approaches Financial Dashboard To Analyze Sample PDF
This slide shows finical dashboard to demonstrate current business scenario with KPIs such as quarterly profits, quick, current and debt to equity ratio. Deliver and pitch your topic in the best possible manner with this environmental examination tools and approaches financial dashboard to analyze sample pdf. Use them to share invaluable insights on performance, product, equity and impress your audience. This template can be altered and modified as per your expectations. So, grab it now.
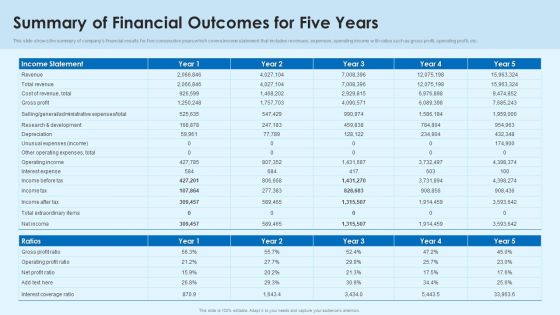
Summary Of Financial Outcomes For Five Years Guidelines PDF
This slide shows the summary of companys financial results for five consecutive years which covers income statement that includes revenues, expenses, operating income with ratios such as gross profit, operating profit, etc.Pitch your topic with ease and precision using this Summary Of Financial Outcomes For Five Years Guidelines PDF This layout presents information on Income Statement, Administrative Expenses, Total Extraordinary It is also available for immediate download and adjustment. So, changes can be made in the color, design, graphics or any other component to create a unique layout.
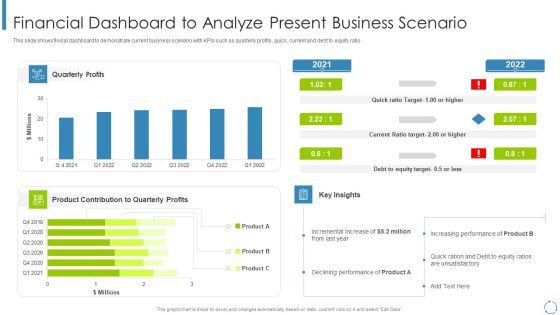
Internal And External Business Environment Analysis Financial Dashboard To Analyze Present Business Scenario Topics PDF
This slide shows finical dashboard to demonstrate current business scenario with KPIs such as quarterly profits, quick, current and debt to equity ratio Deliver and pitch your topic in the best possible manner with this internal and external business environment analysis financial dashboard to analyze present business scenario topics pdf Use them to share invaluable insights on product contribution to quarterly, incremental increase, declining performance and impress your audience. This template can be altered and modified as per your expectations. So, grab it now.

Business Procedures Improvement Lifecycle Model Demonstration PDF
Following slide shows the lifecycle model for business process reengineering which assist in businesses are more responsive to market forces, grow their market share and profitability, and enhance cycle times, cost ratios, and product quality. It includes identifying process, review, design to be, implementation and testing. Persuade your audience using this Business Procedures Improvement Lifecycle Model Demonstration PDF. This PPT design covers four stages, thus making it a great tool to use. It also caters to a variety of topics including Implementation Testing, Identifying Process, Review Evaluate. Download this PPT design now to present a convincing pitch that not only emphasizes the topic but also showcases your presentation skills.

5 Years Net Income Comparative Analysis Chart Of Financial Institute Ppt Show Designs PDF
This slide represents the comparison of net income of financial institute for different years. It includes details related to total revenue, gross profit, operating income and net income and ratios of the institute for different years. Showcasing this set of slides titled 5 Years Net Income Comparative Analysis Chart Of Financial Institute Ppt Show Designs PDF. The topics addressed in these templates are Income Statement, 2018 To 2022, Ratios. All the content presented in this PPT design is completely editable. Download it and make adjustments in color, background, font etc. as per your unique business setting.
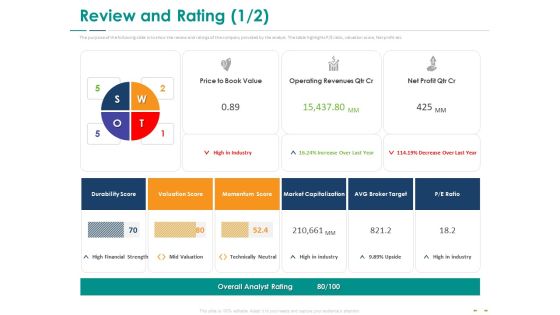
Stock Market Research Report Review And Rating Ppt PowerPoint Presentation Model Graphics PDF
The purpose of the following slide is to show the review and ratings of the company provided by the analyst. The table highlights P or E ratio, valuation score, Net profit etc. This is a stock market research report review and rating ppt powerpoint presentation model graphics pdf template with various stages. Focus and dispense information on four stages using this creative set, that comes with editable features. It contains large content boxes to add your information on topics like price to book value, operating revenues qtr cr, net profit qtr cr, high in industry, durability score, valuation score, momentum score, market capitalization, avg broker target, p or e ratio. You can also showcase facts, figures, and other relevant content using this PPT layout. Grab it now.
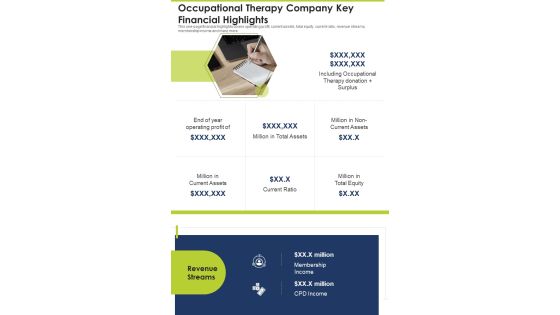
Occupational Therapy Company Key Financial Highlights One Pager Documents
This one-page financial highlights covers operating profit, current assets, total equity, current ratio, revenue streams, membership income and many more. Presenting you an exemplary Occupational Therapy Company Key Financial Highlights One Pager Documents. Our one-pager comprises all the must-have essentials of an inclusive document. You can edit it with ease, as its layout is completely editable. With such freedom, you can tweak its design and other elements to your requirements. Download this Occupational Therapy Company Key Financial Highlights One Pager Documents brilliant piece now.

Market Evaluation Of IT Industry Financial Dashboard To Track Organization Expenses Clipart PDF
The following slide showcases KPI dashboard which can be used by finance managers to evaluate financial health of company. Revenue, expenses, net profit, bills receivable, bills payable, quick ratio, current ratio are some of the major metrics which are outlined in the slide. Do you have an important presentation coming up Are you looking for something that will make your presentation stand out from the rest Look no further than Market Evaluation Of IT Industry Financial Dashboard To Track Organization Expenses Clipart PDF. With our professional designs, you can trust that your presentation will pop and make delivering it a smooth process. And with Slidegeeks, you can trust that your presentation will be unique and memorable. So why wait Grab Market Evaluation Of IT Industry Financial Dashboard To Track Organization Expenses Clipart PDF today and make your presentation stand out from the rest.

Financial Dashboard To Track Organization Expenses Ppt PowerPoint Presentation File Ideas PDF
The following slide showcases KPI dashboard which can be used by finance managers to evaluate financial health of company. Revenue, expenses, net profit, bills receivable, bills payable, quick ratio, current ratio are some of the major metrics which are outlined in the slide. Boost your pitch with our creative Financial Dashboard To Track Organization Expenses Ppt PowerPoint Presentation File Ideas PDF. Deliver an awe-inspiring pitch that will mesmerize everyone. Using these presentation templates you will surely catch everyones attention. You can browse the ppts collection on our website. We have researchers who are experts at creating the right content for the templates. So you do not have to invest time in any additional work. Just grab the template now and use them.

R2R Dashboard With Income Statement Ppt PowerPoint Presentation Show Slide Download PDF
Following slide outlines a comprehensive R2R dashboard used for taking financial decisions. The various metrics covered in this slide are total income, expenses, net profit, cash at end of month, income and expenses, quick ratio, current ratio etc.Showcasing this set of slides titled R2R Dashboard With Income Statement Ppt PowerPoint Presentation Show Slide Download PDF. The topics addressed in these templates are Operating Expenses, Total Experience, Accounts Receivable. All the content presented in this PPT design is completely editable. Download it and make adjustments in color, background, font etc. as per your unique business setting.
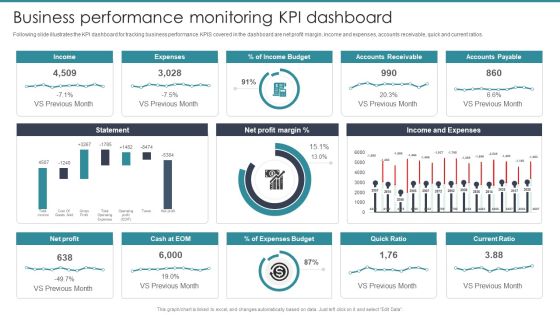
Guide To Mergers And Acquisitions Business Performance Monitoring KPI Dashboard Designs PDF
Following slide illustrates the KPI dashboard for tracking business performance. KPIS covered in the dashboard are net profit margin, income and expenses, accounts receivable, quick and current ratios. Here you can discover an assortment of the finest PowerPoint and Google Slides templates. With these templates, you can create presentations for a variety of purposes while simultaneously providing your audience with an eye catching visual experience. Download Guide To Mergers And Acquisitions Business Performance Monitoring KPI Dashboard Designs PDF to deliver an impeccable presentation. These templates will make your job of preparing presentations much quicker, yet still, maintain a high level of quality. Slidegeeks has experienced researchers who prepare these templates and write high quality content for you. Later on, you can personalize the content by editing the Guide To Mergers And Acquisitions Business Performance Monitoring KPI Dashboard Designs PDF.

Annual Financial Key Performance Indicators After RPA Guidelines PDF
This slide covers annual financial indicators of organization after the implementation of automation. It includes gross margin, return on sales, equity ratio, dynamic gearing, changes in unit sales, operating profit, inventory turnover, return on equity before tax, etc. Create an editable Annual Financial Key Performance Indicators After RPA Guidelines PDF that communicates your idea and engages your audience. Whether you are presenting a business or an educational presentation, pre-designed presentation templates help save time. Annual Financial Key Performance Indicators After RPA Guidelines PDF is highly customizable and very easy to edit, covering many different styles from creative to business presentations. Slidegeeks has creative team members who have crafted amazing templates. So, go and get them without any delay.

Annual Financial Key Performance Indicators Before RPA Download PDF
This slide covers current annual financial indicators of organization before the implementation of automation. It includes gross margin, return on sales, equity ratio, dynamic gearing, changes in unit sales, operating profit, cash flow, inventory turnover, return on equity before tax, etc. Slidegeeks is one of the best resources for PowerPoint templates. You can download easily and regulate Annual Financial Key Performance Indicators Before RPA Download PDF for your personal presentations from our wonderful collection. A few clicks is all it takes to discover and get the most relevant and appropriate templates. Use our Templates to add a unique zing and appeal to your presentation and meetings. All the slides are easy to edit and you can use them even for advertisement purposes.
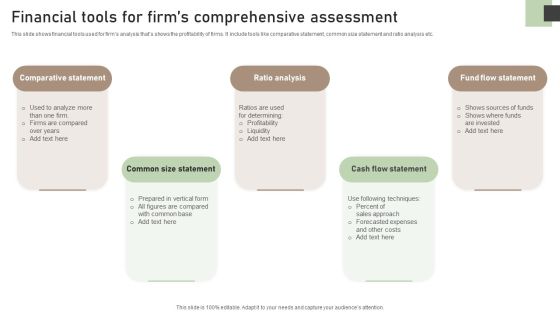
Financial Tools For Firms Comprehensive Assessment Themes PDF
This slide shows financial tools used for firms analysis thats shows the profitability of firms. It include tools like comparative statement, common size statement and ratio analysis etc. Presenting Financial Tools For Firms Comprehensive Assessment Themes PDF to dispense important information. This template comprises five stages. It also presents valuable insights into the topics including Comparative Statement, Common Size Statement, Ratio Analysis. This is a completely customizable PowerPoint theme that can be put to use immediately. So, download it and address the topic impactfully.
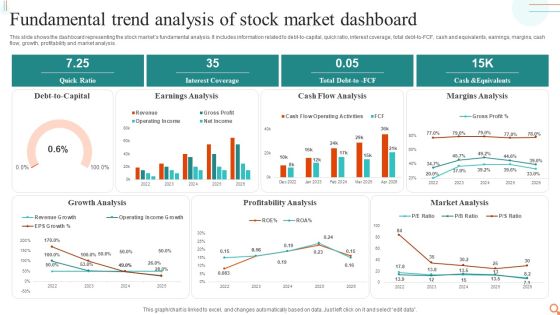
Fundamental Trend Analysis Of Stock Market Dashboard Professional PDF
This slide shows the dashboard representing the stock markets fundamental analysis. It includes information related to debt-to-capital, quick ratio, interest coverage, total debt-to-FCF, cash and equivalents, earnings, margins, cash flow, growth, profitability and market analysis.Showcasing this set of slides titled Fundamental Trend Analysis Of Stock Market Dashboard Professional PDF. The topics addressed in these templates are Earnings Analysis, Cash Flow Analysis, Margins Analysis. All the content presented in this PPT design is completely editable. Download it and make adjustments in color, background, font etc. as per your unique business setting.

Business Income And Expense Financial Performance Report Formats PDF
This slide showcases financial summary report of organization in order to analyze amount of expenditure occurred and income generated. It includes elements such as account receivable, account payable current ratio, quick ratio etc. Showcasing this set of slides titled Business Income And Expense Financial Performance Report Formats PDF. The topics addressed in these templates are Net Profit Margin, Accounts Receivable, Accounts Payable. All the content presented in this PPT design is completely editable. Download it and make adjustments in color, background, font etc. as per your unique business setting.
Sales Kpi Tracker Ppt PowerPoint Presentation Pictures Designs
This is a sales kpi tracker ppt powerpoint presentation pictures designs. This is a two stage process. The stages in this process are leads created, sales ratio, opportunities won, top products in revenue, win ratio vs last yr.
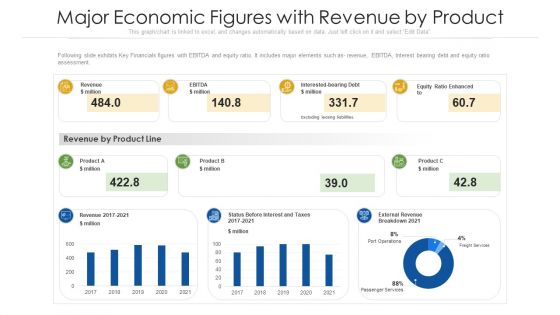
Major Economic Figures With Revenue By Product Ppt PowerPoint Presentation Gallery Guidelines PDF
Following slide exhibits Key Financials figures with EBITDA and equity ratio. It includes major elements such as- revenue, EBITDA, Interest bearing debt and equity ratio assessment. Showcasing this set of slides titled major economic figures with revenue by product ppt powerpoint presentation gallery guidelines pdf. The topics addressed in these templates are revenue, services, equity ratio. All the content presented in this PPT design is completely editable. Download it and make adjustments in color, background, font etc. as per your unique business setting.
Valuation Comparison With Competitors Icons PDF
The slide provides relative valuation of the company comparing to its competitors. It provides comparison on the basis of share price, market capitalization, enterprise value, Price Earning PE ratio EV or EBITDA ratio. Deliver and pitch your topic in the best possible manner with this valuation comparison with competitors icons pdf. Use them to share invaluable insights on enterprise, value, price, ratio, interest and impress your audience. This template can be altered and modified as per your expectations. So, grab it now.
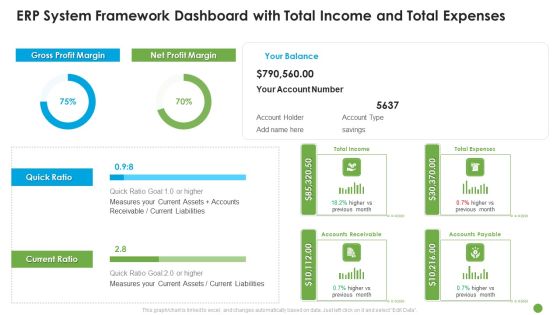
ERP System Framework Dashboard With Total Income And Total Expenses Ppt Portfolio Graphic Images PDF
Deliver and pitch your topic in the best possible manner with this erp system framework dashboard with total income and total expenses ppt portfolio graphic images pdf. Use them to share invaluable insights on measures, goal, current ratio, quick ratio and impress your audience. This template can be altered and modified as per your expectations. So, grab it now.

Business Sales Highlights With Top Revenue Products Designs PDF
Showcasing this set of slides titled Business Sales Highlights With Top Revenue Products Designs PDF. The topics addressed in these templates are Sale Ratios, Quick Ratio Target, Revenue. All the content presented in this PPT design is completely editable. Download it and make adjustments in color, background, font etc. as per your unique business setting.
