AI PPT Maker
Templates
PPT Bundles
Design Services
Business PPTs
Business Plan
Management
Strategy
Introduction PPT
Roadmap
Self Introduction
Timelines
Process
Marketing
Agenda
Technology
Medical
Startup Business Plan
Cyber Security
Dashboards
SWOT
Proposals
Education
Pitch Deck
Digital Marketing
KPIs
Project Management
Product Management
Artificial Intelligence
Target Market
Communication
Supply Chain
Google Slides
Research Services
 One Pagers
All Categories
-
Home
- Customer Favorites
- Profit Improvement
Profit Improvement
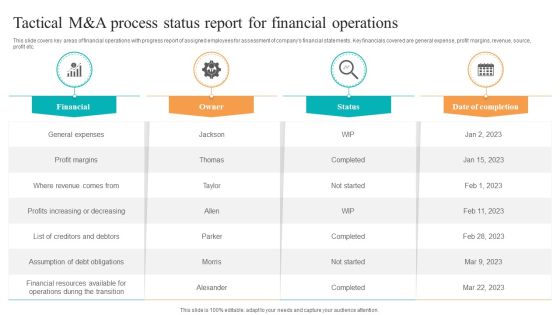
Tactical M And A Process Status Report For Financial Operations Ppt Outline Objects PDF
This slide covers key areas of financial operations with progress report of assigned employees for assessment of companys financial statements. Key financials covered are general expense, profit margins, revenue, source, profit etc. Showcasing this set of slides titled Tactical M And A Process Status Report For Financial Operations Ppt Outline Objects PDF. The topics addressed in these templates are Financial, General Expenses, Profit Margins. All the content presented in this PPT design is completely editable. Download it and make adjustments in color, background, font etc. as per your unique business setting.

Hospital Medical Research Company Profile Business Verticals Year On Year Growth Themes PDF
The slide showcases the healthcare company historical yearly growth for profit and revenue. It also showcases comparative revenue and profit year on year growth for pharmacy, hospital and research business verticals Deliver an awe inspiring pitch with this creative Hospital Medical Research Company Profile Business Verticals Year On Year Growth Themes PDF bundle. Topics like Comparative Profit, YoY Growth, Comparative Revenue, Company YoY Growth can be discussed with this completely editable template. It is available for immediate download depending on the needs and requirements of the user.
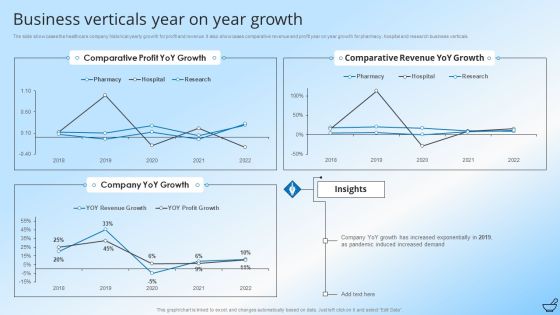
Pharmaceutical And Clinical Research Summary Business Verticals Year On Year Growth Ideas PDF
The slide showcases the healthcare company historical yearly growth for profit and revenue. It also showcases comparative revenue and profit year on year growth for pharmacy, hospital and research business verticals. Deliver and pitch your topic in the best possible manner with this Pharmaceutical And Clinical Research Summary Business Verticals Year On Year Growth Ideas PDF. Use them to share invaluable insights on Comparative Profit, Growth and impress your audience. This template can be altered and modified as per your expectations. So, grab it now.

Earning Potential From Corporate Mergers And Acquisitions Clipart PDF
This slide illustrates profit generated from mergers and acquisitions in last 5 years and future profit potential from similar deals. It includes closed transactions, revenue generation, revenue growth etc. Presenting Earning Potential From Corporate Mergers And Acquisitions Clipart PDF to dispense important information. This template comprises five stages. It also presents valuable insights into the topics including Operating Profit, Acquired Business, Revenue Generated. This is a completely customizable PowerPoint theme that can be put to use immediately. So, download it and address the topic impactfully.
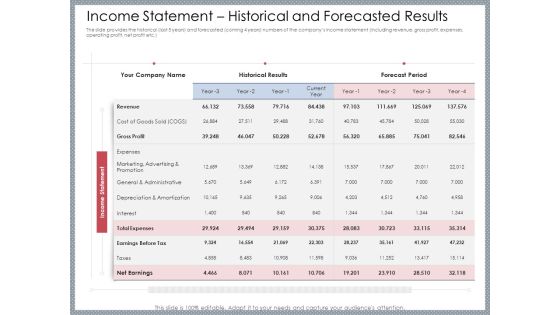
Mezzanine Venture Capital Funding Pitch Deck Income Statement Historical And Forecasted Results Elements PDF
The slide provides the historical last five years and forecasted coming four years numbers of the companys income statement including revenue, gross profit, expenses, operating profit, net profit etc. Deliver and pitch your topic in the best possible manner with this mezzanine venture capital funding pitch deck income statement historical and forecasted results elements pdf. Use them to share invaluable insights on income, historical, marketing, expenses, taxes and impress your audience. This template can be altered and modified as per your expectations. So, grab it now.
Monthly Financial Performance Outcome Reporting Icons PDF
This slide showcases a report showing monthly results financial performance to ensure constant revenue growth. It includes key components such as gross profit margin, operating expenses ratio, operating profit margin, net profit margin, earning before interest and taxes, etc. Showcasing this set of slides titled Monthly Financial Performance Outcome Reporting Icons PDF. The topics addressed in these templates are Operating Expenses, Income Statement, Operating Expenses Ratio. All the content presented in this PPT design is completely editable. Download it and make adjustments in color, background, font etc. as per your unique business setting.
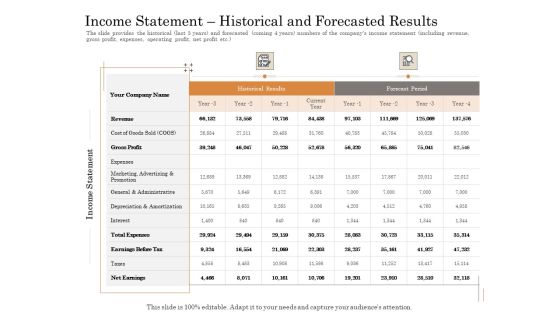
Subordinated Loan Funding Income Statement Historical And Forecasted Results Ppt Outline Graphics Download PDF
The slide provides the historical last 5 years and forecasted coming 4 years numbers of the company s income statement including revenue, gross profit, expenses, operating profit, net profit etc.Deliver an awe inspiring pitch with this creative subordinated loan funding income statement historical and forecasted results ppt outline graphics download pdf. bundle. Topics like marketing, advertising promotion, general administrative, depreciation amortization, interest. can be discussed with this completely editable template. It is available for immediate download depending on the needs and requirements of the user.

Deriving Earning Potential From Details Of Company Balance Sheet And Income Statement Guidelines PDF
This slide illustrates finding profit potential of a corporation for evaluating its equity investment. It includes calculation of Earning before interest and taxes EBIT, profit after taxes EBT etc. Presenting Deriving Earning Potential From Details Of Company Balance Sheet And Income Statement Guidelines PDF to dispense important information. This template comprises one stages. It also presents valuable insights into the topics including Revenues, Operating Expenses, Profit. This is a completely customizable PowerPoint theme that can be put to use immediately. So, download it and address the topic impactfully.

Business Overview Of Mid Term Earning Potential And Expectations Slides PDF
This slide illustrates business overview and profit potential of a corporation. It includes group revenue shares, business revenue, EBITDA, volume growth, profit growth and operating margins etc. Showcasing this set of slides titled Business Overview Of Mid Term Earning Potential And Expectations Slides PDF. The topics addressed in these templates are Value Growth, Profit Growth, Operating Margin. All the content presented in this PPT design is completely editable. Download it and make adjustments in color, background, font etc. as per your unique business setting.
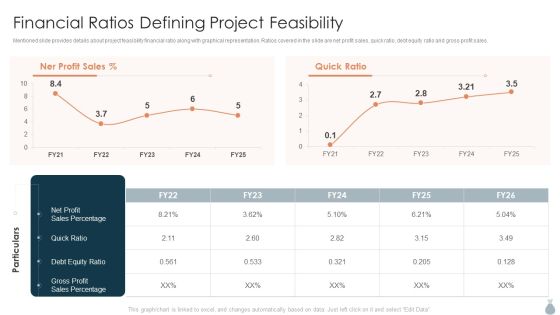
Real Estate Development Project Financing Financial Ratios Defining Project Feasibility Themes PDF
Mentioned slide provides details about project feasibility financial ratio along with graphical representation. Ratios covered in the slide are net profit sales, quick ratio, debt equity ratio and gross profit sales.Deliver and pitch your topic in the best possible manner with this Real Estate Development Project Financing Financial Ratios Defining Project Feasibility Themes PDF. Use them to share invaluable insights on Debt Equity, Sales Percentage, Gross Profit and impress your audience. This template can be altered and modified as per your expectations. So, grab it now.

Real Estate Developers Funding Alternatives Financial Ratios Defining Project Feasibility Download PDF
Mentioned slide provides details about project feasibility financial ratio along with graphical representation. Ratios covered in the slide are net profit sales, quick ratio, debt equity ratio and gross profit sales. Deliver an awe inspiring pitch with this creative Real Estate Real Estate Developers Funding Alternatives Financial Ratios Defining Project Feasibility Download PDF bundle. Topics like Quick Ratio, Debt Equity Ratio, Gross Profit Sales can be discussed with this completely editable template. It is available for immediate download depending on the needs and requirements of the user.

Stock Market Research Report Income Statement Of Target Company Background PDF
The purpose of the following slide is to display the organizations profit and loss statements Key Performance Indicators such as Net Sales, Expenses, EBITDA and Profit before and after tax. Deliver and pitch your topic in the best possible manner with this stock market research report income statement of target company background pdf. Use them to share invaluable insights on revenue, gross profit, operating expenses, research and development, sales and marketing and impress your audience. This template can be altered and modified as per your expectations. So, grab it now.

Evaluation Of Earning Potential From Gross Earning And Ebit Dashboard Professional PDF
This slide illustrates finding profit potential of a corporation while studying gross profit margin and EBITDA. It includes key operating expenditure and gross profit margin, EBITDA dollar MM and EBITDA percent margin etc. Showcasing this set of slides titled Evaluation Of Earning Potential From Gross Earning And Ebit Dashboard Professional PDF. The topics addressed in these templates are Evaluation Of Earning Potential, Gross Earning, Ebit Dashboard. All the content presented in this PPT design is completely editable. Download it and make adjustments in color, background, font etc. as per your unique business setting.

Key Performance Indicators To Track The Success Of Accounting And Finance Transformation Ideas PDF
The slide shows key Performance Indicator KPI which will help the company to track the success of Accounting and Finance Transformation. Major KPIs include revenue, operating profit margin, net profit margin, invoice errors, net discount etc. Deliver and pitch your topic in the best possible manner with this Key Performance Indicators To Track The Success Of Accounting And Finance Transformation Ideas PDF. Use them to share invaluable insights on Revenue, Net Profit Margin, Target and impress your audience. This template can be altered and modified as per your expectations. So, grab it now.
Firms Financial Assessment For Two Years Icons PDF
This slide shows financial analysis of a firm for two consecutive years that shows increase or decrease in profit after tax. It includes particulars like revenue form operation, expenses and profit after tax etc. Showcasing this set of slides titled Firms Financial Assessment For Two Years Icons PDF. The topics addressed in these templates are Revenue Operations, Profit Before Tax, Particulars. All the content presented in this PPT design is completely editable. Download it and make adjustments in color, background, font etc. as per your unique business setting.

Financial Highlights For Construction Company Yearly Report Template PDF
This slide showcases report for construction company annual financial highlights that can help in analyzing the financial health of organization and help investors to make informed decisions. It outlines information about turnover, profit before tax, profit after, equity capital and reserves. Pitch your topic with ease and precision using this Financial Highlights For Construction Company Yearly Report Template PDF. This layout presents information on Reserve And Surplus, Profit, Turnover. It is also available for immediate download and adjustment. So, changes can be made in the color, design, graphics or any other component to create a unique layout.
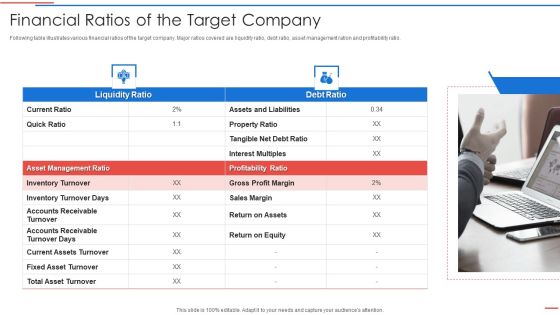
Due Diligence Process In Merger And Acquisition Agreement Financial Ratios Of The Target Company Guidelines PDF
Following table illustrates various financial ratios of the target company. Major ratios covered are liquidity ratio, debt ratio, asset management ration and profitability ratio.This is a due diligence process in merger and acquisition agreement financial ratios of the target company guidelines pdf template with various stages. Focus and dispense information on two stages using this creative set, that comes with editable features. It contains large content boxes to add your information on topics like assets and liabilities, profitability ratio, gross profit margin You can also showcase facts, figures, and other relevant content using this PPT layout. Grab it now.

Finance And Accounting Online Conversion Plan Key Performance Indicators To Track Microsoft PDF
The slide shows key Performance Indicator KPI which will help the company to track the success of Accounting and Finance Transformation. Major KPIs include revenue, operating profit margin, net profit margin, invoice errors, net discount etc. Deliver an awe inspiring pitch with this creative Finance And Accounting Online Conversion Plan Key Performance Indicators To Track Microsoft PDF bundle. Topics like Operating Profit, Percentage Invoice, Revenue can be discussed with this completely editable template. It is available for immediate download depending on the needs and requirements of the user.

Strategic Guide To Perform Marketing Different Types Of Marketing Process Control Portrait PDF
This slide presents various types of marketing controls to evaluate existing promotional efforts and identify improvement areas. It showcases types such as annual plan control, profitability control, efficiency control and strategic control. Are you searching for a Strategic Guide To Perform Marketing Different Types Of Marketing Process Control Portrait PDF that is uncluttered, straightforward, and original Its easy to edit, and you can change the colors to suit your personal or business branding. For a presentation that expresses how much effort youve put in, this template is ideal With all of its features, including tables, diagrams, statistics, and lists, its perfect for a business plan presentation. Make your ideas more appealing with these professional slides. Download Strategic Guide To Perform Marketing Different Types Of Marketing Process Control Portrait PDF from Slidegeeks today.

2013 New Year Innovation PowerPoint Templates Ppt Backgrounds For Slides 1212
We present our 2013 New Year Innovation PowerPoint Templates PPT Backgrounds For Slides 1212.Present our Light bulbs PowerPoint Templates because your ideas are fundamentally stable with a broad base of workable possibilities. Download and present our Business PowerPoint Templates because profit levels have been steady over the recent past. Spread your heightened excitement to others in the room. Download our Marketing PowerPoint Templates because The marketplace is the merger of your dreams and your ability. Present our Future PowerPoint Templates because you have what it takes to grow. Download our Success PowerPoint Templates because your quest has taken you well onto the path of success.Use these PowerPoint slides for presentations relating to 2013 improvement future, business, success, future, light bulbs, marketing. The prominent colors used in the PowerPoint template are Green, Red, Blue light. We assure you our 2013 New Year Innovation PowerPoint Templates PPT Backgrounds For Slides 1212 are Appealing. Customers tell us our business PowerPoint templates and PPT Slides are Classic. Customers tell us our 2013 New Year Innovation PowerPoint Templates PPT Backgrounds For Slides 1212 are Efficient. The feedback we get is that our future PowerPoint templates and PPT Slides are Youthful. PowerPoint presentation experts tell us our 2013 New Year Innovation PowerPoint Templates PPT Backgrounds For Slides 1212 are Swanky. PowerPoint presentation experts tell us our future PowerPoint templates and PPT Slides are Nifty.

Continuous Advancement List With Priority And Current State Graphics PDF
This slide covers the continuous improvement list that shows description, priority, coordinator, effort estimate, advantages and current state such as alignment of process deployment, number of product quality issues, improve service consumption, knowledge management, etc. Showcasing this set of slides titled continuous advancement list with priority and current state graphics pdf. The topics addressed in these templates are continuous advancement list with priority and current state. All the content presented in this PPT design is completely editable. Download it and make adjustments in color, background, font etc. as per your unique business setting.

Analyzation Of Business Processes Reengineering Strategies Designs PDF
The following slide highlights strategies for business process review reengineering to improve quality, output, cost, services etc. It includes strategies such as map current business state, gap analysis, find improvement opportunities, execute future changes etc. Persuade your audience using this Analyzation Of Business Processes Reengineering Strategies Designs PDF. This PPT design covers five stages, thus making it a great tool to use. It also caters to a variety of topics including Business State, Gap Analysis, Process Map. Download this PPT design now to present a convincing pitch that not only emphasizes the topic but also showcases your presentation skills.

5 Year Corporate Expansion Strategy Ppt PowerPoint Presentation Portfolio Samples PDF
The following slide showcases plan to expand business in coming years for growth and increased revenue. Major plans covered for next five years are adoption of marketing strategies, improvement in sales strategies, launch of new product line, acquisition of brands and hiring new employees.Persuade your audience using this 5 Year Corporate Expansion Strategy Ppt PowerPoint Presentation Portfolio Samples PDF. This PPT design covers five stages, thus making it a great tool to use. It also caters to a variety of topics including Adopting Marketing, Strategies To Attract, Improving Sales. Download this PPT design now to present a convincing pitch that not only emphasizes the topic but also showcases your presentation skills.

Predictive Data Model Applications Of Predictive Analytics In Healthcare Department Summary PDF
This slide outlines the application of predictive analytics in the healthcare department for forecasting the probability of patients having particular medical disorders. The benefits include improving patient outcomes, relief for healthcare professionals, and improvement in the decision making process. From laying roadmaps to briefing everything in detail, our templates are perfect for you. You can set the stage with your presentation slides. All you have to do is download these easy-to-edit and customizable templates. Predictive Data Model Applications Of Predictive Analytics In Healthcare Department Summary PDF will help you deliver an outstanding performance that everyone would remember and praise you for. Do download this presentation today.
Stacked Line With Marker Ppt PowerPoint Presentation Icon Format
This is a stacked line with marker ppt powerpoint presentation icon format. This is a twelve stage process. The stages in this process are business, strategy, marketing, success, profit million dollars, stacked column.

Waterfall Graph Showing Business Progress Ppt PowerPoint Presentation Styles Model
This is a waterfall graph showing business progress ppt powerpoint presentation styles model. This is a three stage process. The stages in this process are profit and loss, balance sheet, income statement, benefit and loss.

Marketing Employee Quarterly Performance Review Diagrams PDF
This slide outlines the quarterly performance review for a marketing employee to improve their marketing responsibilities. It includes various aspects such as overall performance, goals achieve, improvement and core values. Showcasing this set of slides titled Marketing Employee Quarterly Performance Review Diagrams PDF. The topics addressed in these templates are Reliable Work Ethic, Available Team, Goals Achieve. All the content presented in this PPT design is completely editable. Download it and make adjustments in color, background, font etc. as per your unique business setting.

Revolut Capital Funding Projections For Future And Our Ask For Revolut Pitch Deck Ppt Pictures PDF
Purpose of the following slide is to show the investment ask for Revolut pitch deck as it displays the key financials projections for the next 5 years, as it displays key metrics such as key summary data, gross revenues, Gross profit and net profit. Purpose of the following slide is to show the investment ask for Revolut pitch deck as it displays the key financials projections for the next 5 years, as it displays key metrics such as key summary data, gross revenues, Gross profit and net profit. Deliver and pitch your topic in the best possible manner with this Revolut Capital Funding Projections For Future And Our Ask For Revolut Pitch Deck Ppt Pictures PDF. Use them to share invaluable insights on Key Summary Data, Gross Revenue, Transaction Costs and impress your audience. This template can be altered and modified as per your expectations. So, grab it now.

Internet Marketing Objectives Ppt PowerPoint Presentation Summary Portrait
This is a internet marketing objectives ppt powerpoint presentation summary portrait. This is a six stage process. The stages in this process are sales revenue, profit margins, product types, repeat sales, sales leads, web visitors.

Bar Graph With Increasing Percentage Flow Powerpoint Slides
This PowerPoint slide has been designed with bar graph and increasing percentage values. This diagram slide may be used to display profit growth. Prove the viability of your ideas with this professional slide.
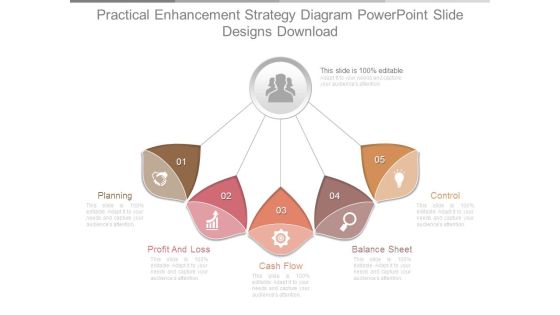
Practical Enhancement Strategy Diagram Powerpoint Slide Designs Download
This is a practical enhancement strategy diagram powerpoint slide designs download. This is a five stage process. The stages in this process are planning, profit and loss, cash flow, balance sheet, control.

Four Text Tags For Process Flow Powerpoint Template
This PPT slide contains four text tags with business icons. This PPT diagram is suitable to present concept of profit growth value analysis. Enlighten others on the process with this innovative PowerPoint template.

Stacked Line Chart Ppt PowerPoint Presentation Shapes
This is a stacked line chart ppt powerpoint presentation shapes. This is a two stage process. The stages in this process are product, profit in thousands, finance, analysis, growth.

Business Advancement Internal Growth Analyzing Present Scenario Of Firm Key Professional PDF
This slide provides information regarding the present situation firm financial with revenues generated and net profit earned. Deliver an awe-inspiring pitch with this creative business advancement internal growth analyzing present scenario of firm key professional pdf bundle. Topics like revenues, net profit, products can be discussed with this completely editable template. It is available for immediate download depending on the needs and requirements of the user.

Development In Past 10 Years Template 2 Ppt PowerPoint Presentation Professional Topics
This is a development in past 10 years template 2 ppt powerpoint presentation professional topics. This is a ten stage process. The stages in this process are net sales, other income, ebita, ebita margins, profit before tax, taxes.
Four Overlapping Steps With Icons Powerpoint Template
This PPT slide contains four overlapping steps with business icons. This PPT diagram is suitable to present concept of profit growth value analysis. Enlighten others on the process with this innovative PowerPoint template.

Scatter With Smooth Lines And Markers Ppt PowerPoint Presentation Show Template
This is a scatter with smooth lines and markers ppt powerpoint presentation show template. This is a nine stage process. The stages in this process are business, strategy, marketing, success, dollar in billions, profit in thousands.
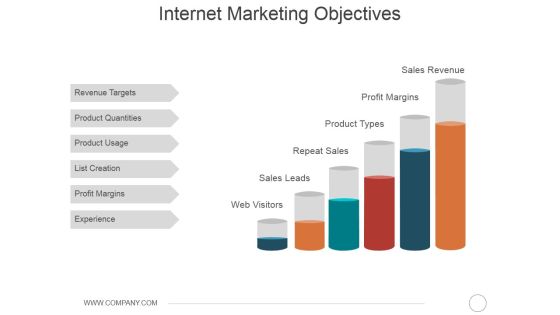
Internet Marketing Objectives Ppt PowerPoint Presentation Portfolio Summary
This is a internet marketing objectives ppt powerpoint presentation portfolio summary. This is a six stage process. The stages in this process are revenue targets, product quantities, product usage, list creation, profit margins, experience.

Area Chart Ppt PowerPoint Presentation Model Examples
This is a area chart ppt powerpoint presentation model examples. This is a two stage process. The stages in this process are year profit in dollars, business, strategy, growth.

Combo Chart Ppt PowerPoint Presentation Infographics Introduction
This is a combo chart ppt powerpoint presentation infographics introduction. This is a three stage process. The stages in this process are profit in percentage, business, graph, strategy, product.

Stacked Column Ppt PowerPoint Presentation Professional Template
This is a stacked column ppt powerpoint presentation professional template. This is a nine stage process. The stages in this process are product, profit million dollars, business, marketing, graph.

Stacked Line With Marker Ppt PowerPoint Presentation Professional Pictures
This is a stacked line with marker ppt powerpoint presentation professional pictures. This is a twelve stage process. The stages in this process are product, profit in thousands, business, graph, marketing.

Asset Allocation Ppt PowerPoint Presentation Designs
This is a asset allocation ppt powerpoint presentation designs. This is a two stage process. The stages in this process are risk reward ratio, take profit distance, stop loss distance.
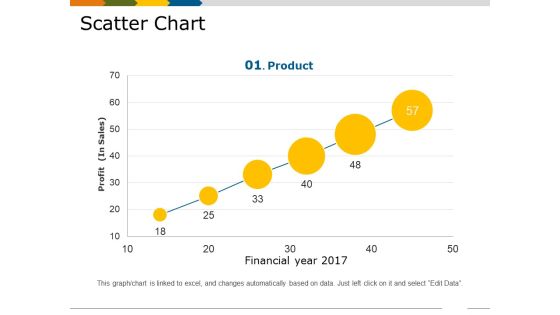
Scatter Chart Template 1 Ppt PowerPoint Presentation Show Slides
This is a scatter chart template 1 ppt powerpoint presentation show slides. This is a six stage process. The stages in this process are financial year, profit in sales, growth, business, marketing, product.

Business Performance Management Systems Ppt Example
This is a business performance management systems ppt example. This is a three stage process. The stages in this process are contribution margin, total revenue, profit of top product line.
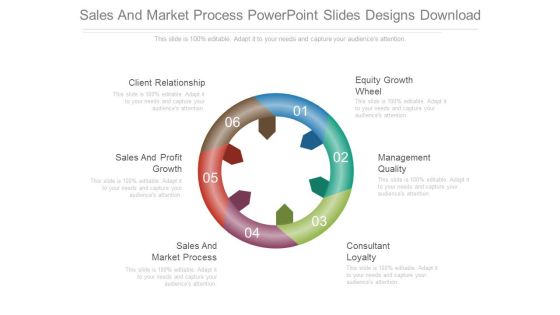
Sales And Market Process Powerpoint Slides Designs Download
This is a sales and market process powerpoint slides designs download. This is a six stage process. The stages in this process are client relationship, sales and profit growth, sales and market process, consultant loyalty, management quality, equity growth wheel.

Four Business Option Banner Diagram Powerpoint Template
This business slide contains four option banners with business icons. This PPT diagram is suitable to present concept of profit growth value analysis. Visual effect of this diagram provides more clarity to the subject.

Seven Steps Semicircular Infographic Chart Powerpoint Template
This business slide contains four option banners with business icons. This PPT diagram is suitable to present concept of profit growth value analysis. Visual effect of this diagram provides more clarity to the subject.

Business And Financial Overview Ppt PowerPoint Presentation Inspiration Clipart Images
This is a business and financial overview ppt powerpoint presentation inspiration clipart images. This is a four stage process. The stages in this process are current key offerings, revenue by geography, current technology used, profit margin, revenue.

Line Chart Ppt PowerPoint Presentation Summary Information
This is a line chart ppt powerpoint presentation summary information. This is a two stage process. The stages in this process are business, strategy, marketing, analysis, profit million dollars.

Competitor Analysis Template 3 Ppt PowerPoint Presentation Ideas Graphic Tips
This is a competitor analysis template 3 ppt powerpoint presentation ideas graphic tips. This is a four stage process. The stages in this process are net profit margin, your company, competitor.

Business Model Template 1 Ppt PowerPoint Presentation Ideas Objects
This is a business model template 1 ppt powerpoint presentation ideas objects. This is a three stage process. The stages in this process are offering, monetization, sustainability market attractiveness, profit model.

Sales Metrics And Kpi Examples Presentation Slides
This is a sales metrics and kpi examples presentation slides. This is a five stage process. The stages in this process are sales growth, sales opportunities, product performance, average profit margin, sales target.

Development In Past 10 Years Template 1 Ppt PowerPoint Presentation Infographics
This is a development in past 10 years template 1 ppt powerpoint presentation infographics. This is a ten stage process. The stages in this process are net sales, other income, ebita margins, profit before tax, taxes.
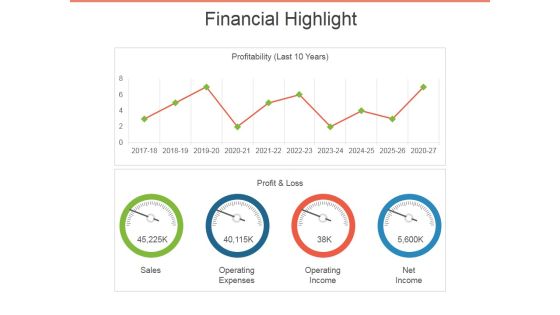
Financial Highlight Template 2 Ppt PowerPoint Presentation Outline Visuals
This is a financial highlight template 2 ppt powerpoint presentation outline visuals. This is a two stage process. The stages in this process are sales, profit and loss, operating expenses, operating income, net income.
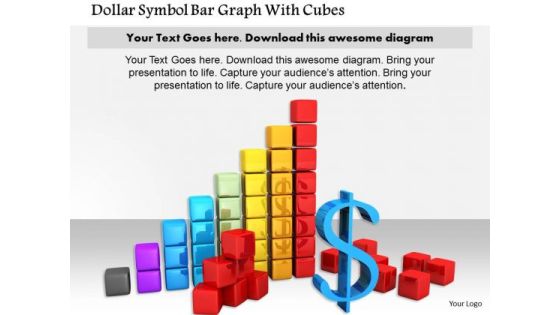
Stock Photo Dollar Symbol Bar Graph With Cubes PowerPoint Slide
This image slide contains bar graph of cubes with dollar symbol. This image is designed with dollar growth graph. Use this slide to display growth of profit in business presentations. Make an impressive presentation by using this image.
Success Strategies For Business Women Ppt Examples
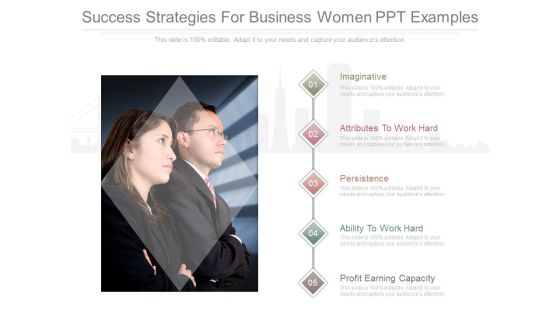
This is a success strategies for business women ppt examples. This is a six stage process. The stages in this process are imaginative, attributes to work hard, persistence, ability to work hard, profit earning capacity.
Financial Objective Powerpoint Slide
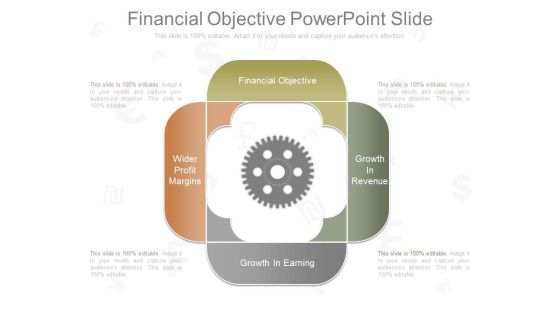
This is a financial objective powerpoint slide. This is a four stage process. The stages in this process are financial objective, growth in revenue, growth in earning, wider profit margins.

Stock Photo Stacks Of Dollar Coins PowerPoint Slide
This image contains stack of dollar coins. Use this image in finance and money related topics. Pass your ideas through this image slide in relation to profit growth. It will amplify your brilliance.
Stock Photo Colorful Arrows In Upward Position PowerPoint Slide
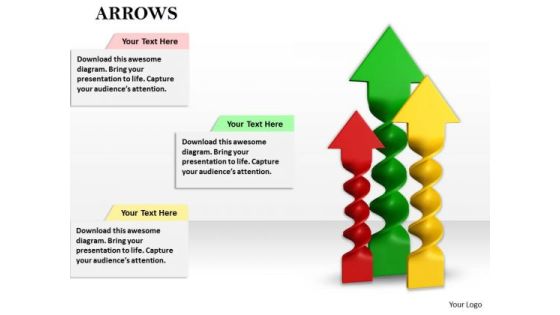
This graphic image slide has been crafted with graphic of colorful twisted arrows. These arrows are in upward direction which shows the concept of profit and growth. Use this image slide in your business and finance related presentations.

Bar Graph For Marketing Research Process Powerpoint Slides
This PowerPoint template has been designed with diagram of bar graph. This PPT slide can be used to prepare presentations for profit growth report and also for financial data analysis. You can download finance PowerPoint template to prepare awesome presentations.

Successful Brand Development Plan Year Over Year Growth Comparison Clipart PDF
Following slide displays yearly growth comparison informational statistics. It includes details about revenues, operating profit and net profit. Deliver and pitch your topic in the best possible manner with this successful brand development plan year over year growth comparison clipart pdf. Use them to share invaluable insights on year over year growth comparison and impress your audience. This template can be altered and modified as per your expectations. So, grab it now.
Four Circle Chart With Percentage Ratios Powerpoint Slides
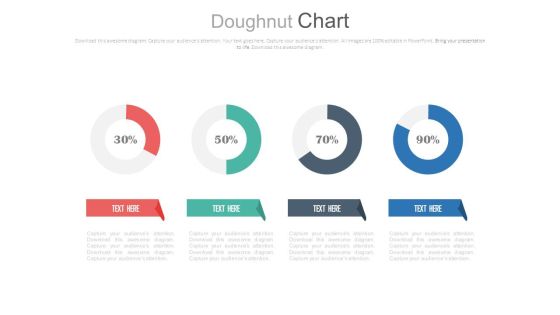
This PowerPoint template has been designed with graphics of four circles and percentage ratios. You may use this dashboard slide design for topics like profit growth and financial planning. This PPT slide is powerful tool to describe your ideas.

Linear Circles Percentage Analysis Charts Powerpoint Slides
This PowerPoint template has been designed with graphics of three circles and percentage ratios. You may use this dashboard slide design for topics like profit growth and financial planning. This PPT slide is powerful tool to describe your ideas.
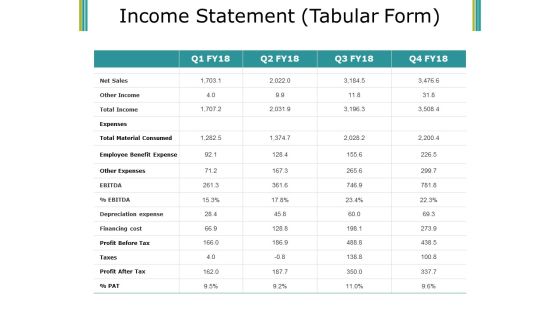
Income Statement Ppt PowerPoint Presentation Layouts Show
This is a income statement ppt powerpoint presentation layouts show. This is a four stage process. The stages in this process are net sales, expenses, total income, texas, profit after tax.
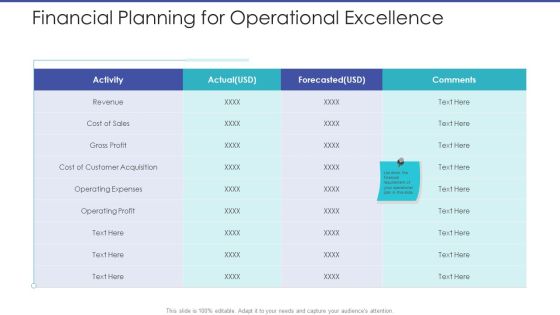
Tactical Planning For Marketing And Commercial Advancement Financial Planning For Operational Excellence Mockup PDF
Deliver and pitch your topic in the best possible manner with this tactical planning for marketing and commercial advancement financial planning for operational excellence mockup pdf. Use them to share invaluable insights on revenue, cost of sales, gross profit, cost of customer acquisition, operating expenses, operating profit and impress your audience. This template can be altered and modified as per your expectations. So, grab it now.
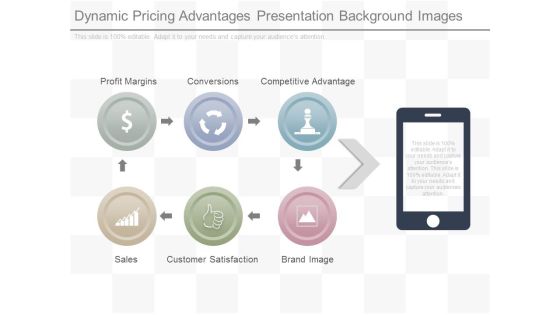
Dynamic Pricing Advantages Presentation Background Images
This is a dynamic pricing advantages presentation background images. This is a six stage process. The stages in this process are profit margins, conversions, competitive advantage, sales, customer satisfaction, brand image.
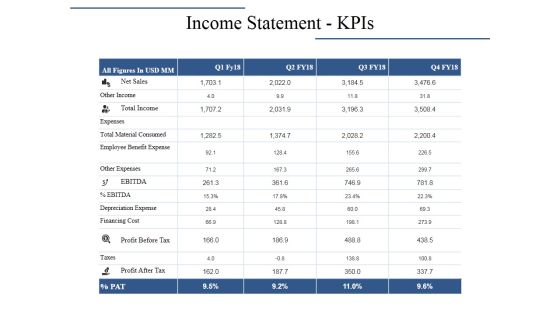
Income Statement Kpis Ppt PowerPoint Presentation Layouts Graphics Pictures
This is a income statement kpis ppt powerpoint presentation layouts graphics pictures. This is a four stage process. The stages in this process are net sales, total income, other income, profit before tax, expenses.
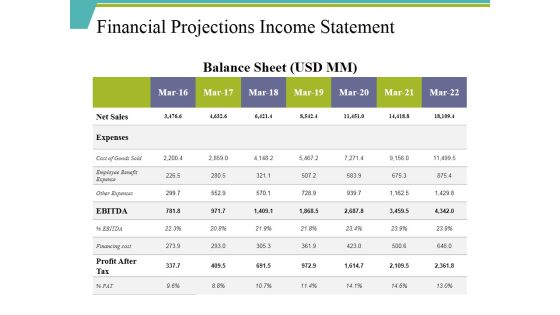
Financial Projections Income Statement Ppt PowerPoint Presentation Show Master Slide
This is a financial projections income statement ppt powerpoint presentation show master slide. This is a seven stage process. The stages in this process are net sales, expenses, profit after tax, other expenses, ebitda.
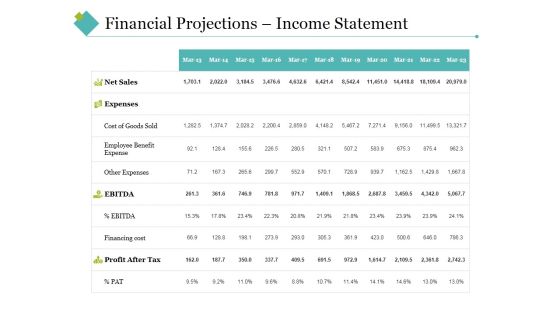
Financial Projections Income Statement Ppt PowerPoint Presentation Portfolio Clipart Images
This is a financial projections income statement ppt powerpoint presentation portfolio clipart images. This is a four stage process. The stages in this process are net sales, expenses, ebitda, profit after tax, financing cost.
Financial Projections Income Statement Ppt PowerPoint Presentation Infographic Template Icon
This is a financial projections income statement ppt powerpoint presentation infographic template icon. This is a eleven stage process. The stages in this process are expenses, total sales, other expenses, profit after tax, net sales.
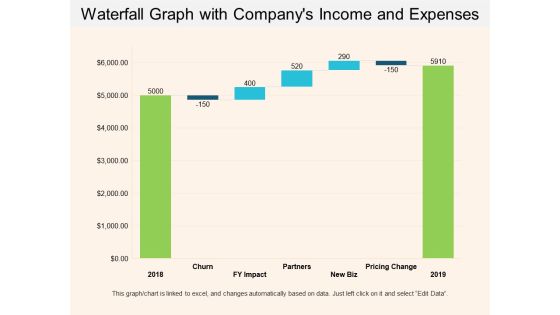
Waterfall Graph With Companys Income And Expenses Ppt PowerPoint Presentation Show Example Introduction
This is a waterfall graph with companys income and expenses ppt powerpoint presentation show example introduction. This is a three stage process. The stages in this process are profit and loss, balance sheet, income statement, benefit and loss.
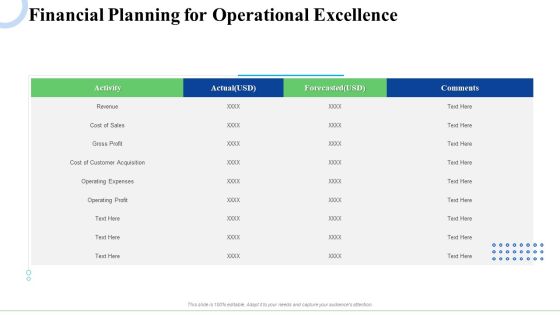
Strategic Plan For Business Expansion And Growth Financial Planning For Operational Excellence Clipart PDF
Deliver and pitch your topic in the best possible manner with this strategic plan for business expansion and growth financial planning for operational excellence clipart pdf. Use them to share invaluable insights on revenue, cost of sales, gross profit, cost of customer acquisition, operating expenses, operating profit and impress your audience. This template can be altered and modified as per your expectations. So, grab it now.
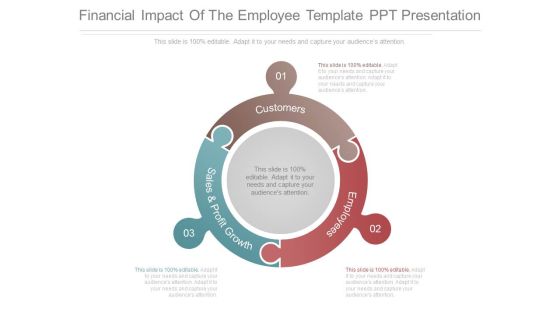
Financial Impact Of The Employee Template Ppt Presentation
This is a financial impact of the employee template ppt presentation. This is a three stage process. The stages in this process are customers, employees, sales and profit growth.

Market And Customer Segmentation Ppt Images
This is a market and customer segmentation ppt images. This is a four stage process. The stages in this process are market and customer segmentation, identification of profit pools, brand positioning and development, customer solution pricing.
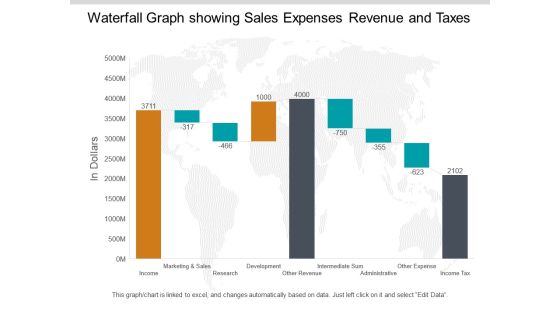
Waterfall Graph Showing Sales Expenses Revenue And Taxes Ppt PowerPoint Presentation Pictures Summary
This is a waterfall graph showing sales expenses revenue and taxes ppt powerpoint presentation pictures summary. This is a three stage process. The stages in this process are profit and loss, balance sheet, income statement, benefit and loss.

Decision Making For Risk Management Diagram Ppt Sample
This is a decision making for risk management diagram ppt sample. This is a four stage process. The stages in this process are uncertainty, return on capital shareholder focus, profit volatility shareholder focus, required capital policyholder focus.

Sales Revenue Product Ppt PowerPoint Presentation Infographic Template Backgrounds
This is a sales revenue product ppt powerpoint presentation infographic template backgrounds. This is a three stage process. The stages in this process are product wise revenue, profit percent of total revenue, total income product.
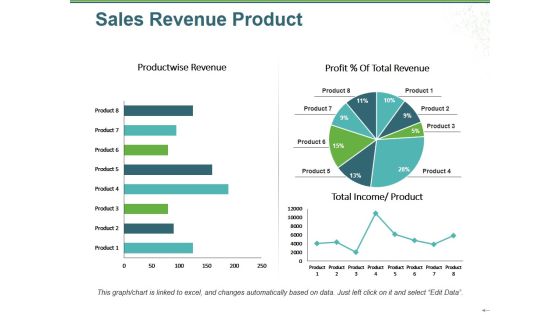
Sales Revenue Product Ppt PowerPoint Presentation Infographic Template Infographic Template
This is a sales revenue product ppt powerpoint presentation infographic template infographic template. This is a three stage process. The stages in this process are product wise revenue, total income, product, profit total revenue, pie.

Organization Strategy Diagram Ppt Slides Download
This is a organization strategy diagram ppt slides download. This is a six stage process. The stages in this process are profit formula, customer value proposition, situation analysis, deriving strategies, monitor and control, problem identification.
Business Emerging Markets Powerpoint Ideas
This is a business emerging markets powerpoint ideas. This is a four stage process. The stages in this process are key resources, customer value proposition, profit formula, key processes.

Bar Graph For Marketing Research Data Powerpoint Slides
This PowerPoint template has been designed with diagram of bar graph. This PPT slide can be used to prepare presentations for profit growth report and also for financial data analysis. You can download finance PowerPoint template to prepare awesome presentations.

Circle Diagram For Business Marketing Mix Powerpoint Slides
This PowerPoint template has been designed with nine steps circle chart. This PPT slide can be used to prepare presentations for profit growth report and also for financial data analysis. You can download finance PowerPoint template to prepare awesome presentations.

Pie Charts For Financial Ratio Analysis Powerpoint Slides
This PowerPoint template has been designed with diagram of pie charts. This PPT slide can be used to prepare presentations for profit growth report and also for financial data analysis. You can download finance PowerPoint template to prepare awesome presentations.

Pyramid For Financial Accounting Information Powerpoint Slides
This PowerPoint template has been designed with graphics of pyramid chart. This PPT slide can be used to prepare presentations for profit growth report and also for financial data analysis. You can download finance PowerPoint template to prepare awesome presentations.

Internet Marketing Objectives Ppt PowerPoint Presentation Layouts Smartart
This is a internet marketing objectives ppt powerpoint presentation layouts smartart. This is a six stage process. The stages in this process are sales leads, product types, sales revenue, profit margins, repeat sales, web visitors.

Technological Advantage Ppt Slides Examples
This is a technological advantage ppt slides examples. This is a four stage process. The stages in this process are exclusive information, profit advantage, technological advantage, unique product, exclusive information.

Stock Photo 3d Blue Glossy Dices Strategy PowerPoint Slide
Our above image slide has been designed with 3d blue glossy dices. This slide contains the concept of gaming and gambling. This PowerPoint slide can be used for various topics business strategy, success. Profit etc.

Sample Marketing Consumer Goods Ppt Presentation
This is a sample marketing consumer goods ppt presentation. This is a six stage process. The stages in this process are industrial goods, service goods, international marketing, business marketing, non profit marketing, consumer goods.

Product Portfolio Analysis Ppt Powerpoint Templates
This is a product portfolio analysis ppt powerpoint templates. This is a four stage process. The stages in this process are green product portfolio analysis, profit contribution, low, high, problematic, productive, prohibitive, promising, environmental impact.
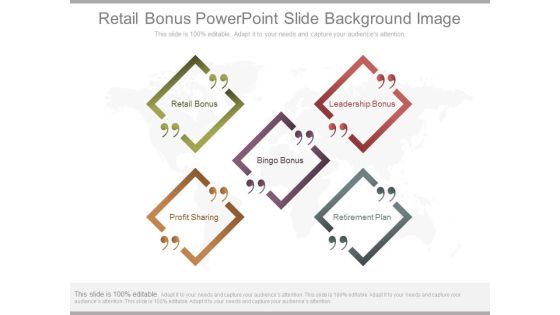
Retail Bonus Powerpoint Slide Background Image
This is a retail bonus powerpoint slide background image. This is a five stage process. The stages in this process are retail bonus, bingo bonus, profit sharing, leadership bonus, retirement plan.

Asset Allocation Decision Diagram Powerpoint Slide Influencers
This is a asset allocation decision diagram powerpoint slide influencers. This is a two stage process. The stages in this process are risk reward ratio, take profit distance, stop loss distance, reward, risk.
Reward Risk Balancing Scale Ppt Slide Templates
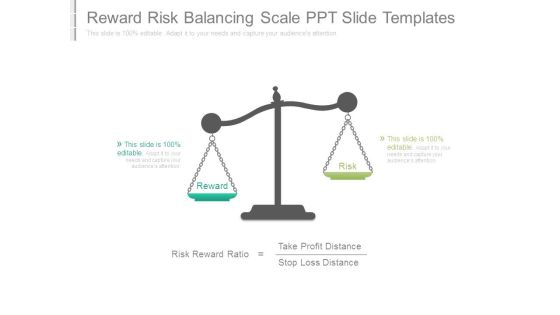
This is a reward risk balancing scale ppt slide templates. This is a two stage process. The stages in this process are risk reward ratio, reward, risk, take profit distance, stop loss distance.

Asset Allocation Ppt PowerPoint Presentation Backgrounds
This is a asset allocation ppt powerpoint presentation backgrounds. This is a two stage process. The stages in this process are reward, risk, risk reward ratio, take profit distance, stop loss distance.
Waterfall Graph For Budget Variance And Analysis Ppt PowerPoint Presentation Slides Mockup
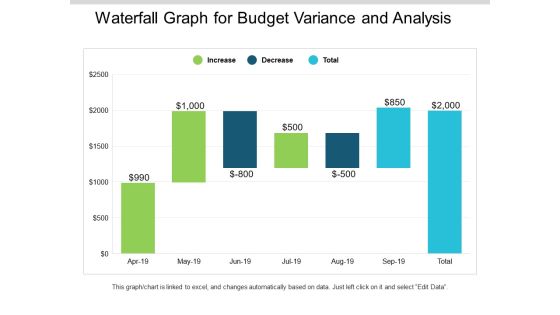
This is a waterfall graph for budget variance and analysis ppt powerpoint presentation slides mockup. This is a three stage process. The stages in this process are profit and loss, balance sheet, income statement, benefit and loss.

Waterfall Graph Showing Births Deaths And Population Change Ppt PowerPoint Presentation Infographic Template Visual Aids
This is a waterfall graph showing births deaths and population change ppt powerpoint presentation infographic template visual aids. This is a three stage process. The stages in this process are profit and loss, balance sheet, income statement, benefit and loss.
Waterfall Graph Showing Monetary Transactions Ppt PowerPoint Presentation Ideas Visuals
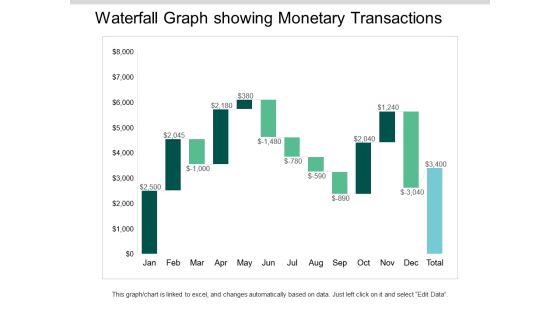
This is a waterfall graph showing monetary transactions ppt powerpoint presentation ideas visuals. This is a three stage process. The stages in this process are profit and loss, balance sheet, income statement, benefit and loss.

Waterfall Graph Summarize Budget 2018 To 2019 Ppt PowerPoint Presentation Summary Slides
This is a waterfall graph summarize budget 2018 to 2019 ppt powerpoint presentation summary slides. This is a three stage process. The stages in this process are profit and loss, balance sheet, income statement, benefit and loss.

Waterfall Graph With Monthly Expenses And Savings Ppt PowerPoint Presentation Layouts Clipart Images
This is a waterfall graph with monthly expenses and savings ppt powerpoint presentation layouts clipart images. This is a three stage process. The stages in this process are profit and loss, balance sheet, income statement, benefit and loss.
Monetary Benefits Ppt PowerPoint Presentation Slides Information
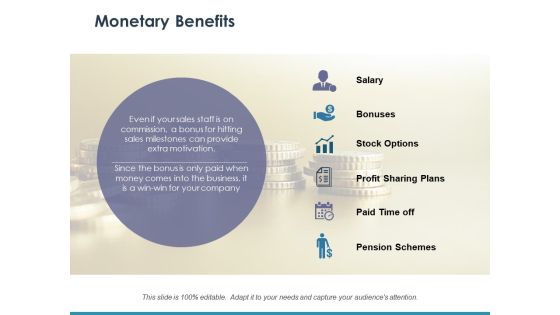
This is a monetary benefits ppt powerpoint presentation slides information. This is a six stage process. The stages in this process are salary, bonuses, stock options, profit sharing plans, paid time off.

Monetary Benefits Ppt PowerPoint Presentation Clipart
This is a monetary benefits ppt powerpoint presentation clipart. This is a six stage process. The stages in this process are salary, bonuses, stock options, profit sharing plans, pension schemes.
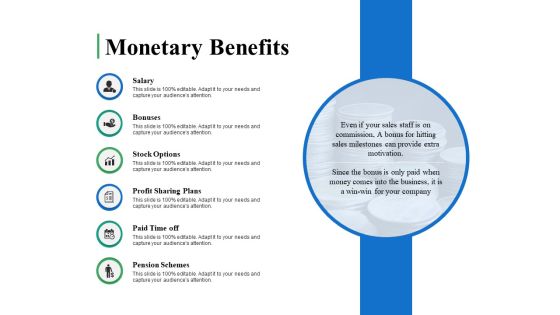
Monetary Benefits Ppt PowerPoint Presentation Summary Ideas
This is a monetary benefits ppt powerpoint presentation summary ideas. This is a six stage process. The stages in this process are salary, bonuses, stock options, profit sharing plans, pension schemes.
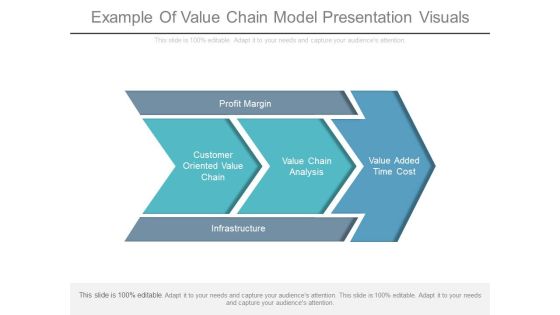
Example Of Value Chain Model Presentation Visuals
This is a example of value chain model presentation visuals. This is a five stage process. The stages in this process are profit margin, customer oriented value chain, value chain analysis, value added time cost, infrastructure.
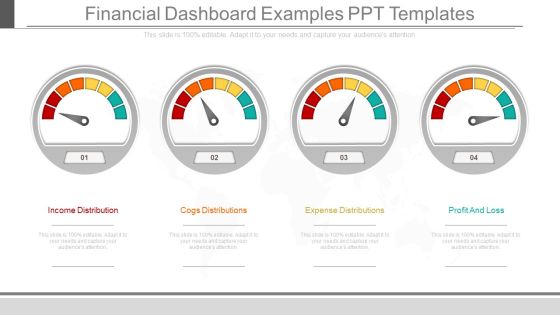
Financial Dashboard Examples Ppt Templates
This is a financial dashboard examples ppt templates. This is a four stage process. The stages in this process are income distribution, cogs distributions, expense distributions, profit and loss.
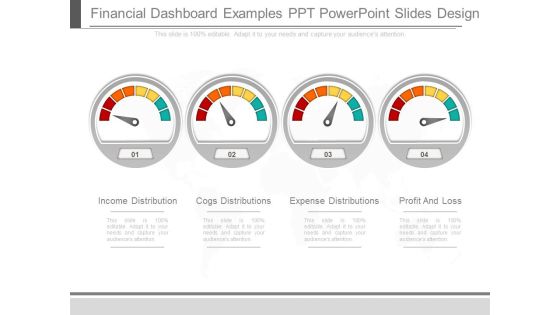
Financial Dashboard Examples Ppt Powerpoint Slides Design
This is a financial dashboard examples ppt powerpoint slides design. This is a four stage process. The stages in this process are income distribution, cogs distributions, expense distributions, profit and loss.

Pandl Kpis Ppt PowerPoint Presentation Gallery Display
This is a pandl kpis ppt powerpoint presentation gallery display. This is a four stage process. The stages in this process are net sales, total income, expenses, ebitda, profit after tax.
P And L Kpis Template 1 Ppt PowerPoint Presentation Icon Graphics Download
This is a p and l kpis template 1 ppt powerpoint presentation icon graphics download. This is a four stage process. The stages in this process are net sales, total income, expenses, financing cost, profit after tax.

Monetary Benefits Ppt PowerPoint Presentation Ideas Design Inspiration
This is a monetary benefits ppt powerpoint presentation ideas design inspiration. This is a six stage process. The stages in this process are salary, bonuses, stoke options, profit sharing plans, paid time off.

Competitors Analysis Template Ppt PowerPoint Presentation Infographic Template Rules
This is a competitors analysis template ppt powerpoint presentation infographic template rules. This is a four stage process. The stages in this process are net profit margin, finance, marketing, bar, success.
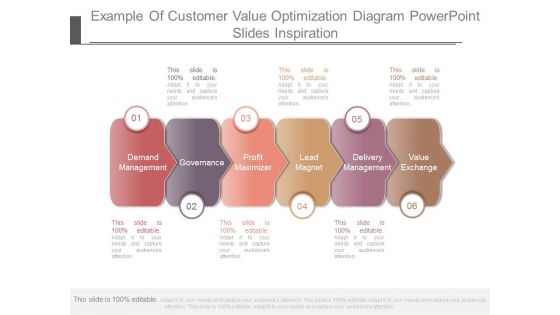
Example Of Customer Value Optimization Diagram Powerpoint Slides Inspiration
This is a example of customer value optimization diagram powerpoint slides inspiration. This is a six stage process. The stages in this process are demand management, governance, profit maximizer, lead magnet, delivery management, value exchange.
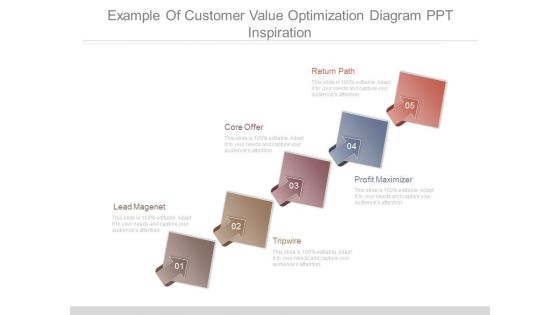
Example Of Customer Value Optimization Diagram Ppt Inspiration
This is a example of customer value optimization diagram ppt inspiration. This is a five stage process. The stages in this process are lead magnet, core offer, return path, tripwire, profit maximizer.

Value Based Pricing Example Example Of Ppt Presentation
This is a value based pricing example example of ppt presentation. This is a five stage process. The stages in this process are demand, sales, brand image, profit margins, conversions.
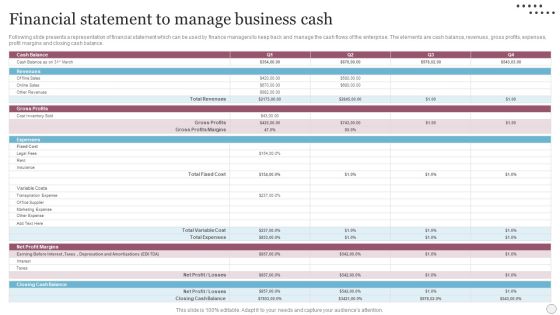
Financial Statement To Manage Business Cash Demonstration PDF
Following slide presents a representation of financial statement which can be used by finance managers to keep track and manage the cash flows of the enterprise. The elements are cash balance, revenues, gross profits, expenses, profit margins and closing cash balance. Following slide presents a representation of financial statement which can be used by finance managers to keep track and manage the cash flows of the enterprise. The elements are cash balance, revenues, gross profits, expenses, profit margins and closing cash balance. Pitch your topic with ease and precision using this Financial Statement To Manage Business Cash Demonstration PDF. This layout presents information on Financial statement to manage business cash. It is also available for immediate download and adjustment. So, changes can be made in the color, design, graphics or any other component to create a unique layout.

Pricing Objectives Diagram Sample Of Ppt Presentation
This is a pricing objectives diagram sample of ppt presentation. This is a seven stage process. The stages in this process are pricing objectives, revenue maximization, profit maximization, partial cost recovery, survival, status quo, quantity leader, maximize quantity.

Business Intelligence Performance Dashboard Ppt Powerpoint Slides
This is a business intelligence performance dashboard ppt powerpoint slides. This is a six stage process. The stages in this process are total revenue, detailed profit of top product line, part capacity allocation, market share, customer satisfaction, quality notification.
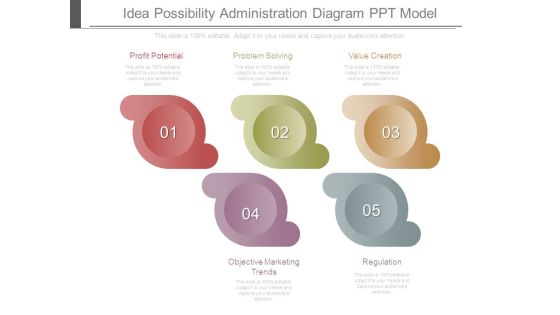
Idea Possibility Administration Diagram Ppt Model
This is a idea possibility administration diagram ppt model. This is a five stage process. The stages in this process are profit potential, problem solving, value creation, objective marketing trends, regulation.

Annual Planning Calendar Diagram Powerpoint Guide
This is a annual planning calendar diagram powerpoint guide. This is a six stage process. The stages in this process are strategic management model, managing profit and performance, product service, values mission vision, external environment, financial objectives.

Business Model Canvas Ppt PowerPoint Presentation Designs
This is a business model canvas ppt powerpoint presentation designs. This is a three stage process. The stages in this process are profit models, unique value proposition, market attractiveness, sales performance model, sustainability.

Business Model Canvas Template 1 Ppt PowerPoint Presentation Summary Example
This is a business model canvas template 1 ppt powerpoint presentation summary example. This is a three stage process. The stages in this process are business model, unique value proposition, profit models, graceful exit.

Cycle Of Management Accounting Tools Ppt Example Of Ppt
This is a cycle of management accounting tools ppt example of ppt. This is a four stage process. The stages in this process are balance sheet, profit and loss account, cash flow statement, fund flow statement.\n\n\n\n\n\n\n\n\n\n\n\n\n\n\n\n\n\n
