Profit Improvement
Problems Of The Financial System Example Ppt Slides
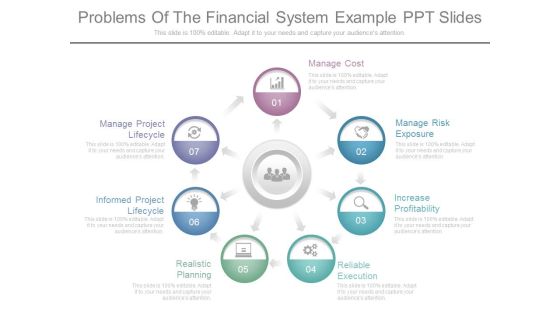
This is a problems of the financial system example ppt slides. This is a seven stage process. The stages in this process are manage cost, manage risk exposure, increase profitability, reliable execution, realistic planning, informed project lifecycle, manage project lifecycle.
Software Services Business Profile Executive Summary Ppt PowerPoint Presentation File Elements PDF
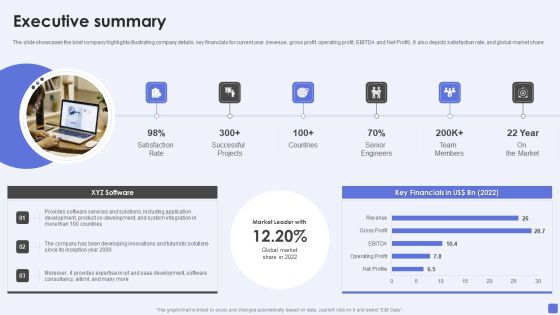
The slide showcases the brief company highlights illustrating company details, key financials for current year revenue, gross profit, operating profit, EBITDA and Net Profit. It also depicts satisfaction rate, and global market share. Deliver an awe inspiring pitch with this creative Software Services Business Profile Executive Summary Ppt PowerPoint Presentation File Elements PDF bundle. Topics like Satisfaction Rate, Successful Projects, Senior Engineers can be discussed with this completely editable template. It is available for immediate download depending on the needs and requirements of the user.

Summary Financials Revenue Ebitda Pat Ppt PowerPoint Presentation Visuals
This is a summary financials revenue ebitda pat ppt powerpoint presentation visuals. This is a three stage process. The stages in this process are revenue and gross profit, pat and pat margin, ebitda and ebitda margin.
Sales Quarterly Performance Review System Dashboard Indicating Total Sales And Revenue Download PDF
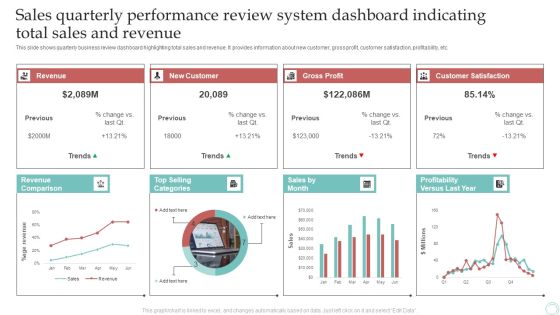
This slide shows quarterly business review dashboard highlighting total sales and revenue. It provides information about new customer, gross profit, customer satisfaction, profitability, etc. Pitch your topic with ease and precision using this Sales Quarterly Performance Review System Dashboard Indicating Total Sales And Revenue Download PDF. This layout presents information on Revenue, New Customer, Gross Profit. It is also available for immediate download and adjustment. So, changes can be made in the color, design, graphics or any other component to create a unique layout.
Market Statistical Analysis Vector Icon Ppt Powerpoint Presentation File Design Inspiration
This is a market statistical analysis vector icon ppt powerpoint presentation file design inspiration. The topics discussed in this diagram are market growth, market opportunity, market profitability. This is a completely editable PowerPoint presentation, and is available for immediate download.

Break Even Analysis Ppt PowerPoint Presentation Slides
This is a break even analysis ppt powerpoint presentation slides. This is a two stage process. The stages in this process are loss, profit, sales, total revenue, break even point, total costs.

Cash Cow Matrix For Strategic Planning Ppt Powerpoint Presentation File Picture
This is a cash cow matrix for strategic planning ppt powerpoint presentation file picture. This is a four stage process. The stages in this process are market growth, market opportunity, market profitability.

Selecting The Pricing Objective Ppt PowerPoint Presentation Gallery Portrait
This is a selecting the pricing objective ppt powerpoint presentation gallery portrait. This is a five stage process. The stages in this process are surveys, maximum current profit, maximum market share, product quality leadership, maximum market skimming.
Summary Financials Revenue Ebitda Pat Ppt PowerPoint Presentation Infographic Template Smartart
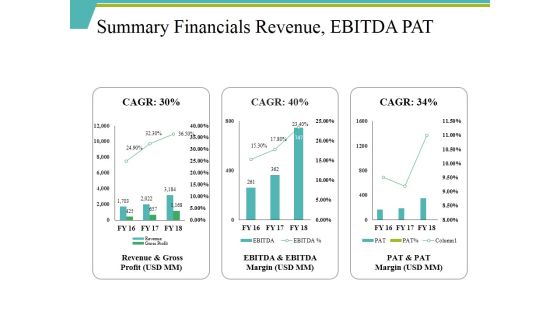
This is a summary financials revenue ebitda pat ppt powerpoint presentation infographic template smartart. This is a three stage process. The stages in this process are revenue and gross profit, ebitda and ebitda, pat and pat, revenue.

Leadership Development Process Diagram Ppt Images
This is a leadership development process diagram ppt images. This is a seven stage process. The stages in this process are individual coaching, evaluation, greater profit, team training, assess needs, build rapport, set context.

Scatter Bubble Chart Ppt PowerPoint Presentation Professional Model
This is a scatter bubble chart ppt powerpoint presentation professional model. This is a six stage process. The stages in this process are sales in profit, financial year, growth, business, marketing, strategy.
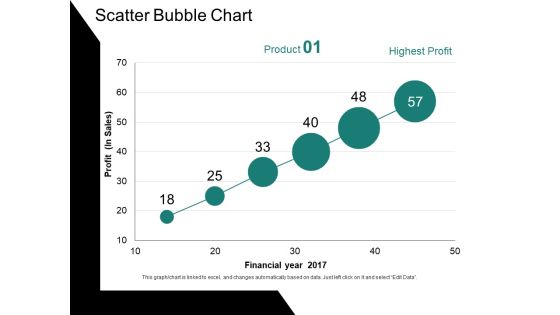
Scatter Bubble Chart Ppt PowerPoint Presentation Ideas Gallery
This is a scatter bubble chart ppt powerpoint presentation ideas gallery. This is a six stage process. The stages in this process are profit, financial year, chart, business, growth.

Scatter With Smooth Lines And Markers Ppt PowerPoint Presentation Ideas Deck
This is a scatter with smooth lines and markers ppt powerpoint presentation ideas deck. This is a one stage process. The stages in this process are profit, dollar, percentage, business, growth.
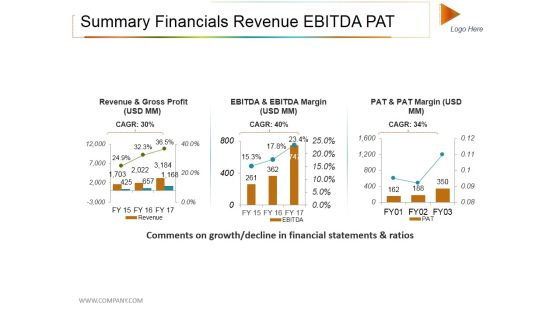
Summary Financials Revenue Ebitda Pat Ppt PowerPoint Presentation File Rules
This is a summary financials revenue ebitda pat ppt powerpoint presentation file rules. This is a three stage process. The stages in this process are revenue and gross profit, revenue, growth, success.
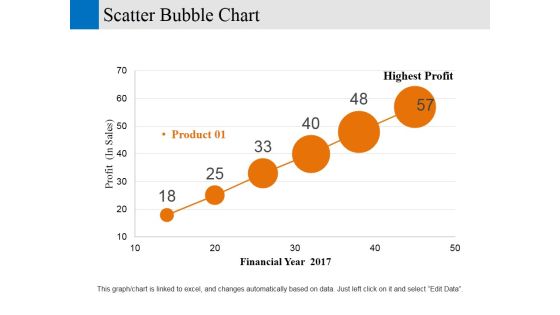
Scatter Bubble Chart Ppt PowerPoint Presentation Gallery Designs Download
This is a scatter bubble chart ppt powerpoint presentation gallery designs download. This is a six stage process. The stages in this process are financial year, profit, business, marketing, strategy.

Three Dashboard With Percentage Value Growth Powerpoint Slides
This PowerPoint template has been designed with three dashboards. Use this PPT slide to depict rise in business profit. This professional diagram slide will help you express your views to target audience.
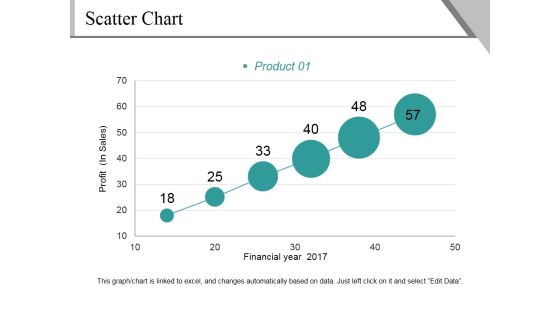
Scatter Chart Ppt PowerPoint Presentation File Background Image
This is a scatter chart ppt powerpoint presentation file background image. This is a six stage process. The stages in this process are profit, financial year, product, growth, success.

Area Chart Ppt PowerPoint Presentation Infographic Template Layout
This is a area chart ppt powerpoint presentation infographic template layout. This is a two stage process. The stages in this process are product, profit, area chart, growth, success.
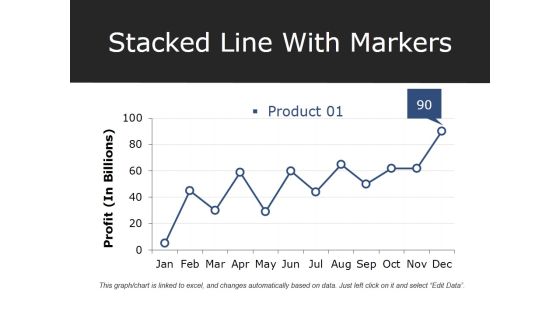
Stacked Line With Markers Ppt PowerPoint Presentation Professional Deck
This is a stacked line with markers ppt powerpoint presentation professional deck. This is a one stage process. The stages in this process are product, profit, growth, success, graph.
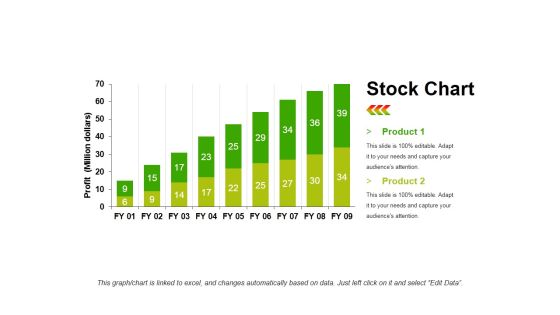
Stock Chart Template 1 Ppt PowerPoint Presentation Infographic Template Objects
This is a stock chart template 1 ppt powerpoint presentation infographic template objects. This is a two stage process. The stages in this process are product, profit, bar graph, growth, success.

Current State Analysis Financial Comparison Ppt PowerPoint Presentation Inspiration Good
This is a current state analysis financial comparison ppt powerpoint presentation inspiration good. This is a five stage process. The stages in this process are revenue, profits, cash balance, competitor.
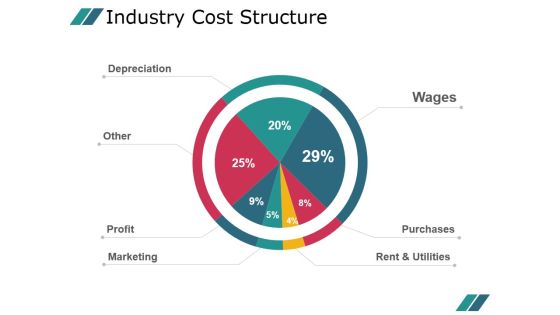
Industry Cost Structure Template 1 Ppt PowerPoint Presentation Example 2015
This is a industry cost structure template 1 ppt powerpoint presentation example 2015. This is a seven stage process. The stages in this process are wages, purchases, rent and utilities, depreciation, other, profit, marketing.

Industry Snapshot Template 2 Ppt PowerPoint Presentation Layouts Examples
This is a industry snapshot template 2 ppt powerpoint presentation layouts examples. This is a three stage process. The stages in this process are revenue, profit, annual growth, wages, annual growth, business.
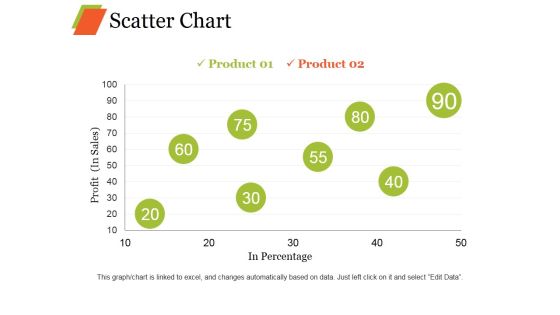
Scatter Chart Ppt PowerPoint Presentation Professional Graphic Images
This is a scatter chart ppt powerpoint presentation professional graphic images. This is a eight stage process. The stages in this process are product, profit, in percentage growth, business.

Pharmaceutical Company Financial Performance Obtaining Sustainability Growing Pharmaceutical Organization Sample PDF
This slide shows the financial performance of the pharmaceutical company from last five years 2017 to 2021. It includes net sales, sales growth, operating profit, net profit, etc. Deliver an awe inspiring pitch with this creative pharmaceutical company financial performance obtaining sustainability growing pharmaceutical organization sample pdf bundle. Topics like pharmaceutical company financial performance for last five years can be discussed with this completely editable template. It is available for immediate download depending on the needs and requirements of the user.
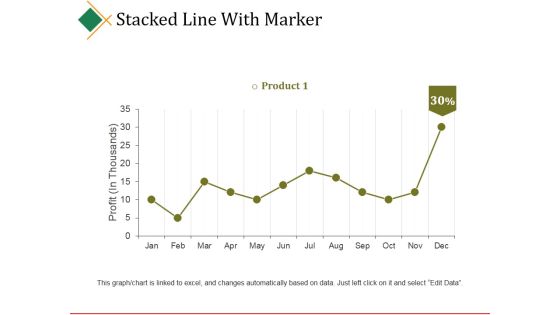
Stacked Line With Marker Ppt PowerPoint Presentation Model Graphics Download
This is a stacked line with marker ppt powerpoint presentation model graphics download. This is a twelve stage process. The stages in this process are product, profit, business, marketing, success.
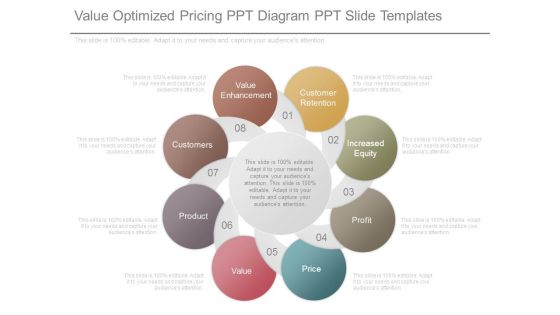
Value Optimized Pricing Ppt Diagram Ppt Slide Templates
This is a value optimized pricing ppt diagram ppt slide templates. This is a eight stage process. The stages in this process are value enhancement, customers, product, value, customer retention, increased equity, profit, price.

Customer Satisfaction Rate Diagram Presentation Outline
This is a customer satisfaction rate diagram presentation outline. This is a six stage process. The stages in this process are idea generation, customer gets value, higher profit, customer satisfaction scores, market share increases, project delivery.

Break Even Analysis Ppt PowerPoint Presentation Model File Formats
This is a break even analysis ppt powerpoint presentation model file formats. This is a two stage process. The stages in this process are cost, loss, break even point, profit, fixed costs.

Sales Effectiveness Administration Diagram Powerpoint Layout
This is a sales effectiveness administration diagram powerpoint layout. This is a four stage process. The stages in this process are reduced cost of sales, increased profitability, revenue growth, increased sales effectiveness.

Arrow Representation Of 2012 To 2015 Pointing Target PowerPoint Templates Ppt Slides Graphics
We present our Arrow representation of 2012 to 2015 pointing target PowerPoint Templates PPT Slides Graphics.Download and present our Marketing PowerPoint Templates because networking is an imperative in todays world. You need to access the views of others. Similarly you need to give access to them of your abilities. Download and present our Timelines PowerPoint Templates because Our PowerPoint Templates and Slides offer you the needful to organise your thoughts. Use them to list out your views in a logical sequence. Download our Business PowerPoint Templates because your product has established a foothold in the market. Customers are happy with the value it brings to their lives. Download and present our Arrows PowerPoint Templates because it Shines the light on your thoughts and motivates your team to improve the quality of celebration for all around you. Download our Time planning PowerPoint Templates because your brain is always churning out ideas like cogs in a wheel.Use these PowerPoint slides for presentations relating to Art, Background, Button, Call, City, Colorful, Concept, Country, Destination, Editable, Flag, Fuel, Geography, Graphic, Home, Icon, Illustration, Journey, Land, Locate, Location, Macro, Map, Mapping, Mark, Navigate, Needle, Petrol, Pin, Pinpoint, Place, Pointing, Pump, Push, Pushpin, Restaurant, Road, Roadmap, Service, Set, Shiny, Space, Symbol, Town, Travel, Trip. The prominent colors used in the PowerPoint template are Blue, Red, Gray. PowerPoint presentation experts tell us our Arrow representation of 2012 to 2015 pointing target PowerPoint Templates PPT Slides Graphics are specially created by a professional team with vast experience. They diligently strive to come up with the right vehicle for your brilliant Ideas. Customers tell us our Destination PowerPoint templates and PPT Slides are Great. Customers tell us our Arrow representation of 2012 to 2015 pointing target PowerPoint Templates PPT Slides Graphics are Classic. Customers tell us our Colorful PowerPoint templates and PPT Slides are topically designed to provide an attractive backdrop to any subject. PowerPoint presentation experts tell us our Arrow representation of 2012 to 2015 pointing target PowerPoint Templates PPT Slides Graphics are Awesome. People tell us our Country PowerPoint templates and PPT Slides are designed by a team of presentation professionals.
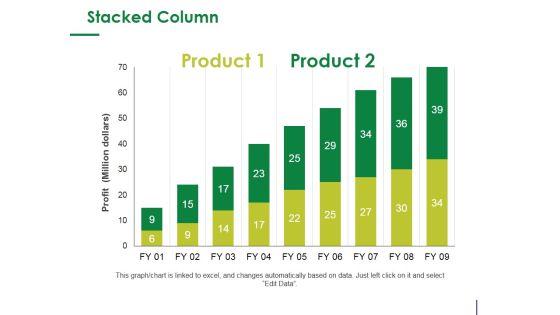
Stacked Column Ppt PowerPoint Presentation Infographic Template Design Ideas
This is a stacked column ppt powerpoint presentation infographic template design ideas. This is a two stage process. The stages in this process are product, profit, bar graph, growth, success.
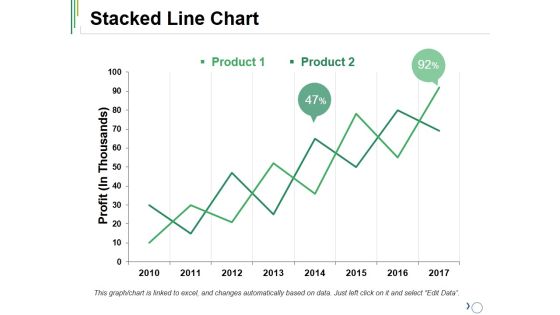
Stacked Line Chart Ppt PowerPoint Presentation Ideas Outfit
This is a stacked line chart ppt powerpoint presentation ideas outfit. This is a two stage process. The stages in this process are product, stacked line, profit, growth, success.

Building Quality Products And Services Template Presentation Design
This is a building quality products and services template presentation design. This is a eight stage process. The stages in this process are highest quality, business success, increased profitability, cost reduction, enhanced security, web enabled services, quality beyond.
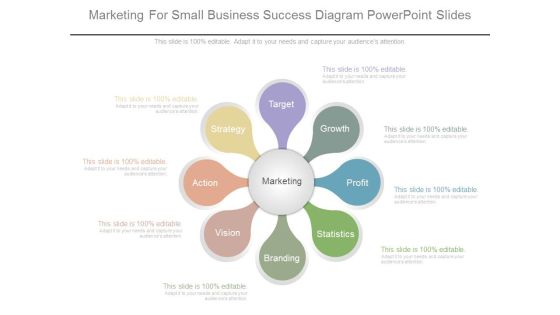
Marketing For Small Business Success Diagram Powerpoint Slides
This is a marketing for small business success diagram powerpoint slides. This is a eight stage process. The stages in this process are target, growth, profit, statistics, branding, vision, action, strategy, marketing.
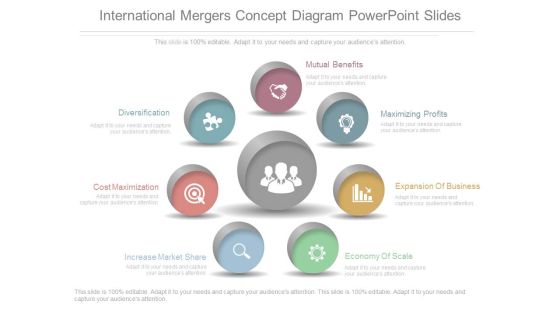
International Mergers Concept Diagram Powerpoint Slides
This is an international mergers concept diagram powerpoint slides. This is a seven stage process. The stages in this process are mutual benefits, maximizing profits, expansion of business, economy of scale, increase market share, cost maximization, diversification.
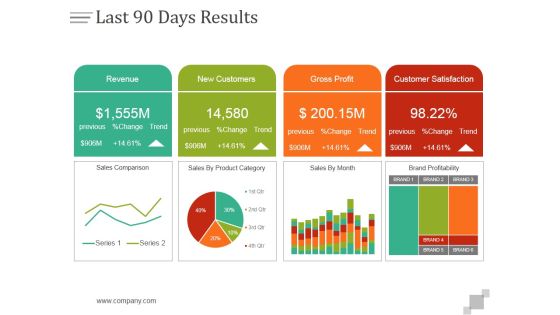
Last 90 Days Results Ppt PowerPoint Presentation Design Templates
This is a last 90 days results ppt powerpoint presentation design templates. This is a four stage process. The stages in this process are revenue, new customers, gross profit, customer satisfaction.

Competition Comparison Table Ppt PowerPoint Presentation Outline
This is a competition comparison table ppt powerpoint presentation outline. This is a seven stage process. The stages in this process are revenue, profit, market share, main activity, number of employee, product quality.

Stacked Line Chart Ppt PowerPoint Presentation Model Show
This is a stacked line chart ppt powerpoint presentation model show. This is a two stage process. The stages in this process are stacked line chart, product, profit, percentage, growth.

Example Of Optimized Investment Sample Diagram Powerpoint Graphics
This is a example of optimized investment sample diagram powerpoint graphics. This is a eight stage process. The stages in this process are customer, performance, profit, capital protection, leverage, yield enhancement, sales, brand growth.

Supplier Impact On Shareholder Value Elements PDF
This slide shows the supplier impact on shareholder valuation such as profitability, capital employed, revenue growth, cost reduction, working capital efficiency, etc.Presenting supplier impact on shareholder value elements pdf to provide visual cues and insights. Share and navigate important information on two stages that need your due attention. This template can be used to pitch topics like revenue growth, profitability, capital employed. In addtion, this PPT design contains high resolution images, graphics, etc, that are easily editable and available for immediate download.
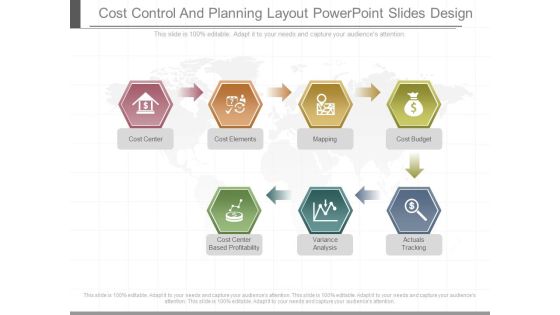
Cost Control And Planning Layout Powerpoint Slides Design
This is a cost control and planning layout powerpoint slides design. This is a seven stage process. The stages in this process are cost center, cost elements, mapping, cost budget, cost center based profitability, variance analysis, actuals tracking.

Competition Comparison Table Ppt PowerPoint Presentation Visual Aids
This is a competition comparison table ppt powerpoint presentation visual aids. This is a six stage process. The stages in this process are revenue, profit, market share, main activity, number of employee, product quality.

Clustered Bar Ppt PowerPoint Presentation Gallery Inspiration
This is a clustered bar ppt powerpoint presentation gallery inspiration. This is a four stage process. The stages in this process are clustered bar, product, profit, business, bar graph.

Ansoff Matrix To Analyse Market Risk Ppt Powerpoint Presentation Shapes
This is a ansoff matrix to analyse market risk ppt powerpoint presentation shapes. This is a four stage process. The stages in this process are market growth, market opportunity, market profitability.

Industry Overview Template 1 Ppt PowerPoint Presentation Show
This is a industry overview template 1 ppt powerpoint presentation show. This is a six stage process. The stages in this process are revenue, profit, annual growth, wages, businesses.
Industry Snapshot Template 2 Ppt Powerpoint Presentation Layouts Sample
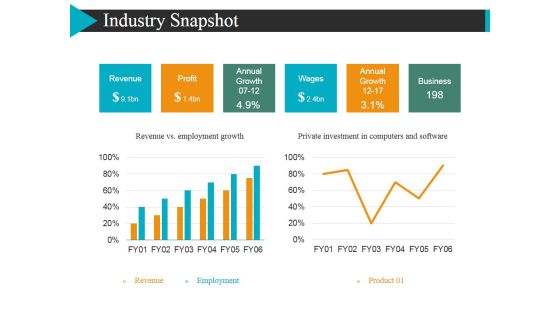
This is a industry snapshot template 2 ppt powerpoint presentation layouts sample. This is a two stage process. The stages in this process are revenue, profit, annual growth, wages.

Market Segmentation Evaluation Segment Size And Growth Potential Ppt PowerPoint Presentation Model
This is a market segmentation evaluation segment size and growth potential ppt powerpoint presentation model. This is a two stage process. The stages in this process are net profit, market sales, milk products, confectionary.
IT Services And Consulting Company Profile Financial Comparison With Competitors Guidelines PDF
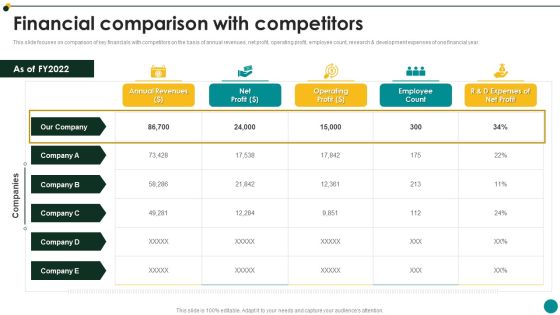
This slide focuses on comparison of key financials with competitors on the basis of annual revenues, net profit, operating profit, employee count, research and development expenses of one financial year.Deliver and pitch your topic in the best possible manner with this IT Services And Consulting Company Profile Financial Comparison With Competitors Guidelines PDF Use them to share invaluable insights on Annual Revenues, Operating Profit, Employee Count and impress your audience. This template can be altered and modified as per your expectations. So, grab it now.

Information Technology Solutions Business Profile Financial Comparison With Competitors Topics PDF
This slide focuses on comparison of key financials with competitors on the basis of annual revenues, net profit, operating profit, employee count, research development expenses of one financial year.This is a Information Technology Solutions Business Profile Financial Comparison With Competitors Topics PDF template with various stages. Focus and dispense information on one stage using this creative set, that comes with editable features. It contains large content boxes to add your information on topics like Annual Revenues, Employee Count, Expenses Profit. You can also showcase facts, figures, and other relevant content using this PPT layout. Grab it now.

Addressing Financial Projections Of Consumer Electronics Firm Infographics PDF
This slide caters details about financial projections of consumer electronics firm progress for next 5 years with operating profit, total revenue and Opex. Deliver an awe inspiring pitch with this creative addressing financial projections of consumer electronics firm infographics pdf bundle. Topics like revenue growth rate, gross profit, advertising, equipment, growth assumption can be discussed with this completely editable template. It is available for immediate download depending on the needs and requirements of the user.

Break Even Analysis Ppt PowerPoint Presentation Design Templates
This is a break even analysis ppt powerpoint presentation design templates. This is a two stage process. The stages in this process are sales, break even volume, total revenue, loss, profit.

Current State Analysis Financial Comparison Ppt Powerpoint Presentation File Graphic Tips
This is a current state analysis financial comparison ppt powerpoint presentation file graphic tips. This is a five stage process. The stages in this process are revenue, profits, cash balance.

Strategic Market Insight Implementation Guide Market Intelligence Advantages Strengthen Business Operations Pictures PDF
This slide showcases various benefits of using market intelligence for companies to analyze and asses business environment. It showcases benefits such as customer retention, sales process improvement, boost process efficiency and gains competitive environment. Explore a selection of the finest Strategic Market Insight Implementation Guide Market Intelligence Advantages Strengthen Business Operations Pictures PDF here. With a plethora of professionally designed and pre made slide templates, you can quickly and easily find the right one for your upcoming presentation. You can use our Strategic Market Insight Implementation Guide Market Intelligence Advantages Strengthen Business Operations Pictures PDF to effectively convey your message to a wider audience. Slidegeeks has done a lot of research before preparing these presentation templates. The content can be personalized and the slides are highly editable. Grab templates today from Slidegeeks.
Stacked Line With Marker Ppt PowerPoint Presentation Pictures Graphics Download
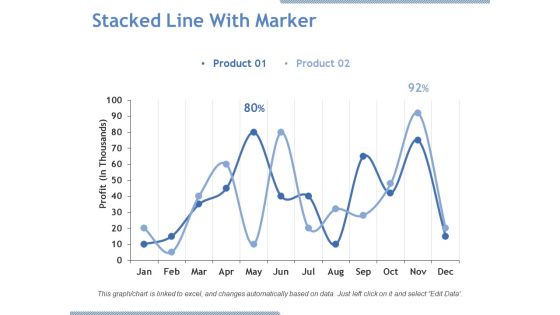
This is a stacked line with marker ppt powerpoint presentation pictures graphics download. This is a two stage process. The stages in this process are product, profit, line chart, business, growth.
Stacked Line Chart Ppt PowerPoint Presentation Portfolio Picture
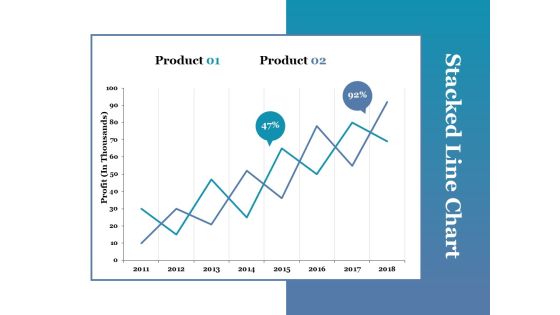
This is a stacked line chart ppt powerpoint presentation portfolio picture. This is a two stage process. The stages in this process are stacked line chart, product, profit, growth.
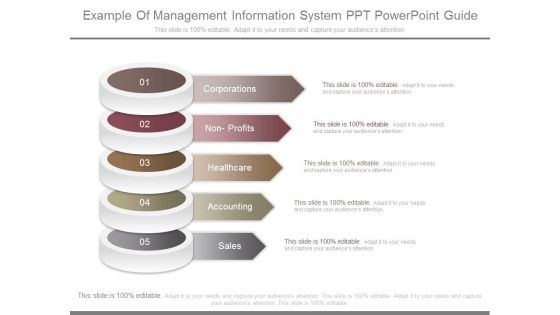
Example Of Management Information System Ppt Powerpoint Guide
This is a example of management information system ppt powerpoint guide. This is a five stage process. The stages in this process are corporations, non profits, healthcare, accounting, sales.
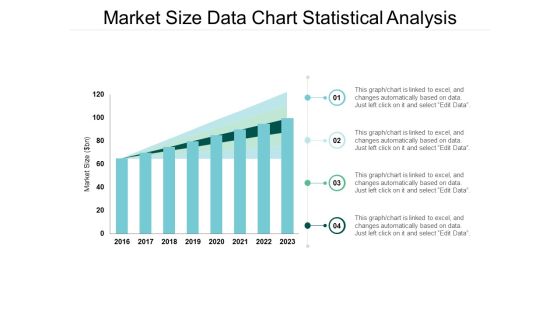
Market Size Data Chart Statistical Analysis Ppt Powerpoint Presentation Model Format
This is a market size data chart statistical analysis ppt powerpoint presentation model format. The topics discussed in this diagram are market growth, market opportunity, market profitability. This is a completely editable PowerPoint presentation, and is available for immediate download.

Break Even Analysis Curve Powerpoint Guide
This is a break even analysis curve powerpoint guide. This is a one stage process. The stages in this process are cost, break even point, loss, profit, total variable costs, fixed costs, quality sold, units.
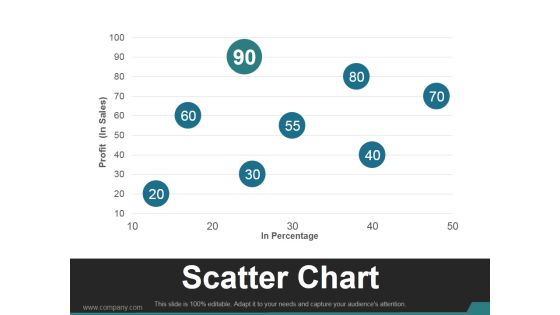
Scatter Chart Template 2 Ppt PowerPoint Presentation Slides
This is a scatter chart template 2 ppt powerpoint presentation slides. This is a eight stage process. The stages in this process are business, marketing, scatter chart, profit, management.
 Home
Home