AI PPT Maker
Templates
PPT Bundles
Design Services
Business PPTs
Business Plan
Management
Strategy
Introduction PPT
Roadmap
Self Introduction
Timelines
Process
Marketing
Agenda
Technology
Medical
Startup Business Plan
Cyber Security
Dashboards
SWOT
Proposals
Education
Pitch Deck
Digital Marketing
KPIs
Project Management
Product Management
Artificial Intelligence
Target Market
Communication
Supply Chain
Google Slides
Research Services
 One Pagers
All Categories
-
Home
- Customer Favorites
- Profit Improvement
Profit Improvement
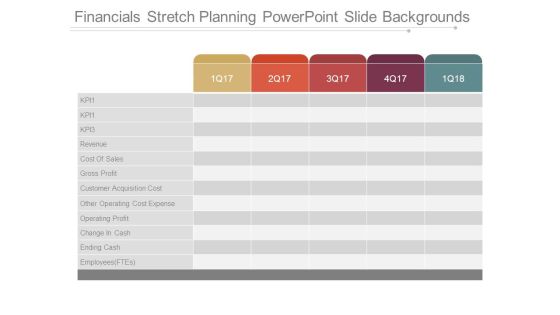
Financials Stretch Planning Powerpoint Slide Backgrounds
This is a financials stretch planning powerpoint slide backgrounds. This is a five stage process. The stages in this process are kp, revenue, cost of sales, gross profit, customer acquisition cost, other operating cost expense, operating profit, change in cash, ending cash, employees ftes.

Financials Summary Base Plan Vs Stretch Plan Powerpoint Slide Information
This is a financials summary base plan vs stretch plan powerpoint slide information. This is a three stage process. The stages in this process are base plan, stretch plan, comments, kp, revenue, cost of sales, gross profit, customer acquisition cost, other operating expense, operating profit, change in cash, ending cash, employees ftes.

Financials Base Plan Table Chart Ppt Slide Templates
This is a financials base plan table chart ppt slide templates. This is a five stage process. The stages in this process are kpi, revenue, cost of sales, gross profit, customer acquisition cost, other operating cost expense, operating profit, change in cash, ending cash, employees ftes.
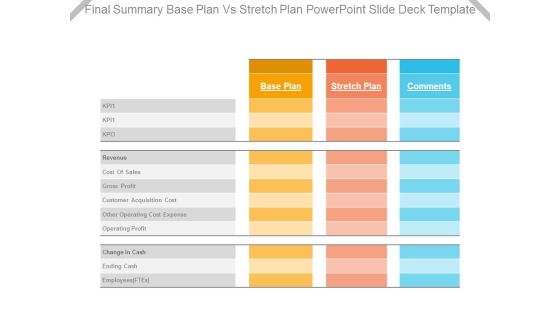
Final Summary Base Plan Vs Stretch Plan Powerpoint Slide Deck Template
This is a final summary base plan vs stretch plan powerpoint slide deck template. This is a three stage process. The stages in this process are kpi, revenue, cost of sales, gross profit, customer acquisition cost, other operating cost expense, operating profit, change in cash, ending cash, employees ftes.
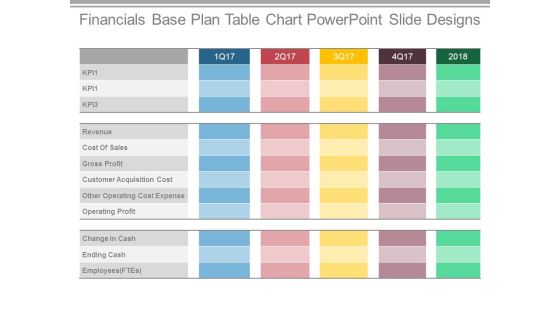
Financials Base Plan Table Chart Powerpoint Slide Designs
This is a financials base plan table chart powerpoint slide designs. This is a five stage process. The stages in this process are revenue, cost of sales, gross profit, customer acquisition cost, other operating cost expense, operating profit, change in cash, ending cash.
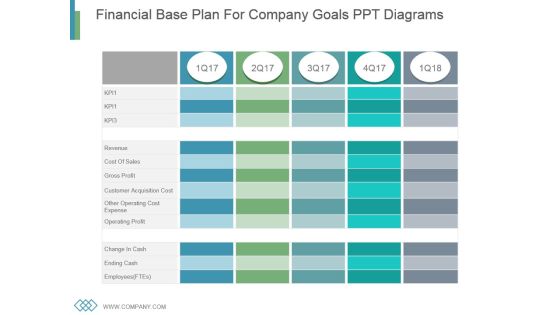
Financial Base Plan For Company Goals Ppt Diagrams
This is a financial base plan for company goals ppt diagrams. This is a five stage process. The stages in this process are revenue, cost of sales, gross profit, customer acquisition cost, other operating cost expense, operating profit, change in cash, ending cash, employees.
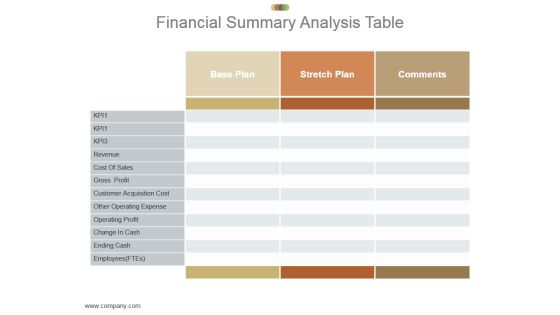
Financial Summary Analysis Table Powerpoint Slide Designs
This is a financial summary analysis table powerpoint slide designs. This is a three stage process. The stages in this process are employees, ending cash, change in cash, operating profit, other operating cost expense, customer acquisition cost, gross profit, cost of sales, revenue, base plan, stretch plan, comments.
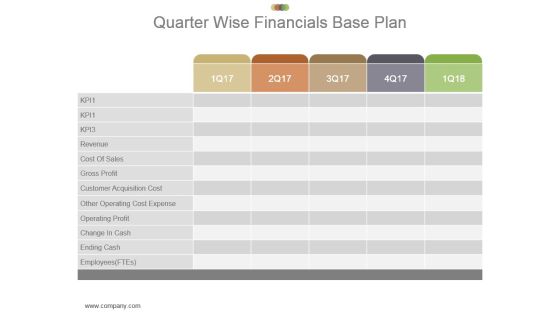
Quarter Wise Financials Base Plan Powerpoint Slide Show
This is a quarter wise financials base plan powerpoint slide show. This is a five stage process. The stages in this process are employees, ending cash, change in cash, operating profit, other operating cost expense, customer acquisition cost, gross profit, cost of sales, revenue.

Financial Statement Competitive Analysis Ppt Slides
This is a financial statement competitive analysis ppt slides. This is a three stage process. The stages in this process are employees, ending cash, change in cash, operating profit, other operating cost expense, customer acquisition cost, gross profit, cost of sales, revenue.

Financials Base Plan Table Powerpoint Slide Backgrounds
This is a financials base plan table powerpoint slide backgrounds. This is a three stage process. The stages in this process are employees, ending cash, change in cash, operating profit, other operating cost expense, customer acquisition cost, gross profit, cost of sales, revenue.

Financials Stretch Plan Data Powerpoint Slide Backgrounds
This is a financials stretch plan data powerpoint slide backgrounds. This is a three stage process. The stages in this process are employees, ending cash, change in cash, operating profit, other operating cost expense, customer acquisition cost, gross profit, cost of sales, revenue.
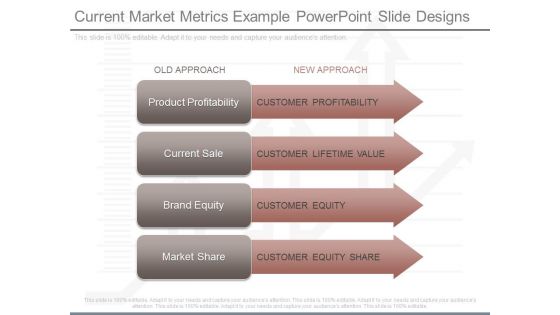
Current Market Metrics Example Powerpoint Slide Designs
This is a current market metrics example powerpoint slide designs. This is a four stage process. The stages in this process are old approach, new approach, product profitability, customer profitability, current sale, customer lifetime value, brand equity, customer equity, market share, customer equity share.

Opportunities Of International Trade Ppt Presentation
This is a opportunities of international trade ppt presentation. This is a four stage process. The stages in this process are increase of profit, increase of growth, increase of market, increase of sales.

Quarter Based Finance Review Kpi Ppt PowerPoint Presentation Background Designs
This is a quarter based finance review kpi ppt powerpoint presentation background designs. This is a five stage process. The stages in this process are cost of sales, gross profit, customer acquisition cost, other operating cost expense, operating profit, change in cash, ending cash.

Quarterly And Annual Business Review Ppt PowerPoint Presentation Graphics
This is a quarterly and annual business review ppt powerpoint presentation graphics. This is a five stage process. The stages in this process are cost of sales, gross profit, customer acquisition cost, other operating cost expense, operating profit, change in cash, ending cash.
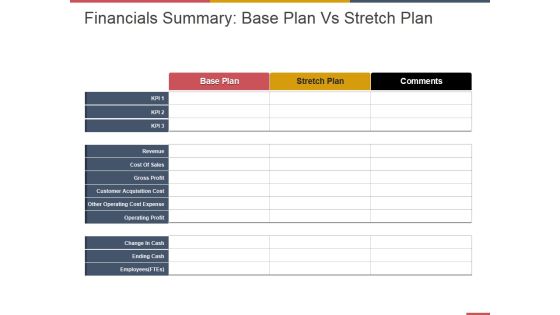
Financials Summary Base Plan Vs Stretch Plan Ppt PowerPoint Presentation Layouts Graphic Tips
This is a financials summary base plan vs stretch plan ppt powerpoint presentation layouts graphic tips. This is a three stage process. The stages in this process are cost of sales, gross profit, customer acquisition cost, other operating cost expense, operating profit.

Consumer Strategy Pyramid With Icons Ppt PowerPoint Presentation Background Designs
Presenting this set of slides with name consumer strategy pyramid with icons ppt powerpoint presentation background designs. This is a four stage process. The stages in this process are customers are most profitable, customers are least profitable. This is a completely editable PowerPoint presentation and is available for immediate download. Download now and impress your audience.

Cloud Computing Scalability Effect And Benefits To Enterprises While Using ABC Multi Portrait PDF
This slide covers the effect and benefits of using cloud management platform such as less expensive, performance improvement, empowering enterprise and many more. If you are looking for a format to display your unique thoughts, then the professionally designed Cloud Computing Scalability Effect And Benefits To Enterprises While Using ABC Multi Portrait PDF is the one for you. You can use it as a Google Slides template or a PowerPoint template. Incorporate impressive visuals, symbols, images, and other charts. Modify or reorganize the text boxes as you desire. Experiment with shade schemes and font pairings. Alter, share or cooperate with other people on your work. Download Cloud Computing Scalability Effect And Benefits To Enterprises While Using ABC Multi Portrait PDF and find out how to give a successful presentation. Present a perfect display to your team and make your presentation unforgettable.
Dollar Raise Money Investment Vector Icon Ppt Powerpoint Presentation Inspiration Outline
This is a dollar raise money investment vector icon ppt powerpoint presentation inspiration outline. This is a four stage process. The stages in this process are market growth, market opportunity, market profitability.
Market Penetration Strategy Development And Diversification Ppt Powerpoint Presentation Outline Icons
This is a market penetration strategy development and diversification ppt powerpoint presentation outline icons. This is a four stage process. The stages in this process are market growth, market opportunity, market profitability.

Stacked Line Chart Ppt PowerPoint Presentation Outline Examples
This is a stacked line chart ppt powerpoint presentation outline examples. This is a two stage process. The stages in this process are product, stacked line chart, business, marketing, profit.
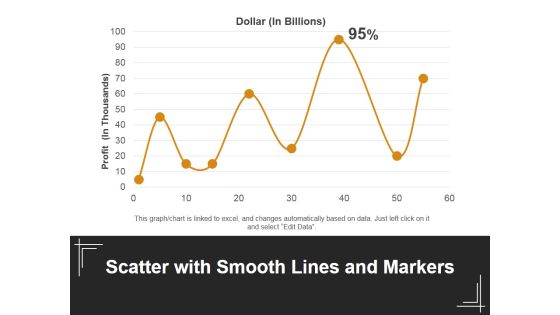
Scatter With Smooth Lines And Markers Ppt PowerPoint Presentation Outline Design Ideas
This is a scatter with smooth lines and markers ppt powerpoint presentation outline design ideas. This is a one stage process. The stages in this process are dollar, profit, line chart, business, marketing.

Competitive Sales Strategy Development Plan For Revenue Growth Metrics To Measure Sales Sample PDF
This slide focuses on metrics to measure sales team performance that covers total sales, revenue, profit, cost, incremental sales, accumulated revenue, cost breakdown, etc. Deliver and pitch your topic in the best possible manner with this Competitive Sales Strategy Development Plan For Revenue Growth Metrics To Measure Sales Sample PDF. Use them to share invaluable insights on Sales Revenue, Profit, Cost and impress your audience. This template can be altered and modified as per your expectations. So, grab it now.

Competitor Analysis Template Ppt PowerPoint Presentation Outline Format Ideas
This is a competitor analysis template ppt powerpoint presentation outline format ideas. This is a four stage process. The stages in this process are revenue, profit, market share, number of employee, product quality, main activity, revenue.
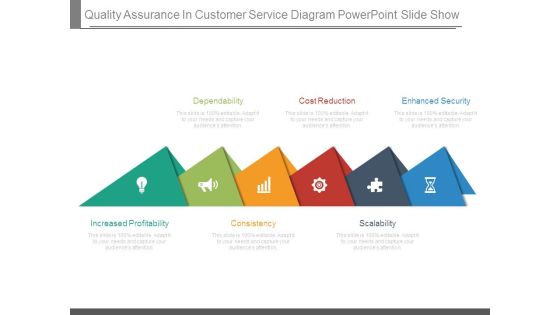
Quality Assurance In Customer Service Diagram Powerpoint Slide Show
This is a quality assurance in customer service diagram powerpoint slide show. This is a six stage process. The stages in this process are dependability, cost reduction, enhanced security, scalability, consistency, increased profitability.

Business Diversification Plan Product And Market Development Ppt Powerpoint Presentation Gallery Example Topics
This is a business diversification plan product and market development ppt powerpoint presentation gallery example topics. This is a four stage process. The stages in this process are market growth, market opportunity, market profitability.

Innovative Business Model Of Pharmaceutical Company Financial Performance For Last Five Years Icons PDF
This slide shows the financial performance of the pharmaceutical company from last five years 2022 to 2026. It includes net sales, sales growth, operating profit, net profit, etc.Deliver an awe inspiring pitch with this creative Innovative Business Model Of Pharmaceutical Company Financial Performance For Last Five Years Icons PDF bundle. Topics like Constant Exchange, Purchase Property, Growth Reported can be discussed with this completely editable template. It is available for immediate download depending on the needs and requirements of the user.

Franchising And Business Opportunities Ppt Slides Styles
This is a franchising and business opportunities ppt slides styles. This is a seven stage process. The stages in this process are granting of rights, same business format, profitable, replicable, stable or growing market, trade secrets, marketing expertise.
Scatter Chart Ppt PowerPoint Presentation Icon Example Introduction
This is a scatter chart ppt powerpoint presentation icon example introduction. This is a two stage process. The stages in this process are product, profit, in percentage, growth, scattered chart.
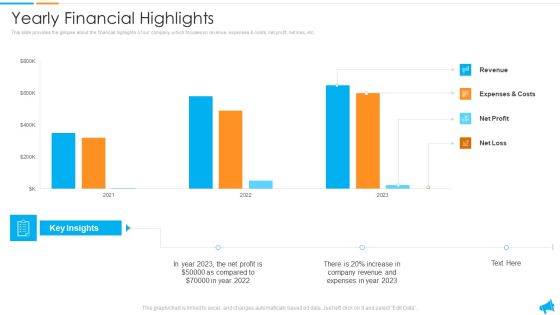
Strategy For Regional Economic Progress Outlining Yearly Financial Highlights Professional PDF
This slide provides the glimpse about the financial highlights of our company which focuses on revenue, expenses and costs, net profit, net loss, etc. Deliver an awe inspiring pitch with this creative strategy for regional economic progress outlining yearly financial highlights professional pdf bundle. Topics like revenue, expenses, net profit, costs can be discussed with this completely editable template. It is available for immediate download depending on the needs and requirements of the user.
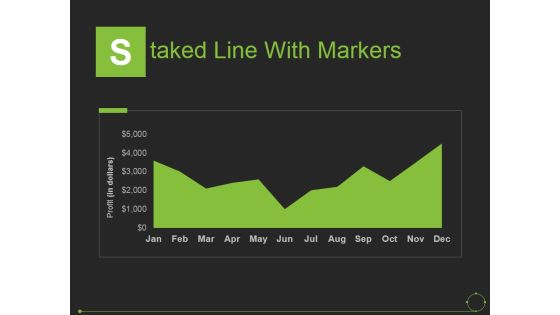
Staked Line With Markers Ppt PowerPoint Presentation Pictures Examples
This is a staked line with markers ppt powerpoint presentation pictures examples. This is a one stage process. The stages in this process are years, profit, product, business, marketing.

Bubble Chart Ppt PowerPoint Presentation Layouts Clipart Images
This is a bubble chart ppt powerpoint presentation layouts clipart images. This is a two stage process. The stages in this process are business, marketing, profit, innovation, technology, idea bulb.

Executive Summary Ppt PowerPoint Presentation Layouts Clipart
This is a executive summary ppt powerpoint presentation layouts clipart. This is a seven stage process. The stages in this process are revenue, profits, operational cost, total customers, marketing channels.

Key Financial Ratio Template 3 Ppt PowerPoint Presentation Slides Inspiration
This is a key financial ratio template 3 ppt powerpoint presentation slides inspiration. This is a four stage process. The stages in this process are liquidity, profitability, activity, solvency.

Key Financial Ratios Template 3 Ppt PowerPoint Presentation Model Deck
This is a key financial ratios template 3 ppt powerpoint presentation model deck. This is a four stage process. The stages in this process are liquidity, profitability, activity, solvency.

Industry Sales Growth Diagram Ppt Example 2017
This is a industry sales growth diagram ppt example 2017. This is a four stage process. The stages in this process are emerging phase, mature phase, growth phase, declining phase, time, profit.
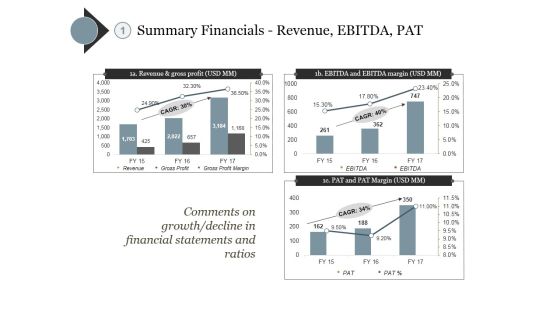
Summary Financials Revenue Ebitda Pat Ppt PowerPoint Presentation Model Clipart Images
This is a summary financials revenue ebitda pat ppt powerpoint presentation model clipart images. This is a three stage process. The stages in this process are revenue and gross profit, ebitda and ebitda margin, pat and pat margin.
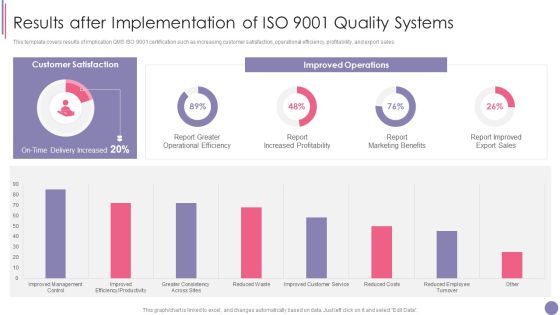
ISO 9001 Quality Assurance Software Accreditation Results After Implementation Of ISO 9001 Quality Systems Summary PDF
This template covers results of implication QMS ISO 9001 certification such as increasing customer satisfaction, operational efficiency, profitability, and export sales. Deliver and pitch your topic in the best possible manner with this ISO 9001 Quality Assurance Software Accreditation Results After Implementation Of ISO 9001 Quality Systems Summary PDF. Use them to share invaluable insights on Report Increased Profitability, Report Marketing Benefits, Quality Systems and impress your audience. This template can be altered and modified as per your expectations. So, grab it now.
Internet Marketing Objectives Ppt PowerPoint Presentation Icon Images
This is a internet marketing objectives ppt powerpoint presentation icon images. This is a six stage process. The stages in this process are sales, profit, product, repeat, sales, web.

Business Software Development Company Profile Executive Summary Introduction PDF
The slide showcases the brief company highlights illustrating company details, key financials for current year revenue, gross profit, operating profit, EBITDA and Net Profit. It also depicts satisfaction rate, and global market share. Deliver an awe inspiring pitch with this creative Business Software Development Company Profile Executive Summary Introduction PDF bundle. Topics like Key Financials US Dollar, Market Leader, Inception Year 2000 can be discussed with this completely editable template. It is available for immediate download depending on the needs and requirements of the user.
Key Financial Ratios Template 2 Ppt PowerPoint Presentation Icon Graphics Design
This is a key financial ratios template 2 ppt powerpoint presentation icon graphics design. This is a four stage process. The stages in this process are liquidity, profitability, activity, solvency, business.

Quarterly Overall Business Performance Assessment With Kpi Dashboard Microsoft PDF
The given below slide showcases the overall business performance to evaluate the trends and KPAs. It includes quarterly insights of elements such as revenue, new customers, net profit, customer satisfaction, sales profitability, growth etc. Pitch your topic with ease and precision using this Quarterly Overall Business Performance Assessment With Kpi Dashboard Microsoft PDF. This layout presents information on Revenue, Customer Satisfaction, Net Profit. It is also available for immediate download and adjustment. So, changes can be made in the color, design, graphics or any other component to create a unique layout.
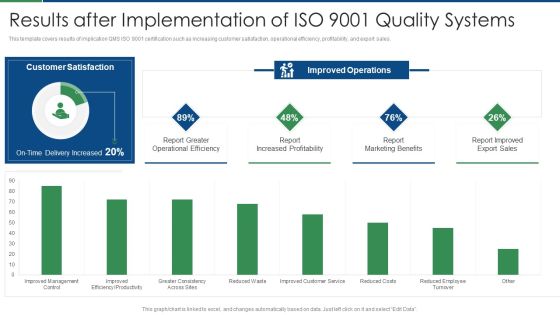
International Standard For Quality Management System Results After Implementation Of ISO 9001 Brochure PDF
This template covers results of implication QMS ISO 9001 certification such as increasing customer satisfaction, operational efficiency, profitability, and export sales. Deliver and pitch your topic in the best possible manner with this international standard for quality management system results after implementation of iso 9001 brochure pdf. Use them to share invaluable insights on operational efficiency, increased profitability, marketing benefits, sales and impress your audience. This template can be altered and modified as per your expectations. So, grab it now.

Essential Steps To Managing Growth Ppt Sample
This is a essential steps to managing growth ppt sample. This is a one stage process. The stages in this process are idea, strategy, marketing, customer service, make profits.

Tax Reduction Strategies Presentation Slides
This is a tax reduction strategies presentation slides. This is a five stage process. The stages in this process are operational efficiency, tax planning, success, realizing value, increase profitability, experience growth.
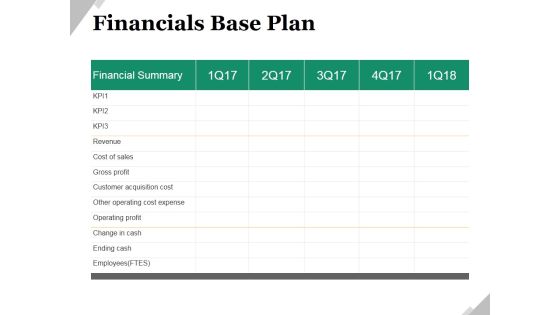
Financials Base Plan Ppt PowerPoint Presentation Model Shapes
This is a financials base plan ppt powerpoint presentation model shapes. This is a five stage process. The stages in this process are financial summary, business, marketing, revenue, cost of sales, gross profit.

Implementation Of Growth Strategy Example Ppt Images Gallery
This is a implementation of growth strategy example ppt images gallery. This is a five stage process. The stages in this process are necessity of fit , importance of integrating strategy, strategy formulation, focus on structure, control issues, loss, profit.

Break Even Analysis Ppt PowerPoint Presentation Layouts Portrait
This is a break even analysis ppt powerpoint presentation layouts portrait. This is a six stage process. The stages in this process are key comments on the table, units of output, total cost, sales revenue, profit.

Consequences Of Poor Quality Ppt PowerPoint Presentation Ideas Graphics
This is a Consequences Of Poor Quality Ppt PowerPoint Presentation Ideas Graphics. This is a six stage process. The stages in this process are lost revenue, lost customers, increased costs, lost productivity, lower profits, damaged brand.
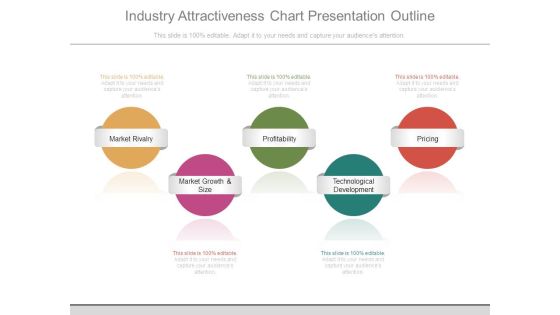
Industry Attractiveness Chart Presentation Outline
This is a industry attractiveness chart presentation outline. This is a five stage process. The stages in this process are market rivalry, market growth and size, profitability, technological development, pricing.

Predictive Analytics Benefits Ppt PowerPoint Presentation Outline File Formats
This is a predictive analytics benefits ppt powerpoint presentation outline file formats. This is a five stage process. The stages in this process are operational efficiency, increased customer service, increase profitability, new revenue opportunities.

Industry Snapshot Template 1 Ppt PowerPoint Presentation Gallery Design Ideas
This is a industry snapshot template 1 ppt powerpoint presentation gallery design ideas. This is a three stage process. The stages in this process are revenue, profit, annual growth, wages, business.

Break Even Analysis Ppt PowerPoint Presentation Styles Samples
This is a break even analysis ppt powerpoint presentation styles samples. This is a two stage process. The stages in this process are break even point, break even volume, profit, total revenue, total costs, variable cost.

Introduction Stage Ppt PowerPoint Presentation Graphics
This is a introduction stage ppt powerpoint presentation graphics. This is a five stage process. The stages in this process are low sales, negative profits, little competition, innovators are targeted, high cost per customer acquired.

Corporate Sustainability Strategies Template Ppt Example
This is a corporate sustainability strategies template ppt example. This is a four stage process. The stages in this process are high performance operations, lower costs, increase profits, gain competitive operations.

Competition Comparison Table Ppt PowerPoint Presentation Slide
This is a competition comparison table ppt powerpoint presentation slide. This is a six stage process. The stages in this process are revenue, profit, market share, main activity, number of employee, product quality.
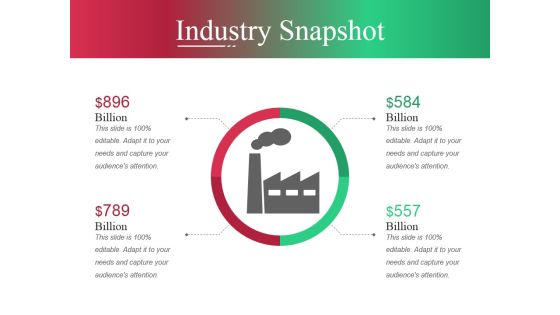
Industry Snapshot Template Ppt PowerPoint Presentation Slides Shapes
This is a industry snapshot template ppt powerpoint presentation slides shapes. This is a two stage process. The stages in this process are revenue, profit, annual growth, wages, annual growth, business.

Market Intelligence Advantages To Strengthen Business Operations Rules PDF
This slide showcases various benefits of using market intelligence for companies to analyze and asses business environment. It showcases benefits such as customer retention, sales process improvement, boost process efficiency and gains competitive environment. Find highly impressive Market Intelligence Advantages To Strengthen Business Operations Rules PDF on Slidegeeks to deliver a meaningful presentation. You can save an ample amount of time using these presentation templates. No need to worry to prepare everything from scratch because Slidegeeks experts have already done a huge research and work for you. You need to download Market Intelligence Advantages To Strengthen Business Operations Rules PDF for your upcoming presentation. All the presentation templates are 100 percent editable and you can change the color and personalize the content accordingly. Download now.
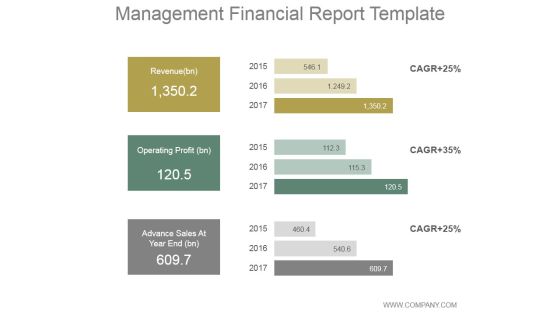
Management Financial Report Ppt PowerPoint Presentation Diagrams
This is a management financial report ppt powerpoint presentation diagrams. This is a three stage process. The stages in this process are revenue, operating profit, advance sales at year end.

Developing HR Process Flow Benefits Of Automation Technology Structure PDF
This slide shows the benefits of adopting automation technology such as maximum profitability, reduction in employee turnover rate, etc.Presenting Developing HR Process Flow Benefits Of Automation Technology Structure PDF to provide visual cues and insights. Share and navigate important information on seven stages that need your due attention. This template can be used to pitch topics like Maximizes Profitability, Increase Organizational, Recruitment Process. In addtion, this PPT design contains high resolution images, graphics, etc, that are easily editable and available for immediate download.
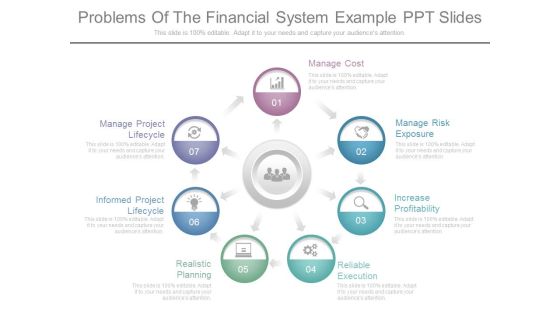
Problems Of The Financial System Example Ppt Slides
This is a problems of the financial system example ppt slides. This is a seven stage process. The stages in this process are manage cost, manage risk exposure, increase profitability, reliable execution, realistic planning, informed project lifecycle, manage project lifecycle.
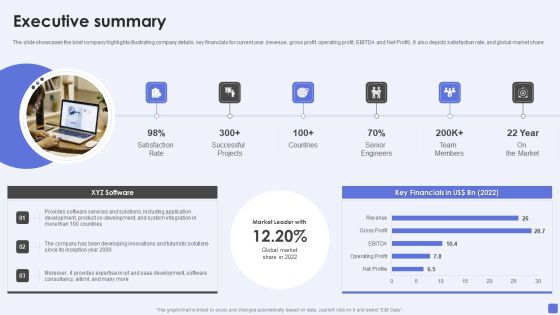
Software Services Business Profile Executive Summary Ppt PowerPoint Presentation File Elements PDF
The slide showcases the brief company highlights illustrating company details, key financials for current year revenue, gross profit, operating profit, EBITDA and Net Profit. It also depicts satisfaction rate, and global market share. Deliver an awe inspiring pitch with this creative Software Services Business Profile Executive Summary Ppt PowerPoint Presentation File Elements PDF bundle. Topics like Satisfaction Rate, Successful Projects, Senior Engineers can be discussed with this completely editable template. It is available for immediate download depending on the needs and requirements of the user.

Summary Financials Revenue Ebitda Pat Ppt PowerPoint Presentation Visuals
This is a summary financials revenue ebitda pat ppt powerpoint presentation visuals. This is a three stage process. The stages in this process are revenue and gross profit, pat and pat margin, ebitda and ebitda margin.
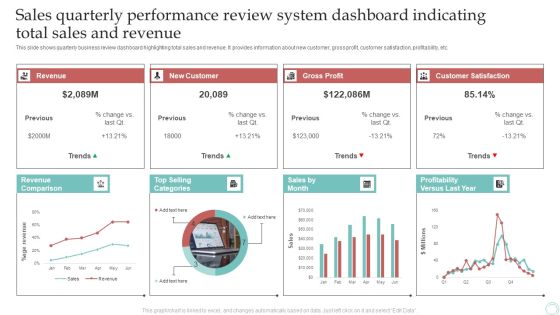
Sales Quarterly Performance Review System Dashboard Indicating Total Sales And Revenue Download PDF
This slide shows quarterly business review dashboard highlighting total sales and revenue. It provides information about new customer, gross profit, customer satisfaction, profitability, etc. Pitch your topic with ease and precision using this Sales Quarterly Performance Review System Dashboard Indicating Total Sales And Revenue Download PDF. This layout presents information on Revenue, New Customer, Gross Profit. It is also available for immediate download and adjustment. So, changes can be made in the color, design, graphics or any other component to create a unique layout.
Market Statistical Analysis Vector Icon Ppt Powerpoint Presentation File Design Inspiration
This is a market statistical analysis vector icon ppt powerpoint presentation file design inspiration. The topics discussed in this diagram are market growth, market opportunity, market profitability. This is a completely editable PowerPoint presentation, and is available for immediate download.

Break Even Analysis Ppt PowerPoint Presentation Slides
This is a break even analysis ppt powerpoint presentation slides. This is a two stage process. The stages in this process are loss, profit, sales, total revenue, break even point, total costs.

Cash Cow Matrix For Strategic Planning Ppt Powerpoint Presentation File Picture
This is a cash cow matrix for strategic planning ppt powerpoint presentation file picture. This is a four stage process. The stages in this process are market growth, market opportunity, market profitability.

Selecting The Pricing Objective Ppt PowerPoint Presentation Gallery Portrait
This is a selecting the pricing objective ppt powerpoint presentation gallery portrait. This is a five stage process. The stages in this process are surveys, maximum current profit, maximum market share, product quality leadership, maximum market skimming.
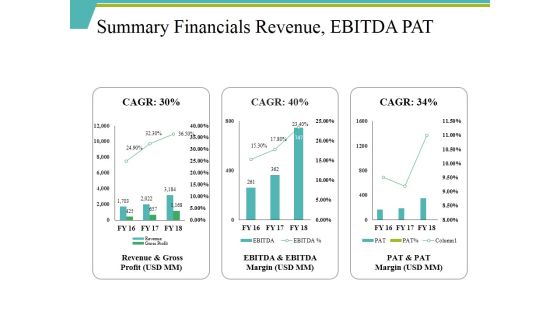
Summary Financials Revenue Ebitda Pat Ppt PowerPoint Presentation Infographic Template Smartart
This is a summary financials revenue ebitda pat ppt powerpoint presentation infographic template smartart. This is a three stage process. The stages in this process are revenue and gross profit, ebitda and ebitda, pat and pat, revenue.

Leadership Development Process Diagram Ppt Images
This is a leadership development process diagram ppt images. This is a seven stage process. The stages in this process are individual coaching, evaluation, greater profit, team training, assess needs, build rapport, set context.

Scatter Bubble Chart Ppt PowerPoint Presentation Professional Model
This is a scatter bubble chart ppt powerpoint presentation professional model. This is a six stage process. The stages in this process are sales in profit, financial year, growth, business, marketing, strategy.
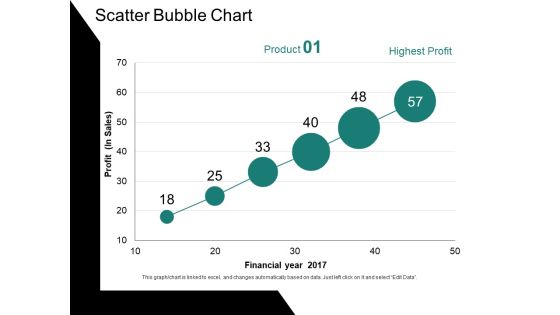
Scatter Bubble Chart Ppt PowerPoint Presentation Ideas Gallery
This is a scatter bubble chart ppt powerpoint presentation ideas gallery. This is a six stage process. The stages in this process are profit, financial year, chart, business, growth.

Scatter With Smooth Lines And Markers Ppt PowerPoint Presentation Ideas Deck
This is a scatter with smooth lines and markers ppt powerpoint presentation ideas deck. This is a one stage process. The stages in this process are profit, dollar, percentage, business, growth.
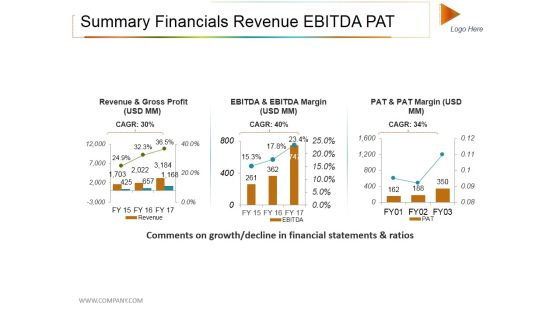
Summary Financials Revenue Ebitda Pat Ppt PowerPoint Presentation File Rules
This is a summary financials revenue ebitda pat ppt powerpoint presentation file rules. This is a three stage process. The stages in this process are revenue and gross profit, revenue, growth, success.
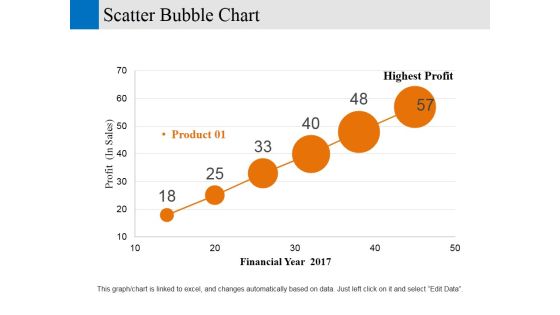
Scatter Bubble Chart Ppt PowerPoint Presentation Gallery Designs Download
This is a scatter bubble chart ppt powerpoint presentation gallery designs download. This is a six stage process. The stages in this process are financial year, profit, business, marketing, strategy.

Three Dashboard With Percentage Value Growth Powerpoint Slides
This PowerPoint template has been designed with three dashboards. Use this PPT slide to depict rise in business profit. This professional diagram slide will help you express your views to target audience.
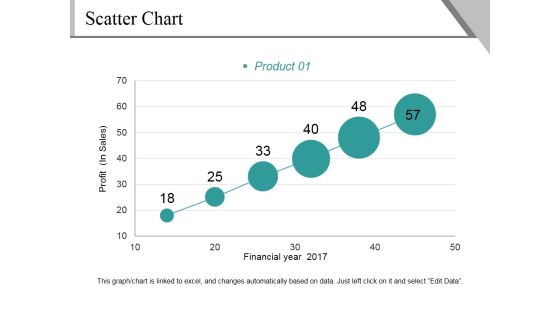
Scatter Chart Ppt PowerPoint Presentation File Background Image
This is a scatter chart ppt powerpoint presentation file background image. This is a six stage process. The stages in this process are profit, financial year, product, growth, success.

Area Chart Ppt PowerPoint Presentation Infographic Template Layout
This is a area chart ppt powerpoint presentation infographic template layout. This is a two stage process. The stages in this process are product, profit, area chart, growth, success.
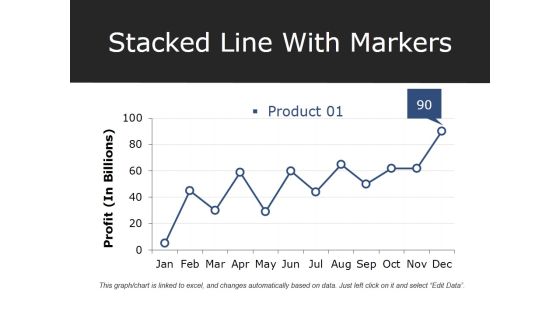
Stacked Line With Markers Ppt PowerPoint Presentation Professional Deck
This is a stacked line with markers ppt powerpoint presentation professional deck. This is a one stage process. The stages in this process are product, profit, growth, success, graph.
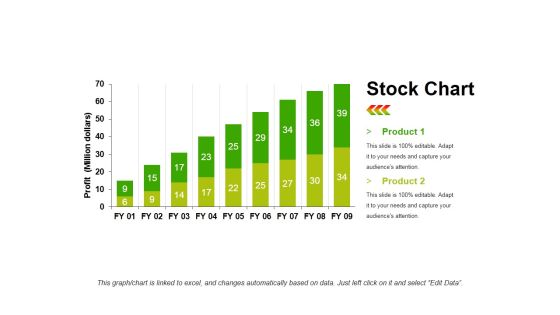
Stock Chart Template 1 Ppt PowerPoint Presentation Infographic Template Objects
This is a stock chart template 1 ppt powerpoint presentation infographic template objects. This is a two stage process. The stages in this process are product, profit, bar graph, growth, success.

Current State Analysis Financial Comparison Ppt PowerPoint Presentation Inspiration Good
This is a current state analysis financial comparison ppt powerpoint presentation inspiration good. This is a five stage process. The stages in this process are revenue, profits, cash balance, competitor.
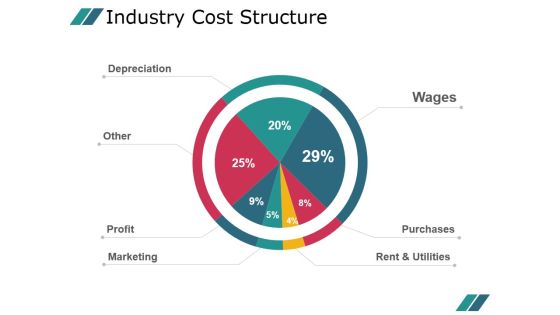
Industry Cost Structure Template 1 Ppt PowerPoint Presentation Example 2015
This is a industry cost structure template 1 ppt powerpoint presentation example 2015. This is a seven stage process. The stages in this process are wages, purchases, rent and utilities, depreciation, other, profit, marketing.

Industry Snapshot Template 2 Ppt PowerPoint Presentation Layouts Examples
This is a industry snapshot template 2 ppt powerpoint presentation layouts examples. This is a three stage process. The stages in this process are revenue, profit, annual growth, wages, annual growth, business.
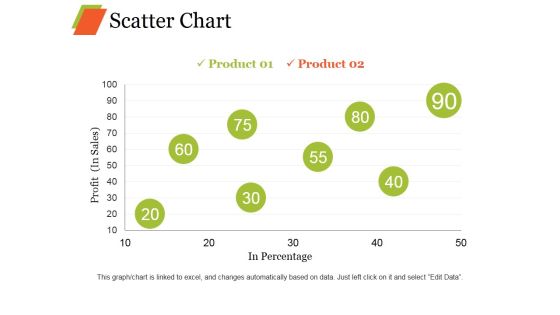
Scatter Chart Ppt PowerPoint Presentation Professional Graphic Images
This is a scatter chart ppt powerpoint presentation professional graphic images. This is a eight stage process. The stages in this process are product, profit, in percentage growth, business.

Pharmaceutical Company Financial Performance Obtaining Sustainability Growing Pharmaceutical Organization Sample PDF
This slide shows the financial performance of the pharmaceutical company from last five years 2017 to 2021. It includes net sales, sales growth, operating profit, net profit, etc. Deliver an awe inspiring pitch with this creative pharmaceutical company financial performance obtaining sustainability growing pharmaceutical organization sample pdf bundle. Topics like pharmaceutical company financial performance for last five years can be discussed with this completely editable template. It is available for immediate download depending on the needs and requirements of the user.
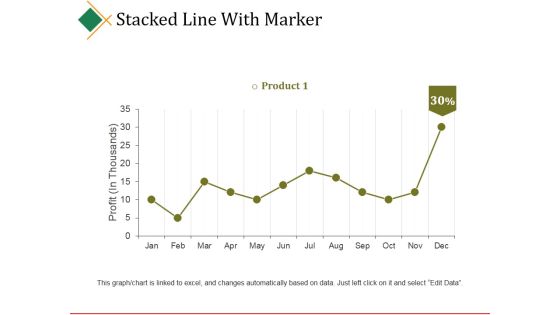
Stacked Line With Marker Ppt PowerPoint Presentation Model Graphics Download
This is a stacked line with marker ppt powerpoint presentation model graphics download. This is a twelve stage process. The stages in this process are product, profit, business, marketing, success.
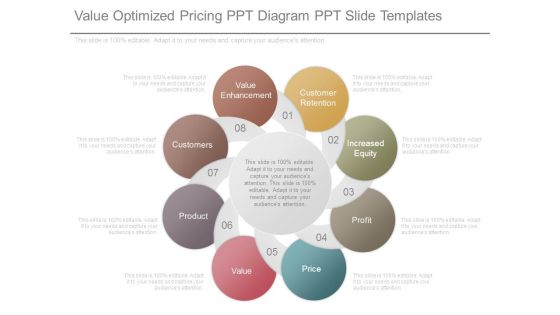
Value Optimized Pricing Ppt Diagram Ppt Slide Templates
This is a value optimized pricing ppt diagram ppt slide templates. This is a eight stage process. The stages in this process are value enhancement, customers, product, value, customer retention, increased equity, profit, price.

Customer Satisfaction Rate Diagram Presentation Outline
This is a customer satisfaction rate diagram presentation outline. This is a six stage process. The stages in this process are idea generation, customer gets value, higher profit, customer satisfaction scores, market share increases, project delivery.

Break Even Analysis Ppt PowerPoint Presentation Model File Formats
This is a break even analysis ppt powerpoint presentation model file formats. This is a two stage process. The stages in this process are cost, loss, break even point, profit, fixed costs.

Sales Effectiveness Administration Diagram Powerpoint Layout
This is a sales effectiveness administration diagram powerpoint layout. This is a four stage process. The stages in this process are reduced cost of sales, increased profitability, revenue growth, increased sales effectiveness.

Arrow Representation Of 2012 To 2015 Pointing Target PowerPoint Templates Ppt Slides Graphics
We present our Arrow representation of 2012 to 2015 pointing target PowerPoint Templates PPT Slides Graphics.Download and present our Marketing PowerPoint Templates because networking is an imperative in todays world. You need to access the views of others. Similarly you need to give access to them of your abilities. Download and present our Timelines PowerPoint Templates because Our PowerPoint Templates and Slides offer you the needful to organise your thoughts. Use them to list out your views in a logical sequence. Download our Business PowerPoint Templates because your product has established a foothold in the market. Customers are happy with the value it brings to their lives. Download and present our Arrows PowerPoint Templates because it Shines the light on your thoughts and motivates your team to improve the quality of celebration for all around you. Download our Time planning PowerPoint Templates because your brain is always churning out ideas like cogs in a wheel.Use these PowerPoint slides for presentations relating to Art, Background, Button, Call, City, Colorful, Concept, Country, Destination, Editable, Flag, Fuel, Geography, Graphic, Home, Icon, Illustration, Journey, Land, Locate, Location, Macro, Map, Mapping, Mark, Navigate, Needle, Petrol, Pin, Pinpoint, Place, Pointing, Pump, Push, Pushpin, Restaurant, Road, Roadmap, Service, Set, Shiny, Space, Symbol, Town, Travel, Trip. The prominent colors used in the PowerPoint template are Blue, Red, Gray. PowerPoint presentation experts tell us our Arrow representation of 2012 to 2015 pointing target PowerPoint Templates PPT Slides Graphics are specially created by a professional team with vast experience. They diligently strive to come up with the right vehicle for your brilliant Ideas. Customers tell us our Destination PowerPoint templates and PPT Slides are Great. Customers tell us our Arrow representation of 2012 to 2015 pointing target PowerPoint Templates PPT Slides Graphics are Classic. Customers tell us our Colorful PowerPoint templates and PPT Slides are topically designed to provide an attractive backdrop to any subject. PowerPoint presentation experts tell us our Arrow representation of 2012 to 2015 pointing target PowerPoint Templates PPT Slides Graphics are Awesome. People tell us our Country PowerPoint templates and PPT Slides are designed by a team of presentation professionals.
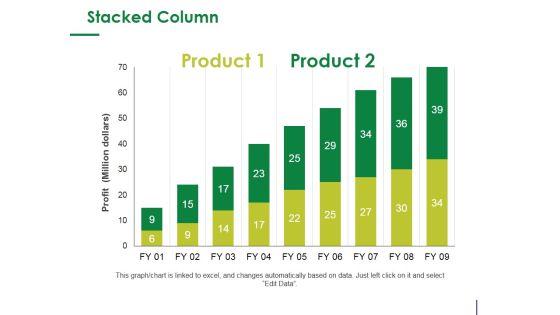
Stacked Column Ppt PowerPoint Presentation Infographic Template Design Ideas
This is a stacked column ppt powerpoint presentation infographic template design ideas. This is a two stage process. The stages in this process are product, profit, bar graph, growth, success.
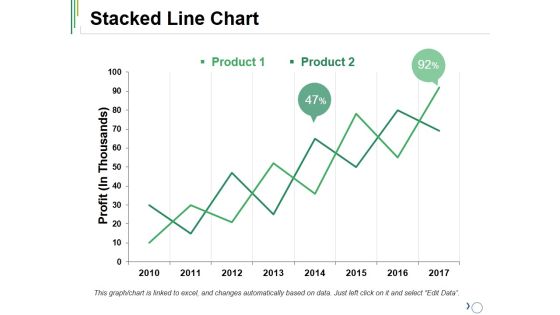
Stacked Line Chart Ppt PowerPoint Presentation Ideas Outfit
This is a stacked line chart ppt powerpoint presentation ideas outfit. This is a two stage process. The stages in this process are product, stacked line, profit, growth, success.

Building Quality Products And Services Template Presentation Design
This is a building quality products and services template presentation design. This is a eight stage process. The stages in this process are highest quality, business success, increased profitability, cost reduction, enhanced security, web enabled services, quality beyond.
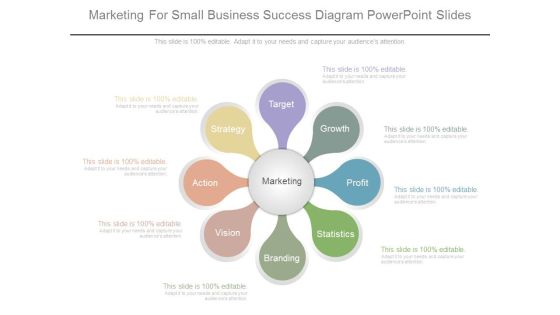
Marketing For Small Business Success Diagram Powerpoint Slides
This is a marketing for small business success diagram powerpoint slides. This is a eight stage process. The stages in this process are target, growth, profit, statistics, branding, vision, action, strategy, marketing.
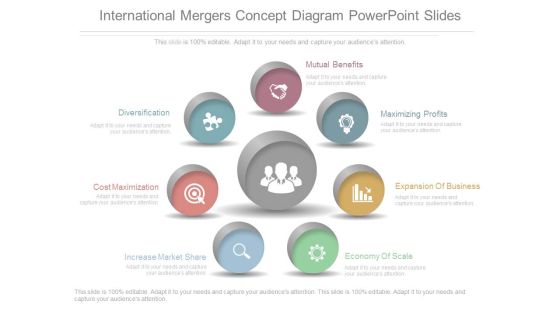
International Mergers Concept Diagram Powerpoint Slides
This is an international mergers concept diagram powerpoint slides. This is a seven stage process. The stages in this process are mutual benefits, maximizing profits, expansion of business, economy of scale, increase market share, cost maximization, diversification.
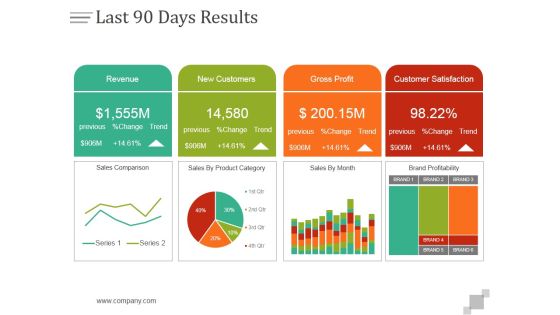
Last 90 Days Results Ppt PowerPoint Presentation Design Templates
This is a last 90 days results ppt powerpoint presentation design templates. This is a four stage process. The stages in this process are revenue, new customers, gross profit, customer satisfaction.

Competition Comparison Table Ppt PowerPoint Presentation Outline
This is a competition comparison table ppt powerpoint presentation outline. This is a seven stage process. The stages in this process are revenue, profit, market share, main activity, number of employee, product quality.

Stacked Line Chart Ppt PowerPoint Presentation Model Show
This is a stacked line chart ppt powerpoint presentation model show. This is a two stage process. The stages in this process are stacked line chart, product, profit, percentage, growth.

Example Of Optimized Investment Sample Diagram Powerpoint Graphics
This is a example of optimized investment sample diagram powerpoint graphics. This is a eight stage process. The stages in this process are customer, performance, profit, capital protection, leverage, yield enhancement, sales, brand growth.

Supplier Impact On Shareholder Value Elements PDF
This slide shows the supplier impact on shareholder valuation such as profitability, capital employed, revenue growth, cost reduction, working capital efficiency, etc.Presenting supplier impact on shareholder value elements pdf to provide visual cues and insights. Share and navigate important information on two stages that need your due attention. This template can be used to pitch topics like revenue growth, profitability, capital employed. In addtion, this PPT design contains high resolution images, graphics, etc, that are easily editable and available for immediate download.
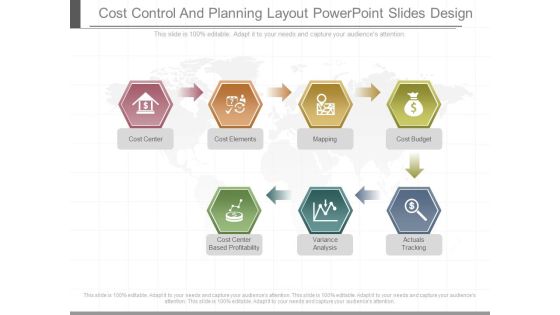
Cost Control And Planning Layout Powerpoint Slides Design
This is a cost control and planning layout powerpoint slides design. This is a seven stage process. The stages in this process are cost center, cost elements, mapping, cost budget, cost center based profitability, variance analysis, actuals tracking.

Competition Comparison Table Ppt PowerPoint Presentation Visual Aids
This is a competition comparison table ppt powerpoint presentation visual aids. This is a six stage process. The stages in this process are revenue, profit, market share, main activity, number of employee, product quality.

Clustered Bar Ppt PowerPoint Presentation Gallery Inspiration
This is a clustered bar ppt powerpoint presentation gallery inspiration. This is a four stage process. The stages in this process are clustered bar, product, profit, business, bar graph.

Ansoff Matrix To Analyse Market Risk Ppt Powerpoint Presentation Shapes
This is a ansoff matrix to analyse market risk ppt powerpoint presentation shapes. This is a four stage process. The stages in this process are market growth, market opportunity, market profitability.

Industry Overview Template 1 Ppt PowerPoint Presentation Show
This is a industry overview template 1 ppt powerpoint presentation show. This is a six stage process. The stages in this process are revenue, profit, annual growth, wages, businesses.
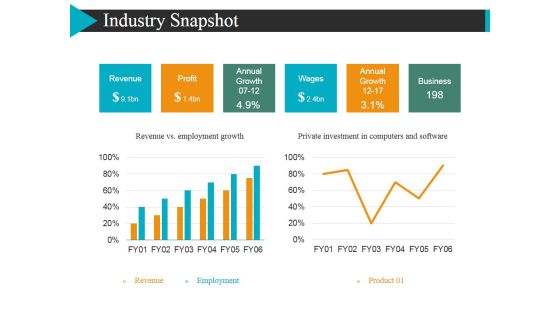
Industry Snapshot Template 2 Ppt Powerpoint Presentation Layouts Sample
This is a industry snapshot template 2 ppt powerpoint presentation layouts sample. This is a two stage process. The stages in this process are revenue, profit, annual growth, wages.

Market Segmentation Evaluation Segment Size And Growth Potential Ppt PowerPoint Presentation Model
This is a market segmentation evaluation segment size and growth potential ppt powerpoint presentation model. This is a two stage process. The stages in this process are net profit, market sales, milk products, confectionary.
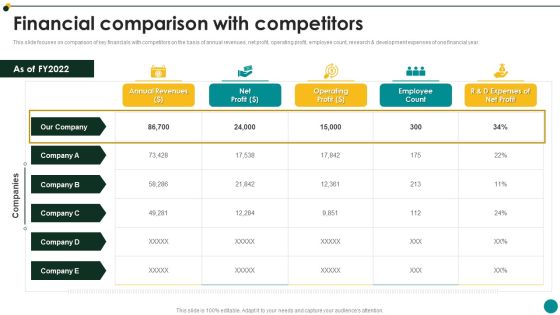
IT Services And Consulting Company Profile Financial Comparison With Competitors Guidelines PDF
This slide focuses on comparison of key financials with competitors on the basis of annual revenues, net profit, operating profit, employee count, research and development expenses of one financial year.Deliver and pitch your topic in the best possible manner with this IT Services And Consulting Company Profile Financial Comparison With Competitors Guidelines PDF Use them to share invaluable insights on Annual Revenues, Operating Profit, Employee Count and impress your audience. This template can be altered and modified as per your expectations. So, grab it now.

Information Technology Solutions Business Profile Financial Comparison With Competitors Topics PDF
This slide focuses on comparison of key financials with competitors on the basis of annual revenues, net profit, operating profit, employee count, research development expenses of one financial year.This is a Information Technology Solutions Business Profile Financial Comparison With Competitors Topics PDF template with various stages. Focus and dispense information on one stage using this creative set, that comes with editable features. It contains large content boxes to add your information on topics like Annual Revenues, Employee Count, Expenses Profit. You can also showcase facts, figures, and other relevant content using this PPT layout. Grab it now.

Addressing Financial Projections Of Consumer Electronics Firm Infographics PDF
This slide caters details about financial projections of consumer electronics firm progress for next 5 years with operating profit, total revenue and Opex. Deliver an awe inspiring pitch with this creative addressing financial projections of consumer electronics firm infographics pdf bundle. Topics like revenue growth rate, gross profit, advertising, equipment, growth assumption can be discussed with this completely editable template. It is available for immediate download depending on the needs and requirements of the user.

Break Even Analysis Ppt PowerPoint Presentation Design Templates
This is a break even analysis ppt powerpoint presentation design templates. This is a two stage process. The stages in this process are sales, break even volume, total revenue, loss, profit.

Current State Analysis Financial Comparison Ppt Powerpoint Presentation File Graphic Tips
This is a current state analysis financial comparison ppt powerpoint presentation file graphic tips. This is a five stage process. The stages in this process are revenue, profits, cash balance.

Strategic Market Insight Implementation Guide Market Intelligence Advantages Strengthen Business Operations Pictures PDF
This slide showcases various benefits of using market intelligence for companies to analyze and asses business environment. It showcases benefits such as customer retention, sales process improvement, boost process efficiency and gains competitive environment. Explore a selection of the finest Strategic Market Insight Implementation Guide Market Intelligence Advantages Strengthen Business Operations Pictures PDF here. With a plethora of professionally designed and pre made slide templates, you can quickly and easily find the right one for your upcoming presentation. You can use our Strategic Market Insight Implementation Guide Market Intelligence Advantages Strengthen Business Operations Pictures PDF to effectively convey your message to a wider audience. Slidegeeks has done a lot of research before preparing these presentation templates. The content can be personalized and the slides are highly editable. Grab templates today from Slidegeeks.
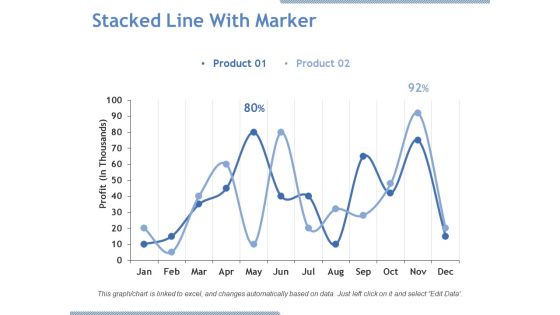
Stacked Line With Marker Ppt PowerPoint Presentation Pictures Graphics Download
This is a stacked line with marker ppt powerpoint presentation pictures graphics download. This is a two stage process. The stages in this process are product, profit, line chart, business, growth.
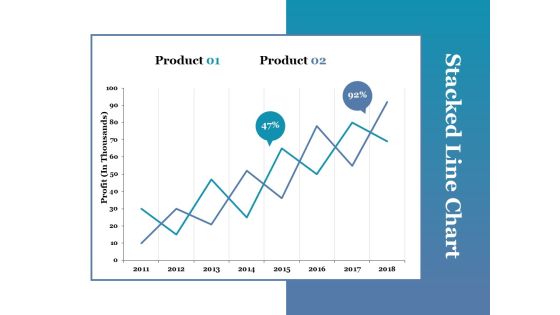
Stacked Line Chart Ppt PowerPoint Presentation Portfolio Picture
This is a stacked line chart ppt powerpoint presentation portfolio picture. This is a two stage process. The stages in this process are stacked line chart, product, profit, growth.
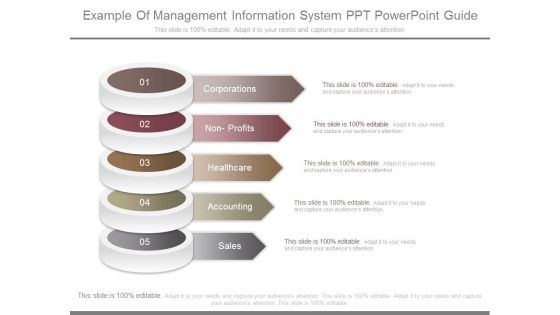
Example Of Management Information System Ppt Powerpoint Guide
This is a example of management information system ppt powerpoint guide. This is a five stage process. The stages in this process are corporations, non profits, healthcare, accounting, sales.
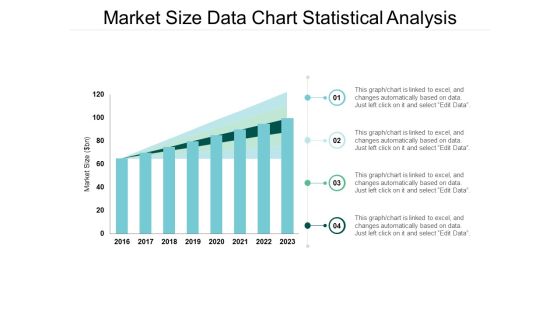
Market Size Data Chart Statistical Analysis Ppt Powerpoint Presentation Model Format
This is a market size data chart statistical analysis ppt powerpoint presentation model format. The topics discussed in this diagram are market growth, market opportunity, market profitability. This is a completely editable PowerPoint presentation, and is available for immediate download.

Break Even Analysis Curve Powerpoint Guide
This is a break even analysis curve powerpoint guide. This is a one stage process. The stages in this process are cost, break even point, loss, profit, total variable costs, fixed costs, quality sold, units.
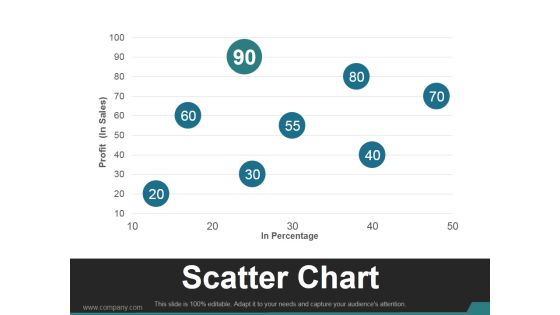
Scatter Chart Template 2 Ppt PowerPoint Presentation Slides
This is a scatter chart template 2 ppt powerpoint presentation slides. This is a eight stage process. The stages in this process are business, marketing, scatter chart, profit, management.
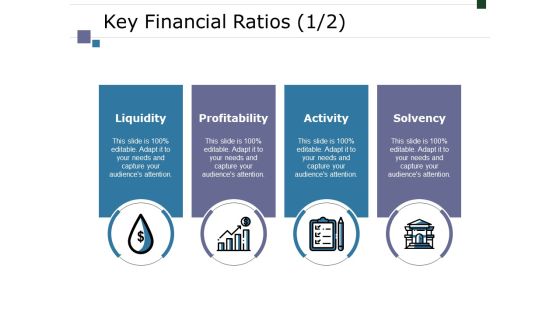
Key Financial Ratios Template 2 Ppt PowerPoint Presentation Ideas Mockup
This is a key financial ratios template 2 ppt powerpoint presentation ideas mockup. This is a four stage process. The stages in this process are liquidity, profitability, activity, solvency, business.
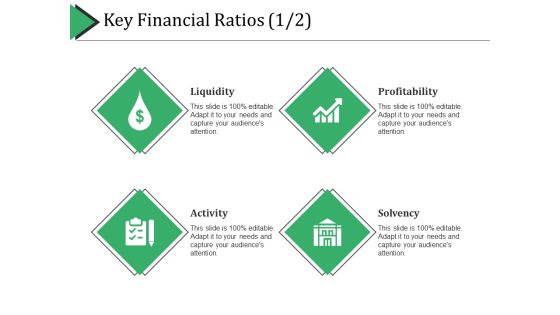
Key Financial Ratios Template 2 Ppt PowerPoint Presentation Summary Graphics Tutorials
This is a key financial ratios template 2 ppt powerpoint presentation summary graphics tutorials. This is a four stage process. The stages in this process are liquidity, profitability, activity, solvency.

Line Chart Ppt PowerPoint Presentation Gallery Format Ideas
This is a line chart ppt powerpoint presentation gallery format ideas. This is a two stage process. The stages in this process are line chart, product, in year, profit.
KPI Dashboard To Track Services Company Strategy Business Marketing Performance Guidelines PDF
Following slide demonstrates dashboard for monitoring services company sales strategy impact on maximizing business profits. It includes elements such as number of sales, revenue, profit, cost, monthly sales revenue, cost breakdown, up and cross sell, revenue collected and sales by communication channel. Showcasing this set of slides titled KPI Dashboard To Track Services Company Strategy Business Marketing Performance Guidelines PDF. The topics addressed in these templates are Revenue, Profit, Cost. All the content presented in this PPT design is completely editable. Download it and make adjustments in color, background, font etc. as per your unique business setting.
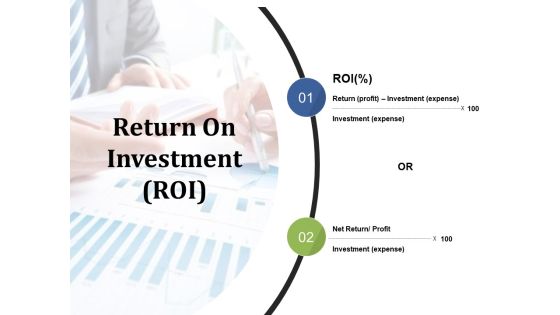
Return On Investment Ppt PowerPoint Presentation Show Gallery
This is a return on investment ppt powerpoint presentation show gallery. This is a two stage process. The stages in this process are return, investment, net return, profit, expense.
Measuring Brand Awareness Powerpoint Slides Show
This is a measuring brand awareness powerpoint slides show. This is a ten stage process. The stages in this process are credibility, innovation, price negotiation, loyalty, high profits, brand equity, regulatory under standing.

Business Management Information Systems Diagram Powerpoint Slide Ideas
This is a business management information systems diagram powerpoint slide ideas. This is a seven stage process. The stages in this process are corporations, non profit, healthcare, technology entrepreneurship, consulting with affirm or as a freelancer, government, education.

Competitor Analysis Template Ppt PowerPoint Presentation Model
This is a competitor analysis template ppt powerpoint presentation model. This is a five stage process. The stages in this process are revenue, profit, market share, main activity, number of employee, product quality.

Strategic Investment Options Diagram Powerpoint Slide Design Templates
This is a strategic investment options diagram powerpoint slide design templates. This is a eight stage process. The stages in this process are value and risk modeling, asset aware investments, values, performance, investment lifecycle management, profit, growth, result.
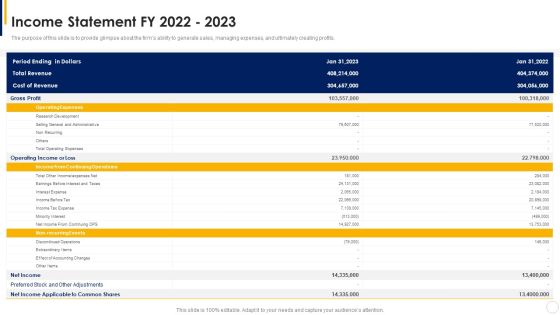
Manual To Develop Strawman Proposal Income Statement Fy 2022 To 2023 Slides PDF
The purpose of this slide is to provide glimpse about the firms ability to generate sales, managing expenses, and ultimately creating profits. Deliver an awe inspiring pitch with this creative Manual To Develop Strawman Proposal Income Statement Fy 2022 To 2023 Slides PDF bundle. Topics like Operating Income, Gross Profit, Cost Of Revenue can be discussed with this completely editable template. It is available for immediate download depending on the needs and requirements of the user.

Financial Analysis And Management Powerpoint Slides
This is a financial analysis and management powerpoint slides. This is a eight stage process. The stages in this process are cash flow, monitoring, actionable reports, investment decision, analysis, financial, analysis and management, planning, key drivers, drive profitability.
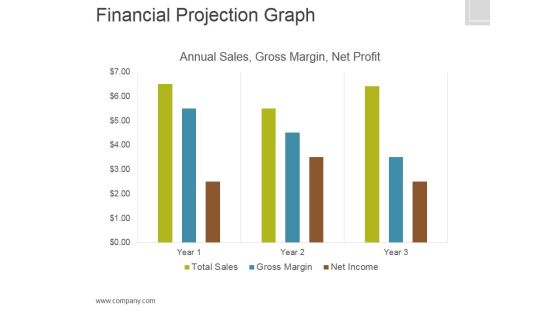
Financial Projection Graph Template 2 Ppt PowerPoint Presentation Graphics
This is a financial projection graph template 2 ppt powerpoint presentation graphics. This is a three stage process. The stages in this process are annual sales, gross margin, net profit, finance.

Competitor Analysis At Broad Level Ppt PowerPoint Presentation Summary Infographic Template
This is a competitor analysis at broad level ppt powerpoint presentation summary infographic template. This is a six stage process. The stages in this process are product quality, main activity, market share, profit, criteria.

Ppt Circular Flow Of 5 Steps Involved Development PowerPoint Templates
PPT circular flow of 5 steps involved development PowerPoint Templates-Use this Circular flow diagram to describe key strategic issues and information flows and internal communication.-PPT circular flow of 5 steps involved development PowerPoint Templates-Affiliate, Affiliation, Arrow, Business, Chart, Circular, Commerce, Concept, Contribution, Cycle, Development, Diagram, Idea, Informative, Internet, Join, Making, Manage, Management, Market, Marketing, Member, Money, Network, Partner, Partnership, Pay, Paying, Performance, Plans, Process, Productive, Productivity, Profit, Profitable, Project, Recruit, Recruiting, Recruitment, Refer, Referral, Referring, Revenue, Sales, Socialize, Steps, Strategy

Financial Summary Ppt PowerPoint Presentation Outline Information
This is a financial summary ppt powerpoint presentation outline information. This is a two stage process. The stages in this process are summary financials, revenue split, revenue and gross profit.

Cost And Income Optimization Impact On Companys Revenues Rules PDF
This slide covers the impact of choosing the right price optimization strategy for our company which increases companys sales and profits. Deliver an awe inspiring pitch with this creative cost and income optimization impact on companys revenues rules pdf bundle. Topics like volume, profit, revenue, 2021 to 2022 can be discussed with this completely editable template. It is available for immediate download depending on the needs and requirements of the user.
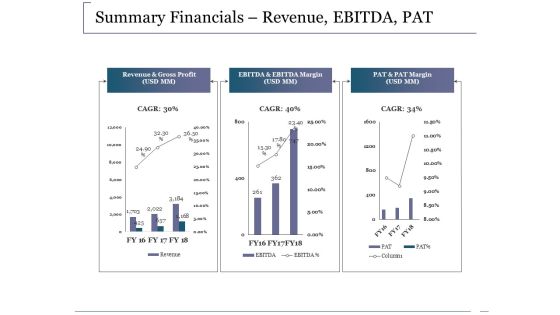
Summary Financials Revenue Ebitda Pat Ppt PowerPoint Presentation Outline Infographics
This is a summary financials revenue ebitda pat ppt powerpoint presentation outline infographics. This is a three stage process. The stages in this process are revenue and gross profit, ebitda and ebitda margin, pat and pat margin, business, marketing.
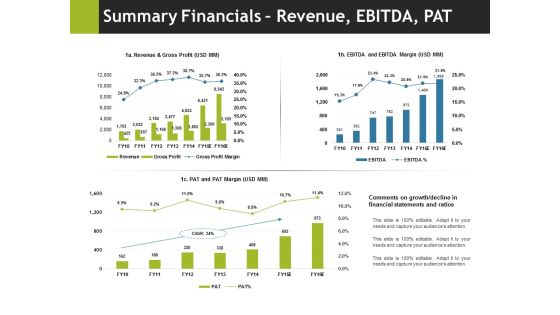
Summary Financials Revenue Ebitda Pat Ppt PowerPoint Presentation Pictures Outline
This is a summary financials revenue ebitda pat ppt powerpoint presentation pictures outline. This is a three stage process. The stages in this process are business, marketing, pat and pat margin, ebitda and ebitda margin, revenue and gross profit.
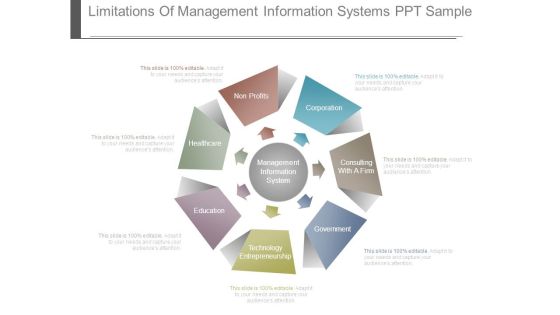
Limitations Of Management Information Systems Ppt Sample
This is a limitations of management information systems ppt sample. This is a seven stage process. The stages in this process are management information system, corporation, consulting with a firm, government, technology entrepreneurship, education, healthcare, non profits.

Competitor Analysis Ppt PowerPoint Presentation Outline Rules
This is a competitor analysis ppt powerpoint presentation outline rules. This is a seven stage process. The stages in this process are revenue, profit, market share, main activity, number of employee.

Executive Summary Ppt PowerPoint Presentation Outline Diagrams
This is a executive summary ppt powerpoint presentation outline diagrams. This is a two stage process. The stages in this process are revenue, profits, operational cost, total customers, marketing channels.

Business Management Information Systems Diagram Presentation Deck
This is a business management information systems diagram presentation deck. This is a seven stage process. The stages in this process are corporations, consulting with a firm or as a freelancer, government, education, technology entrepreneurship, healthcare, non profits.
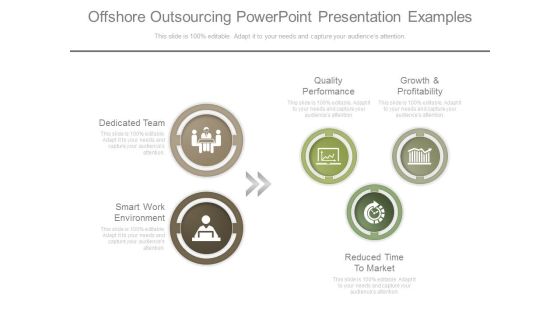
Offshore Outsourcing Powerpoint Presentation Examples
This is a offshore outsourcing powerpoint presentation examples. This is a five stage process. The stages in this process are dedicated team, smart work environment, quality performance, growth and profitability, reduced time to market.

Lowers Service Costs Ppt Presentation Examples
This is a lowers service costs ppt presentation examples. This is a six stage process. The stages in this process are increases productivity, scrap costs, lowers warranty costs, lowers manufacturing costs, lowers service costs, costs increases profit.
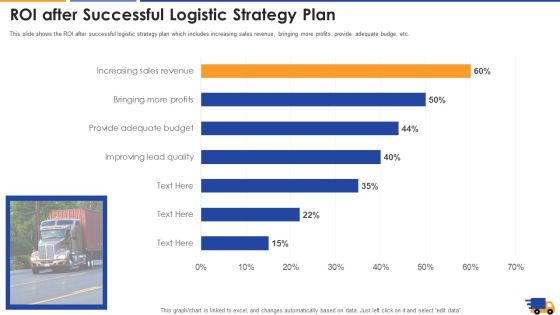
ROI After Successful Logistic Strategy Plan Brochure PDF
This slide shows the ROI after successful logistic strategy plan which includes increasing sales revenue, bringing more profits, provide adequate budge, etc. Deliver an awe inspiring pitch with this creative roi after successful logistic strategy plan brochure pdf bundle. Topics like quality, strategy plan, profit, budget can be discussed with this completely editable template. It is available for immediate download depending on the needs and requirements of the user.

Bubble Chart Ppt PowerPoint Presentation Outline Deck
This is a bubble chart ppt powerpoint presentation outline deck. This is a two stage process. The stages in this process are in percentage, profit, bubble chart, business, marketing.

Sales Performance Dashboard Template Ppt PowerPoint Presentation Professional Elements
This is a sales performance dashboard template ppt powerpoint presentation professional elements. This is a eight stage process. The stages in this process are sales comparison, sales by product category, sales by month, brand profitability, revenue.
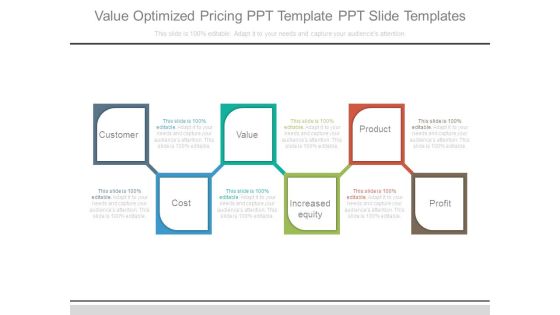
Value Optimized Pricing Ppt Template Ppt Slide Templates
This is a value optimized pricing ppt template ppt slide templates. This is a six stage process. The stages in this process are customer, cost, value, increased equity, product, profit.

Industry Overview Template 1 Ppt PowerPoint Presentation Deck
This is a industry overview template 1 ppt powerpoint presentation deck. This is a six stage process. The stages in this process are revenue, profit, annual growth, wages, annual growth, businesses.

Comparison Based On Criteria Ppt PowerPoint Presentation Outline Pictures
This is a comparison based on criteria ppt powerpoint presentation outline pictures. This is a six stage process. The stages in this process are revenue, profit, market share, main activity, number of employee.

Sales Performance Dashboard Ppt PowerPoint Presentation Outline File Formats
This is a sales performance dashboard ppt powerpoint presentation outline file formats. This is a three stage process. The stages in this process are revenue, new customers, gross profit, customer satisfaction, rankings.

Comparison Based On Criteria Ppt PowerPoint Presentation Show Outline
This is a comparison based on criteria ppt powerpoint presentation show outline. This is a six stage process. The stages in this process are revenue, profit, market share, main activity, number of employees.

Quarterly Budget Analysis Ppt PowerPoint Presentation Outline Background Image
This is a quarterly budget analysis ppt powerpoint presentation outline background image. This is a two stage process. The stages in this process are budget, this quarter, sales revenue, cost of sales, gross profits.

Stacked Line Chart Ppt PowerPoint Presentation Pictures Elements
This is a stacked line chart ppt powerpoint presentation pictures elements. This is a two stage process. The stages in this process are product, profit, stacked line chart, year, business.

Planning Logistic Technique Superior Supply Chain Execution Roi After Successful Logistic Strategy Plan Themes PDF
This slide shows the ROI after successful logistic strategy plan which includes increasing sales revenue, bringing more profits, provide adequate budge, etc. Deliver an awe-inspiring pitch with this creative planning logistic technique superior supply chain execution roi after successful logistic strategy plan themes pdf bundle. Topics like sales revenue, profits, provide adequate budge can be discussed with this completely editable template. It is available for immediate download depending on the needs and requirements of the user.

Key Financial Ratios Template 2 Ppt PowerPoint Presentation Outline Examples
This is a key financial ratios template 2 ppt powerpoint presentation outline examples. This is a four stage process. The stages in this process are liquidity, profitability, activity, solvency.

Bar Graph Finance Success PowerPoint Templates And PowerPoint Themes 0512
Microsoft Powerpoint Templates and Background with business graph with arrow showing profits-These templates can be used for presentations relating to-Business Graph, finance, money, success, shapes, arrows-Bar Graph Finance Success PowerPoint Templates And PowerPoint Themes 0512

Consequences Of Poor Quality Ppt PowerPoint Presentation Show Grid
This is a consequences of poor quality ppt powerpoint presentation show grid. This is a six stage process. The stages in this process are lost revenue, lost customers, increased costs, lost productivity, lower profits.

Consequences Of Poor Quality Ppt PowerPoint Presentation Portfolio Graphics Tutorials
This is a consequences of poor quality ppt powerpoint presentation portfolio graphics tutorials. This is a six stage process. The stages in this process are lost revenue, lost customers, increased costs, lower profits, lost productivity.

Consequences Of Poor Quality Ppt PowerPoint Presentation Gallery Layout Ideas
This is a consequences of poor quality ppt powerpoint presentation gallery layout ideas. This is a six stage process. The stages in this process are lost revenue, lost productivity, lower profits, lost customers, increased costs.

Consequences Of Poor Quality Ppt PowerPoint Presentation File Graphics
This is a consequences of poor quality ppt powerpoint presentation file graphics. This is a six stage process. The stages in this process are lost revenue, lost customers, increased costs, damaged brand, lower profits.
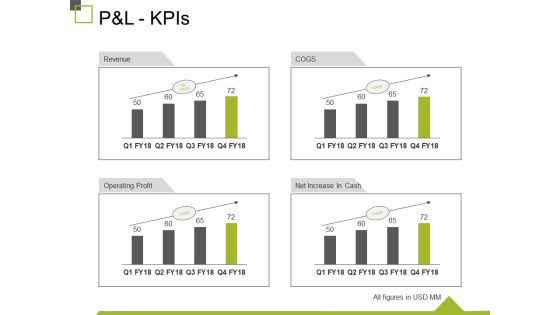
P And L Kpis Ppt PowerPoint Presentation Show Design Inspiration
This is a p and l kpis ppt powerpoint presentation show design inspiration. This is a four stage process. The stages in this process are revenue, operating profit, cogs, net increase in cash, business.

Consequences Of Poor Quality Ppt PowerPoint Presentation Styles Guidelines
This is a consequences of poor quality ppt powerpoint presentation styles guidelines. This is a six stage process. The stages in this process are lost revenue, lost customers, increased cost, damaged brand, lower profits.

Generate Immediate Sales Powerpoint Slide Presentation Sample
This is a generate immediate sales powerpoint slide presentation sample. This is a five stage process. The stages in this process are generate immediate sales, double your referrals, create value and make, increase your profitability, systematize your business.

Promoting Selling Franchise Development Companys Five Year Financial Forecast Sample PDF
This slide shows the companys five-year financial forecast which includes summary of operations, net revenue, total operating profit, earning per share, etc. Deliver an awe inspiring pitch with this creative promoting selling franchise development companys five year financial forecast sample pdf bundle. Topics like net revenue, operating profit, capital spending can be discussed with this completely editable template. It is available for immediate download depending on the needs and requirements of the user.

Calculating Customer Lifetime Value Ppt PowerPoint Presentation Introduction
This is a calculating customer lifetime value ppt powerpoint presentation introduction. This is a five stage process. The stages in this process are average acquisition cost, average customer revenue, likely customer profit.

Calculating Customer Lifetime Value Ppt PowerPoint Presentation Templates
This is a calculating customer lifetime value ppt powerpoint presentation templates. This is a five stage process. The stages in this process are average acquisition cost, average customer revenue, average customer costs, average customer profit, customer retention rate.

Customer Value Assessment Ppt Sample Presentations
This is a customer value assessment ppt sample presentations. This is a seven stage process. The stages in this process are customer profile, customer needs, customer trigger, proposition pull, processes, future builder, profit.

Addressing Financial Projections Of Consumer Electronics Firm Structure PDF
This slide caters details about financial projections of consumer electronics firm progress for next 5 years with operating profit, total revenue and Opex. Deliver an awe inspiring pitch with this creative addressing financial projections of consumer electronics firm structure pdf bundle. Topics like gross sale or total revenue, gross profit, growth assumption can be discussed with this completely editable template. It is available for immediate download depending on the needs and requirements of the user.
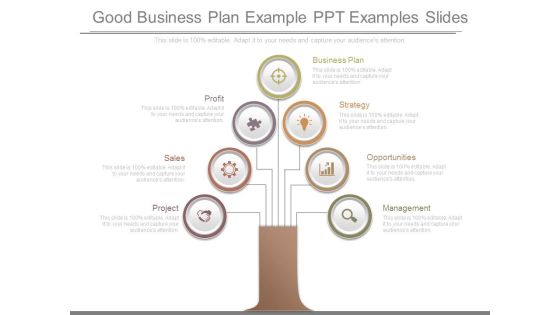
Good Business Plan Example Ppt Examples Slides
This is a good business plan example ppt examples slides. This is a seven stage process. The stages in this process are profit, sales, project, management, opportunities, strategy, business plan.

Smart Venture Digitial Transformation Expected Benefits Of IT OT Convergence Topics PDF
This slide covers expected benefits of IT or OT convergence such as profitability, digital continuity, security control, business development, attractiveness etc. This is a four template with various stages. Focus and dispense information on four stages using this creative set, that comes with editable features. It contains large content boxes to add your information on topics like Profitability, Digital Continuity, Security Control, Business Development. You can also showcase facts, figures, and other relevant content using this PPT layout. Grab it now.

Sales Activity Management Presentation Slides
This is a sales activity management presentation slides. This is a six stage process. The stages in this process are opportunity management, forecast sale analysis, email management, annual sales planning, sales activity management, marketing profiting.

Reputation Management Strategy Diagram Presentation Backgrounds
This is a reputation management strategy diagram presentation backgrounds. This is a twelve stage process. The stages in this process are create massage, market, execution of strategy, customer, service, reputation, design, sales, loyalty, profit, growth, brand positioning.

Equity Analysis Template Ppt Background Template
This is a equity analysis template ppt background template. This is a four stage process. The stages in this process are growth and profitability, investment management, marketing share, weaknesses.

Offshore Outsourcing Model Example Powerpoint Slide Design Templates
This is a offshore outsourcing model example powerpoint slide design templates. This is a four stage process. The stages in this process are quality performance, delivery models, consulting, growth and profitability.

Competitor Analysis Template Ppt PowerPoint Presentation Example File
This is a competitor analysis template ppt powerpoint presentation example file. This is a five stage process. The stages in this process are revenue, profit, market share, main activity, number of employee, product quality.

Banking Performance Management Diagram Good Ppt Example
This is a banking performance management diagram good ppt example. This is a four stage process. The stages in this process are management information system, profitability, performance management, commercial net income forecast.
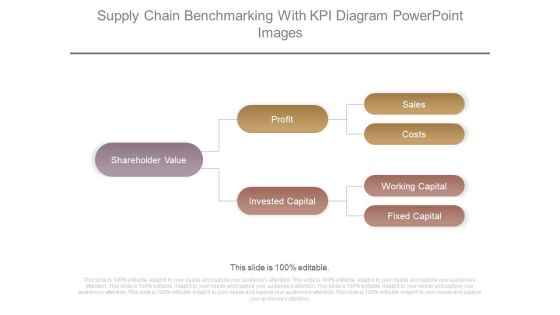
Supply Chain Benchmarking With Kpi Diagram Powerpoint Images
This is a supply chain benchmarking with kpi diagram powerpoint images. This is a three stage process. The stages in this process are shareholder value, profit, invested capital, sales, costs, working capital, fixed capital.

Competitor Analysis Template Ppt PowerPoint Presentation Ideas
This is a competitor analysis template ppt powerpoint presentation ideas. This is a five stage process. The stages in this process are revenue, profit, market share, number of employee, product quality, main activity, revenue.

Competition Comparison Table Ppt PowerPoint Presentation Backgrounds
This is a competition comparison table ppt powerpoint presentation backgrounds. This is a seven stage process. The stages in this process are revenue, profit, market share , main activity, number of employee, product quality , insert your text.
