AI PPT Maker
Templates
PPT Bundles
Design Services
Business PPTs
Business Plan
Management
Strategy
Introduction PPT
Roadmap
Self Introduction
Timelines
Process
Marketing
Agenda
Technology
Medical
Startup Business Plan
Cyber Security
Dashboards
SWOT
Proposals
Education
Pitch Deck
Digital Marketing
KPIs
Project Management
Product Management
Artificial Intelligence
Target Market
Communication
Supply Chain
Google Slides
Research Services
 One Pagers
All Categories
-
Home
- Customer Favorites
- Profit Improvement
Profit Improvement

Bar Graph For Marketing Research Process Powerpoint Slides
This PowerPoint template has been designed with diagram of bar graph. This PPT slide can be used to prepare presentations for profit growth report and also for financial data analysis. You can download finance PowerPoint template to prepare awesome presentations.

Successful Brand Development Plan Year Over Year Growth Comparison Clipart PDF
Following slide displays yearly growth comparison informational statistics. It includes details about revenues, operating profit and net profit. Deliver and pitch your topic in the best possible manner with this successful brand development plan year over year growth comparison clipart pdf. Use them to share invaluable insights on year over year growth comparison and impress your audience. This template can be altered and modified as per your expectations. So, grab it now.
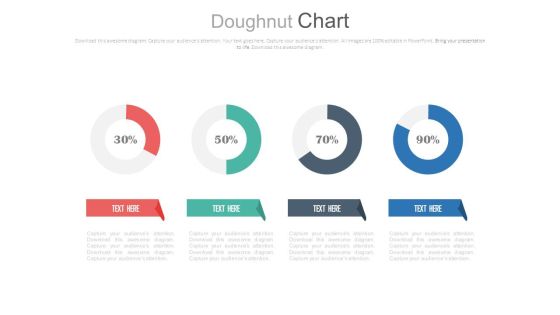
Four Circle Chart With Percentage Ratios Powerpoint Slides
This PowerPoint template has been designed with graphics of four circles and percentage ratios. You may use this dashboard slide design for topics like profit growth and financial planning. This PPT slide is powerful tool to describe your ideas.

Linear Circles Percentage Analysis Charts Powerpoint Slides
This PowerPoint template has been designed with graphics of three circles and percentage ratios. You may use this dashboard slide design for topics like profit growth and financial planning. This PPT slide is powerful tool to describe your ideas.
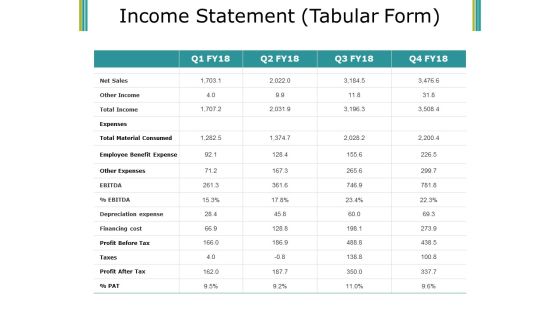
Income Statement Ppt PowerPoint Presentation Layouts Show
This is a income statement ppt powerpoint presentation layouts show. This is a four stage process. The stages in this process are net sales, expenses, total income, texas, profit after tax.
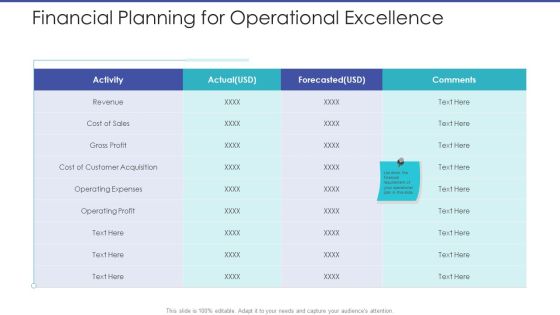
Tactical Planning For Marketing And Commercial Advancement Financial Planning For Operational Excellence Mockup PDF
Deliver and pitch your topic in the best possible manner with this tactical planning for marketing and commercial advancement financial planning for operational excellence mockup pdf. Use them to share invaluable insights on revenue, cost of sales, gross profit, cost of customer acquisition, operating expenses, operating profit and impress your audience. This template can be altered and modified as per your expectations. So, grab it now.
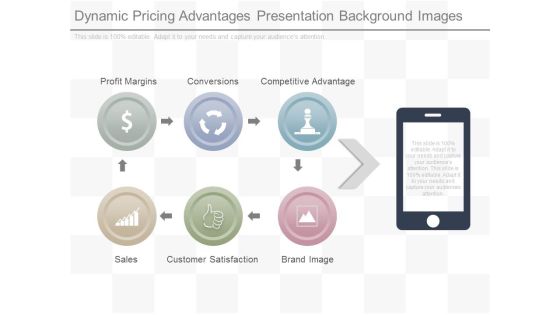
Dynamic Pricing Advantages Presentation Background Images
This is a dynamic pricing advantages presentation background images. This is a six stage process. The stages in this process are profit margins, conversions, competitive advantage, sales, customer satisfaction, brand image.
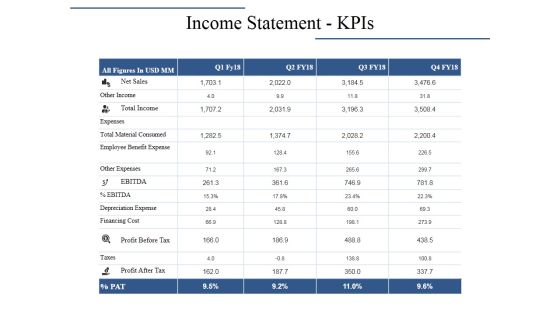
Income Statement Kpis Ppt PowerPoint Presentation Layouts Graphics Pictures
This is a income statement kpis ppt powerpoint presentation layouts graphics pictures. This is a four stage process. The stages in this process are net sales, total income, other income, profit before tax, expenses.
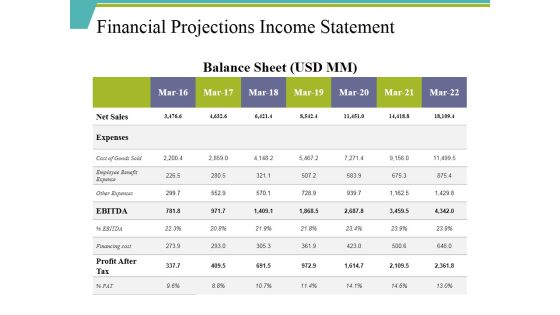
Financial Projections Income Statement Ppt PowerPoint Presentation Show Master Slide
This is a financial projections income statement ppt powerpoint presentation show master slide. This is a seven stage process. The stages in this process are net sales, expenses, profit after tax, other expenses, ebitda.
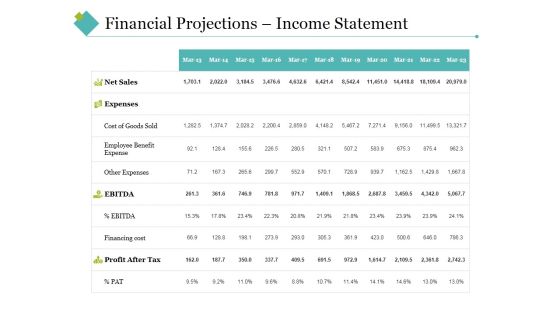
Financial Projections Income Statement Ppt PowerPoint Presentation Portfolio Clipart Images
This is a financial projections income statement ppt powerpoint presentation portfolio clipart images. This is a four stage process. The stages in this process are net sales, expenses, ebitda, profit after tax, financing cost.
Financial Projections Income Statement Ppt PowerPoint Presentation Infographic Template Icon
This is a financial projections income statement ppt powerpoint presentation infographic template icon. This is a eleven stage process. The stages in this process are expenses, total sales, other expenses, profit after tax, net sales.
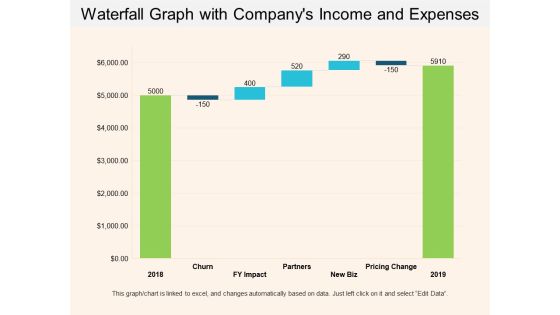
Waterfall Graph With Companys Income And Expenses Ppt PowerPoint Presentation Show Example Introduction
This is a waterfall graph with companys income and expenses ppt powerpoint presentation show example introduction. This is a three stage process. The stages in this process are profit and loss, balance sheet, income statement, benefit and loss.
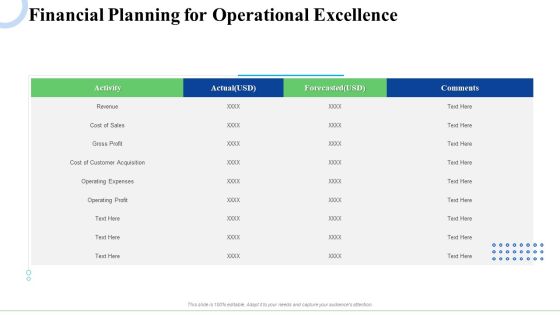
Strategic Plan For Business Expansion And Growth Financial Planning For Operational Excellence Clipart PDF
Deliver and pitch your topic in the best possible manner with this strategic plan for business expansion and growth financial planning for operational excellence clipart pdf. Use them to share invaluable insights on revenue, cost of sales, gross profit, cost of customer acquisition, operating expenses, operating profit and impress your audience. This template can be altered and modified as per your expectations. So, grab it now.
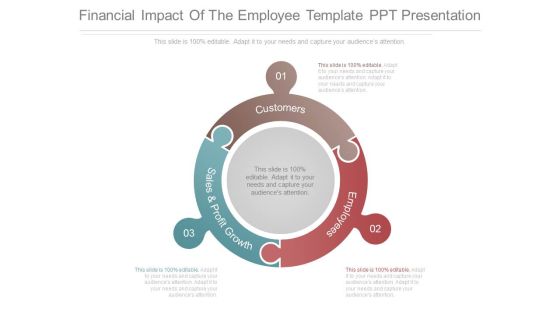
Financial Impact Of The Employee Template Ppt Presentation
This is a financial impact of the employee template ppt presentation. This is a three stage process. The stages in this process are customers, employees, sales and profit growth.

Market And Customer Segmentation Ppt Images
This is a market and customer segmentation ppt images. This is a four stage process. The stages in this process are market and customer segmentation, identification of profit pools, brand positioning and development, customer solution pricing.
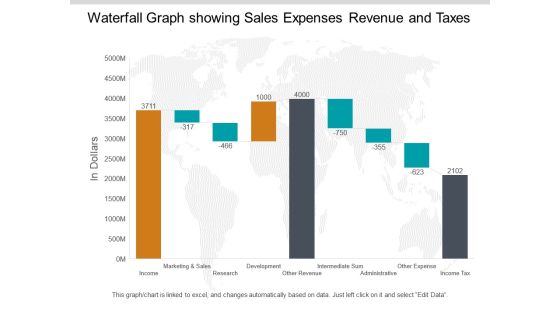
Waterfall Graph Showing Sales Expenses Revenue And Taxes Ppt PowerPoint Presentation Pictures Summary
This is a waterfall graph showing sales expenses revenue and taxes ppt powerpoint presentation pictures summary. This is a three stage process. The stages in this process are profit and loss, balance sheet, income statement, benefit and loss.

Decision Making For Risk Management Diagram Ppt Sample
This is a decision making for risk management diagram ppt sample. This is a four stage process. The stages in this process are uncertainty, return on capital shareholder focus, profit volatility shareholder focus, required capital policyholder focus.

Sales Revenue Product Ppt PowerPoint Presentation Infographic Template Backgrounds
This is a sales revenue product ppt powerpoint presentation infographic template backgrounds. This is a three stage process. The stages in this process are product wise revenue, profit percent of total revenue, total income product.
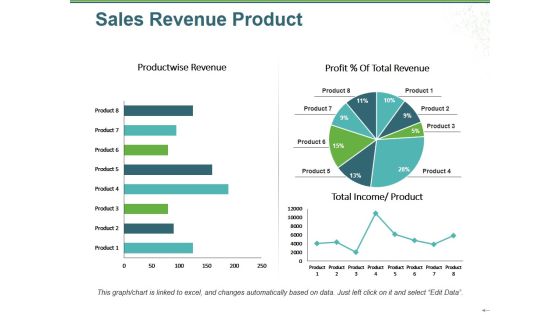
Sales Revenue Product Ppt PowerPoint Presentation Infographic Template Infographic Template
This is a sales revenue product ppt powerpoint presentation infographic template infographic template. This is a three stage process. The stages in this process are product wise revenue, total income, product, profit total revenue, pie.

Organization Strategy Diagram Ppt Slides Download
This is a organization strategy diagram ppt slides download. This is a six stage process. The stages in this process are profit formula, customer value proposition, situation analysis, deriving strategies, monitor and control, problem identification.
Business Emerging Markets Powerpoint Ideas
This is a business emerging markets powerpoint ideas. This is a four stage process. The stages in this process are key resources, customer value proposition, profit formula, key processes.

Bar Graph For Marketing Research Data Powerpoint Slides
This PowerPoint template has been designed with diagram of bar graph. This PPT slide can be used to prepare presentations for profit growth report and also for financial data analysis. You can download finance PowerPoint template to prepare awesome presentations.

Circle Diagram For Business Marketing Mix Powerpoint Slides
This PowerPoint template has been designed with nine steps circle chart. This PPT slide can be used to prepare presentations for profit growth report and also for financial data analysis. You can download finance PowerPoint template to prepare awesome presentations.

Pie Charts For Financial Ratio Analysis Powerpoint Slides
This PowerPoint template has been designed with diagram of pie charts. This PPT slide can be used to prepare presentations for profit growth report and also for financial data analysis. You can download finance PowerPoint template to prepare awesome presentations.

Pyramid For Financial Accounting Information Powerpoint Slides
This PowerPoint template has been designed with graphics of pyramid chart. This PPT slide can be used to prepare presentations for profit growth report and also for financial data analysis. You can download finance PowerPoint template to prepare awesome presentations.

Internet Marketing Objectives Ppt PowerPoint Presentation Layouts Smartart
This is a internet marketing objectives ppt powerpoint presentation layouts smartart. This is a six stage process. The stages in this process are sales leads, product types, sales revenue, profit margins, repeat sales, web visitors.

Technological Advantage Ppt Slides Examples
This is a technological advantage ppt slides examples. This is a four stage process. The stages in this process are exclusive information, profit advantage, technological advantage, unique product, exclusive information.

Stock Photo 3d Blue Glossy Dices Strategy PowerPoint Slide
Our above image slide has been designed with 3d blue glossy dices. This slide contains the concept of gaming and gambling. This PowerPoint slide can be used for various topics business strategy, success. Profit etc.

Sample Marketing Consumer Goods Ppt Presentation
This is a sample marketing consumer goods ppt presentation. This is a six stage process. The stages in this process are industrial goods, service goods, international marketing, business marketing, non profit marketing, consumer goods.

Product Portfolio Analysis Ppt Powerpoint Templates
This is a product portfolio analysis ppt powerpoint templates. This is a four stage process. The stages in this process are green product portfolio analysis, profit contribution, low, high, problematic, productive, prohibitive, promising, environmental impact.
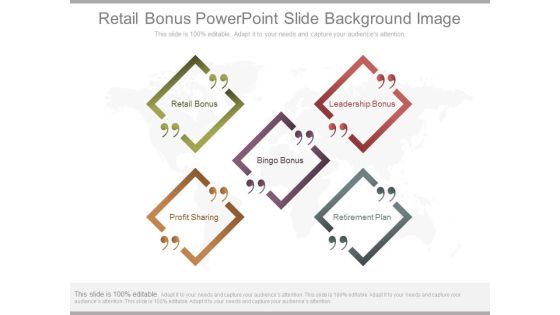
Retail Bonus Powerpoint Slide Background Image
This is a retail bonus powerpoint slide background image. This is a five stage process. The stages in this process are retail bonus, bingo bonus, profit sharing, leadership bonus, retirement plan.

Asset Allocation Decision Diagram Powerpoint Slide Influencers
This is a asset allocation decision diagram powerpoint slide influencers. This is a two stage process. The stages in this process are risk reward ratio, take profit distance, stop loss distance, reward, risk.
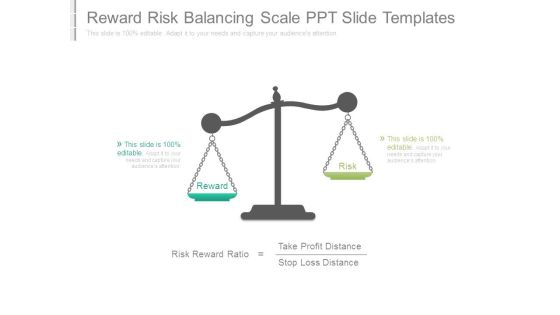
Reward Risk Balancing Scale Ppt Slide Templates
This is a reward risk balancing scale ppt slide templates. This is a two stage process. The stages in this process are risk reward ratio, reward, risk, take profit distance, stop loss distance.

Asset Allocation Ppt PowerPoint Presentation Backgrounds
This is a asset allocation ppt powerpoint presentation backgrounds. This is a two stage process. The stages in this process are reward, risk, risk reward ratio, take profit distance, stop loss distance.
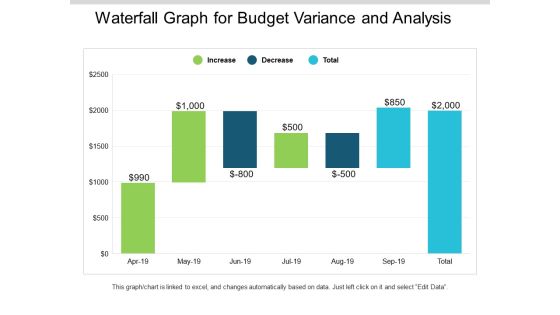
Waterfall Graph For Budget Variance And Analysis Ppt PowerPoint Presentation Slides Mockup
This is a waterfall graph for budget variance and analysis ppt powerpoint presentation slides mockup. This is a three stage process. The stages in this process are profit and loss, balance sheet, income statement, benefit and loss.

Waterfall Graph Showing Births Deaths And Population Change Ppt PowerPoint Presentation Infographic Template Visual Aids
This is a waterfall graph showing births deaths and population change ppt powerpoint presentation infographic template visual aids. This is a three stage process. The stages in this process are profit and loss, balance sheet, income statement, benefit and loss.
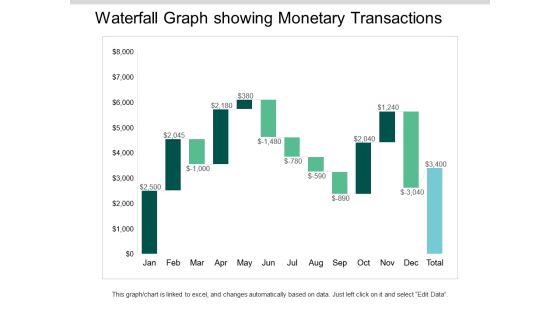
Waterfall Graph Showing Monetary Transactions Ppt PowerPoint Presentation Ideas Visuals
This is a waterfall graph showing monetary transactions ppt powerpoint presentation ideas visuals. This is a three stage process. The stages in this process are profit and loss, balance sheet, income statement, benefit and loss.

Waterfall Graph Summarize Budget 2018 To 2019 Ppt PowerPoint Presentation Summary Slides
This is a waterfall graph summarize budget 2018 to 2019 ppt powerpoint presentation summary slides. This is a three stage process. The stages in this process are profit and loss, balance sheet, income statement, benefit and loss.

Waterfall Graph With Monthly Expenses And Savings Ppt PowerPoint Presentation Layouts Clipart Images
This is a waterfall graph with monthly expenses and savings ppt powerpoint presentation layouts clipart images. This is a three stage process. The stages in this process are profit and loss, balance sheet, income statement, benefit and loss.
Monetary Benefits Ppt PowerPoint Presentation Slides Information
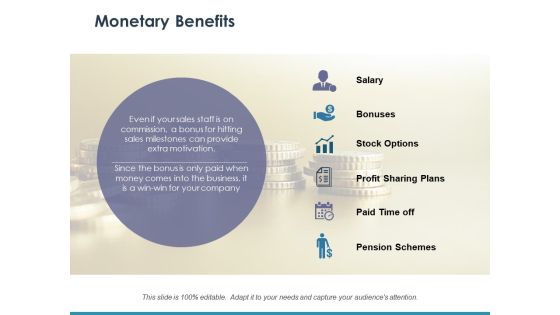
This is a monetary benefits ppt powerpoint presentation slides information. This is a six stage process. The stages in this process are salary, bonuses, stock options, profit sharing plans, paid time off.

Monetary Benefits Ppt PowerPoint Presentation Clipart
This is a monetary benefits ppt powerpoint presentation clipart. This is a six stage process. The stages in this process are salary, bonuses, stock options, profit sharing plans, pension schemes.
Monetary Benefits Ppt PowerPoint Presentation Summary Ideas
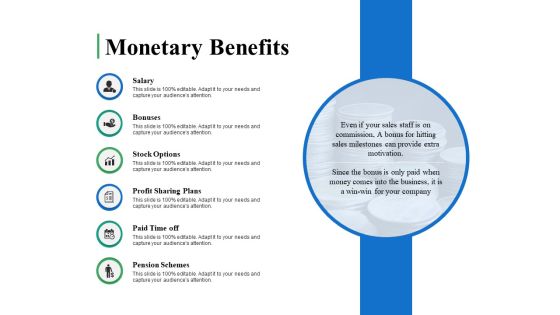
This is a monetary benefits ppt powerpoint presentation summary ideas. This is a six stage process. The stages in this process are salary, bonuses, stock options, profit sharing plans, pension schemes.
Example Of Value Chain Model Presentation Visuals
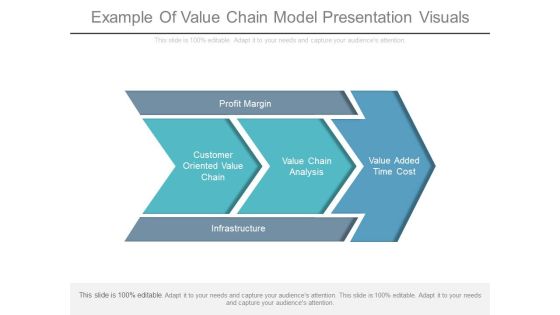
This is a example of value chain model presentation visuals. This is a five stage process. The stages in this process are profit margin, customer oriented value chain, value chain analysis, value added time cost, infrastructure.
Financial Dashboard Examples Ppt Templates
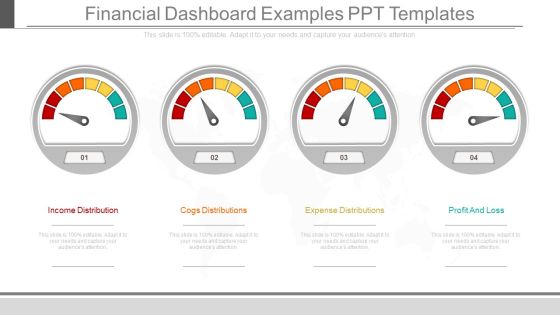
This is a financial dashboard examples ppt templates. This is a four stage process. The stages in this process are income distribution, cogs distributions, expense distributions, profit and loss.
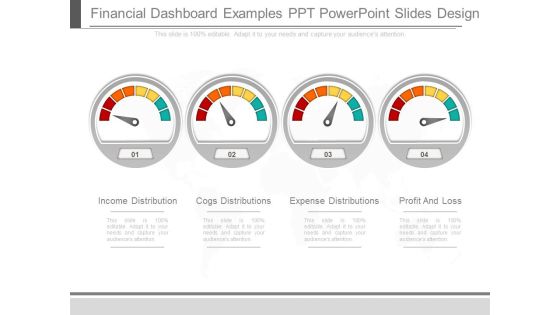
Financial Dashboard Examples Ppt Powerpoint Slides Design
This is a financial dashboard examples ppt powerpoint slides design. This is a four stage process. The stages in this process are income distribution, cogs distributions, expense distributions, profit and loss.

Pandl Kpis Ppt PowerPoint Presentation Gallery Display
This is a pandl kpis ppt powerpoint presentation gallery display. This is a four stage process. The stages in this process are net sales, total income, expenses, ebitda, profit after tax.
P And L Kpis Template 1 Ppt PowerPoint Presentation Icon Graphics Download
This is a p and l kpis template 1 ppt powerpoint presentation icon graphics download. This is a four stage process. The stages in this process are net sales, total income, expenses, financing cost, profit after tax.

Monetary Benefits Ppt PowerPoint Presentation Ideas Design Inspiration
This is a monetary benefits ppt powerpoint presentation ideas design inspiration. This is a six stage process. The stages in this process are salary, bonuses, stoke options, profit sharing plans, paid time off.

Competitors Analysis Template Ppt PowerPoint Presentation Infographic Template Rules
This is a competitors analysis template ppt powerpoint presentation infographic template rules. This is a four stage process. The stages in this process are net profit margin, finance, marketing, bar, success.
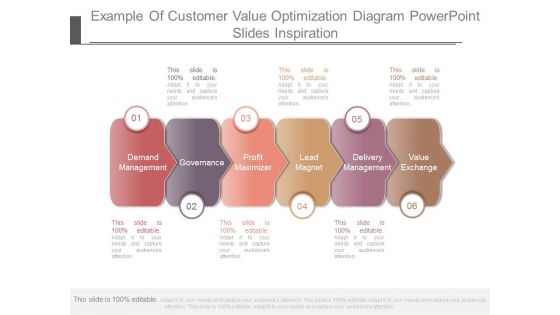
Example Of Customer Value Optimization Diagram Powerpoint Slides Inspiration
This is a example of customer value optimization diagram powerpoint slides inspiration. This is a six stage process. The stages in this process are demand management, governance, profit maximizer, lead magnet, delivery management, value exchange.
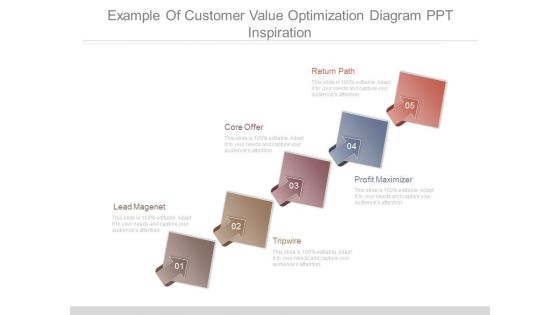
Example Of Customer Value Optimization Diagram Ppt Inspiration
This is a example of customer value optimization diagram ppt inspiration. This is a five stage process. The stages in this process are lead magnet, core offer, return path, tripwire, profit maximizer.

Value Based Pricing Example Example Of Ppt Presentation
This is a value based pricing example example of ppt presentation. This is a five stage process. The stages in this process are demand, sales, brand image, profit margins, conversions.
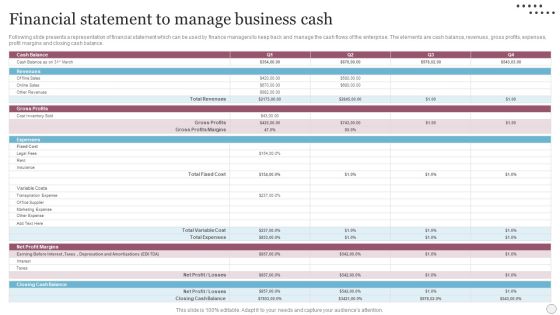
Financial Statement To Manage Business Cash Demonstration PDF
Following slide presents a representation of financial statement which can be used by finance managers to keep track and manage the cash flows of the enterprise. The elements are cash balance, revenues, gross profits, expenses, profit margins and closing cash balance. Following slide presents a representation of financial statement which can be used by finance managers to keep track and manage the cash flows of the enterprise. The elements are cash balance, revenues, gross profits, expenses, profit margins and closing cash balance. Pitch your topic with ease and precision using this Financial Statement To Manage Business Cash Demonstration PDF. This layout presents information on Financial statement to manage business cash. It is also available for immediate download and adjustment. So, changes can be made in the color, design, graphics or any other component to create a unique layout.

Pricing Objectives Diagram Sample Of Ppt Presentation
This is a pricing objectives diagram sample of ppt presentation. This is a seven stage process. The stages in this process are pricing objectives, revenue maximization, profit maximization, partial cost recovery, survival, status quo, quantity leader, maximize quantity.

Business Intelligence Performance Dashboard Ppt Powerpoint Slides
This is a business intelligence performance dashboard ppt powerpoint slides. This is a six stage process. The stages in this process are total revenue, detailed profit of top product line, part capacity allocation, market share, customer satisfaction, quality notification.
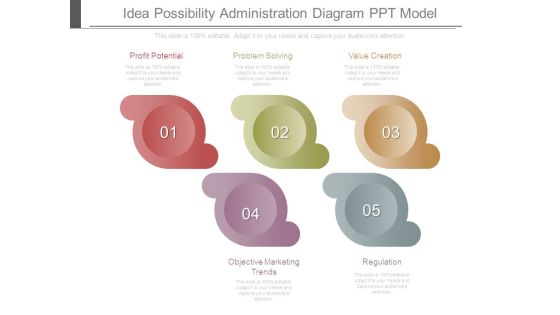
Idea Possibility Administration Diagram Ppt Model
This is a idea possibility administration diagram ppt model. This is a five stage process. The stages in this process are profit potential, problem solving, value creation, objective marketing trends, regulation.

Annual Planning Calendar Diagram Powerpoint Guide
This is a annual planning calendar diagram powerpoint guide. This is a six stage process. The stages in this process are strategic management model, managing profit and performance, product service, values mission vision, external environment, financial objectives.

Business Model Canvas Ppt PowerPoint Presentation Designs
This is a business model canvas ppt powerpoint presentation designs. This is a three stage process. The stages in this process are profit models, unique value proposition, market attractiveness, sales performance model, sustainability.

Business Model Canvas Template 1 Ppt PowerPoint Presentation Summary Example
This is a business model canvas template 1 ppt powerpoint presentation summary example. This is a three stage process. The stages in this process are business model, unique value proposition, profit models, graceful exit.

Cycle Of Management Accounting Tools Ppt Example Of Ppt
This is a cycle of management accounting tools ppt example of ppt. This is a four stage process. The stages in this process are balance sheet, profit and loss account, cash flow statement, fund flow statement.\n\n\n\n\n\n\n\n\n\n\n\n\n\n\n\n\n\n
