AI PPT Maker
Templates
PPT Bundles
Design Services
Business PPTs
Business Plan
Management
Strategy
Introduction PPT
Roadmap
Self Introduction
Timelines
Process
Marketing
Agenda
Technology
Medical
Startup Business Plan
Cyber Security
Dashboards
SWOT
Proposals
Education
Pitch Deck
Digital Marketing
KPIs
Project Management
Product Management
Artificial Intelligence
Target Market
Communication
Supply Chain
Google Slides
Research Services
 One Pagers
All Categories
-
Home
- Customer Favorites
- Profit Icon
Profit Icon

Cios Value Optimization Playbook Ppt PowerPoint Presentation Complete Deck With Slides
This complete deck acts as a great communication tool. It helps you in conveying your business message with personalized sets of graphics, icons etc. Comprising a set of sixty eight slides, this complete deck can help you persuade your audience. It also induces strategic thinking as it has been thoroughly researched and put together by our experts. Not only is it easily downloadable but also editable. The color, graphics, theme any component can be altered to fit your individual needs. So grab it now.

Oracle Analytics Cloud Solutions Smart Mobile Sample PDF
This slide represents the predictive analytics solution of the oracle analytics cloud and how it is helpful to predict outputs and display quickly with the help of ML. Deliver and pitch your topic in the best possible manner with this oracle analytics cloud solutions predictive analytics icons pdf. Use them to share invaluable insights on oracle analytics cloud solutions smart mobile and impress your audience. This template can be altered and modified as per your expectations. So, grab it now.

Services Sales Capital Investment Pitch Deck Value Proposition Of Firm In Leveraging Customer Relationships Background PDF
This slide caters details about key business challenges are faced by prospects in context to services such as high IT cost, poor business agility, regulatory compliances, etc. This is a services sales capital investment pitch deck what business challenges are faced by prospect icons pdf template with various stages. Focus and dispense information on five stages using this creative set, that comes with editable features. It contains large content boxes to add your information on topics like humongous it cost, infrastructure silos, security threats, regulatory compliances, poor business agilit. You can also showcase facts, figures, and other relevant content using this PPT layout. Grab it now.

Scatter Bubble Chart Ppt PowerPoint Presentation Summary Files
This is a scatter bubble chart ppt powerpoint presentation summary files. This is a six stage process. The stages in this process are product, financial year, profit, highest profit.

Income Statement Graphical Representation Ppt PowerPoint Presentation Infographics Layouts
This is a income statement graphical representation ppt powerpoint presentation infographics layouts. This is a four stage process. The stages in this process are revenue, cogs, operating profit, net profit.
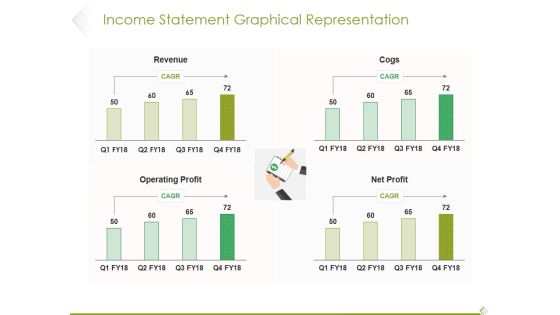
Income Statement Graphical Representation Ppt PowerPoint Presentation Infographic Template Influencers
This is a income statement graphical representation ppt powerpoint presentation infographic template influencers. This is a four stage process. The stages in this process are revenue, cogs, operating profit, profit.

Income Statement Graphical Representation Ppt PowerPoint Presentation Pictures Design Templates
This is a income statement graphical representation ppt powerpoint presentation pictures design templates. This is a four stage process. The stages in this process are revenue, operating profit, net profit, cogs, business.
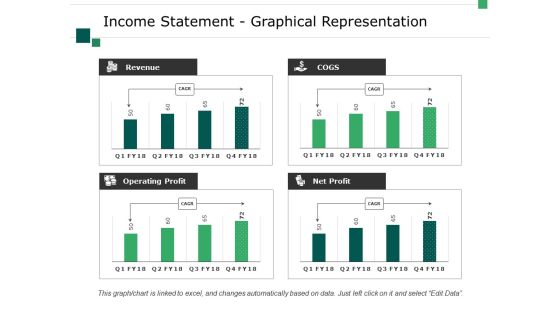
Income Statement Graphical Representation Ppt PowerPoint Presentation Visual Aids Layouts
This is a income statement graphical representation ppt powerpoint presentation visual aids layouts. This is a four stage process. The stages in this process are business, marketing, revenue, operating profit, net profit, cogs.
Increase In Dollar Graph Finance PowerPoint Templates And PowerPoint Themes 0912
Increase In Dollar Graph Finance PowerPoint Templates And PowerPoint Themes 0912-Microsoft Powerpoint Templates and Background with business graph with arrow showing profits-Business graph with arrow showing profits, signs, success, finance, business, arrows
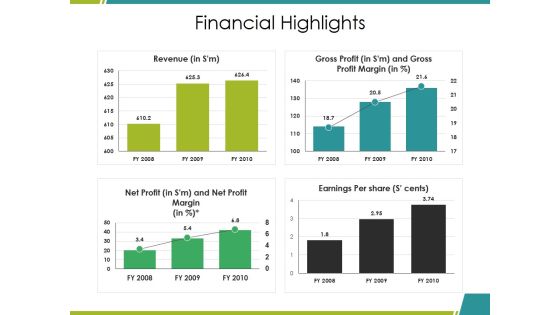
Financial Highlights Ppt PowerPoint Presentation Ideas Graphics Download
This is a financial highlights ppt powerpoint presentation ideas graphics download. This is a four stage process. The stages in this process are revenue, gross profit, net profit, earnings per share, bar graph.
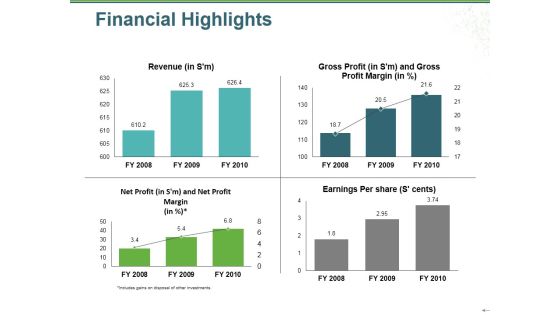
Financial Highlights Ppt PowerPoint Presentation Gallery Graphics Example
This is a financial highlights ppt powerpoint presentation gallery graphics example. This is a four stage process. The stages in this process are revenue, gross profit, net profit, earnings per share, bar graph.
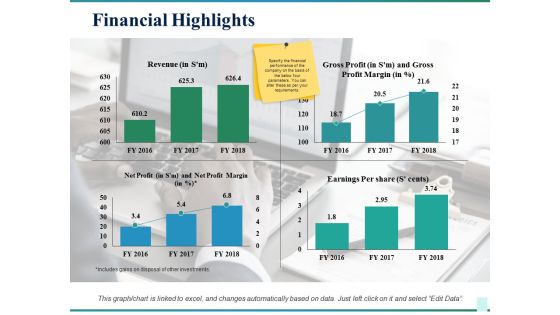
Financial Highlights Ppt PowerPoint Presentation Infographic Template Slide Download
This is a financial highlights ppt powerpoint presentation infographic template slide download. This is a four stage process. The stages in this process are business, revenue, gross profit, earnings per share, net profit, marketing.

Current Financial Highlights Ppt PowerPoint Presentation Professional Slide Download
This is a current financial highlights ppt powerpoint presentation professional slide download. This is a four stage process. The stages in this process are revenue, gross profit, net profit, earnings per share.

Current Financial Highlights Ppt PowerPoint Presentation File Demonstration
This is a current financial highlights ppt powerpoint presentation show example. This is a four stage process. The stages in this process are revenue, net profit, earnings per share, gross profit.

Pandl Kpis Tabular Form Ppt PowerPoint Presentation Visual Aids
This is a pandl kpis tabular form ppt powerpoint presentation visual aids. This is a four stage process. The stages in this process are revenue, cogs, operating profit, net profit.
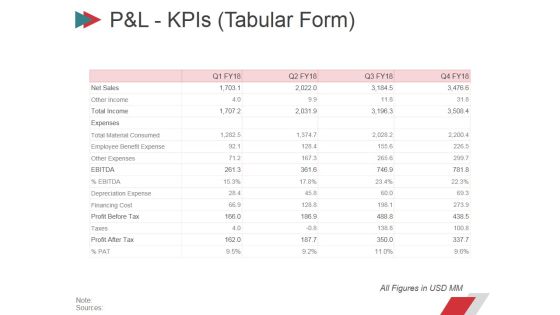
Pandl Kpis Tabular Form Ppt PowerPoint Presentation Summary Layout
This is a pandl kpis tabular form ppt powerpoint presentation summary layout. This is a four stage process. The stages in this process are revenue, cogs, operating profit, net profit.

Pandl Kpis Tabular Form Ppt PowerPoint Presentation File Design Templates
This is a pandl kpis tabular form ppt powerpoint presentation file design templates. This is a four stage process. The stages in this process are revenue, cogs, operating profit, net profit.

Pandl Kpis Tabular Form Ppt PowerPoint Presentation Pictures Visual Aids
This is a pandl kpis tabular form ppt powerpoint presentation pictures visual aids. This is a four stage process. The stages in this process are revenue, operating profit, cogs, net profit.

P And L Kpis Template 2 Ppt PowerPoint Presentation Inspiration Grid
This is a p and l kpis template 2 ppt powerpoint presentation inspiration grid. This is a four stage process. The stages in this process are revenue, cogs, operating profit, net profit.
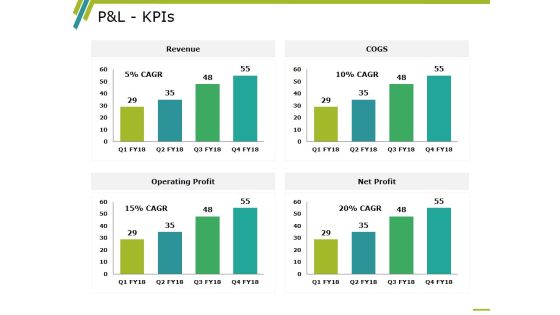
P And L Kpis Template 2 Ppt PowerPoint Presentation Professional Information
This is a p and l kpis template 2 ppt powerpoint presentation professional information. This is a four stage process. The stages in this process are revenue, operating profit, cogs, net profit, business.

P And L Kpis Ppt PowerPoint Presentation Designs Download
This is a p and l kpis ppt powerpoint presentation designs download. This is a four stage process. The stages in this process are revenue, cogs, operating profit, net profit.
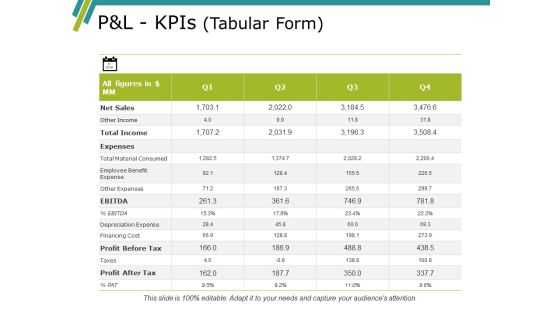
Pandl Kpis Template Ppt PowerPoint Presentation Gallery Summary
This is a pandl kpis template ppt powerpoint presentation gallery summary. This is a four stage process. The stages in this process are revenue, cogs, operating profit, net profit.
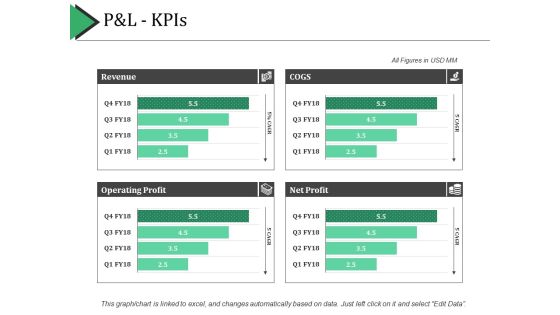
P And L Kpis Ppt PowerPoint Presentation Show Example Introduction
This is a p and l kpis ppt powerpoint presentation show example introduction. This is a four stage process. The stages in this process are revenue, cogs, net profit, operating profit.

Pandl Kpis Ppt PowerPoint Presentation Professional Backgrounds
This is a pandl kpis ppt powerpoint presentation professional backgrounds. This is a four stage process. The stages in this process are business, revenue, operating profit, cogs, net profit.

Transportation Governance Enhancement Revenue Earned By Our Logistic Company Rules PDF
This slide covers the revenue earned by our logistic company in year 2021 and 2020 along with gross profit, return on equity, EPS, etc. Deliver an awe-inspiring pitch with this creative transportation governance enhancement revenue earned by our logistic company rules pdf. bundle. Topics like total revenue, gross profit, operating profit, net profit, return on equity can be discussed with this completely editable template. It is available for immediate download depending on the needs and requirements of the user.
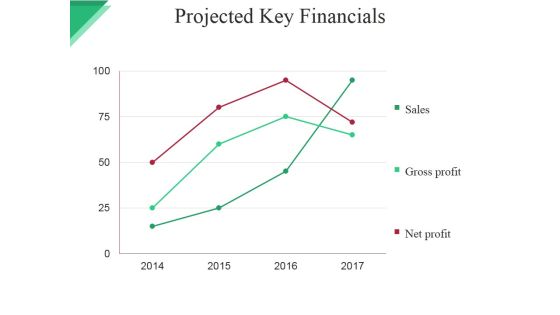
Projected Key Financials Template Ppt PowerPoint Presentation File Graphic Images
This is a projected key financials template ppt powerpoint presentation file graphic images. This is a four stage process. The stages in this process are sales, gross profit, net profit.

Projected Key Financials Template 1 Ppt PowerPoint Presentation Summary Professional
This is a projected key financials template 1 ppt powerpoint presentation summary professional. This is a three stage process. The stages in this process are in dollar, sales, gross profit, net profit, graph, year.
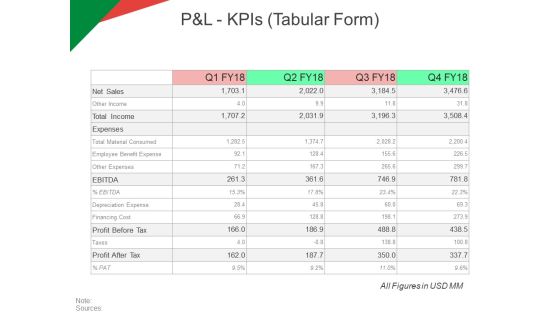
P And L Kpis Tabular Form Ppt PowerPoint Presentation Model Ideas
This is a p and l kpis tabular form ppt powerpoint presentation model ideas. This is a four stage process. The stages in this process are revenue, operating profit, cogs, net profit.
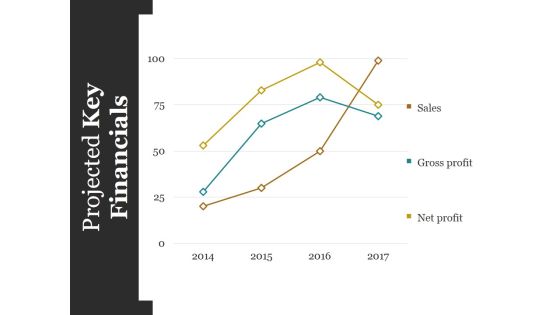
Projected Key Financials Template Ppt PowerPoint Presentation Styles Graphics Design
This is a projected key financials template ppt powerpoint presentation styles graphics design. This is a four stage process. The stages in this process are sales, gross profit, net profit.
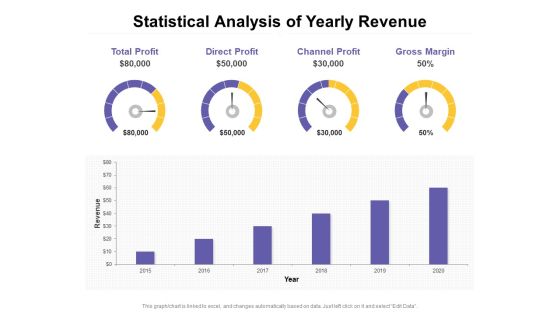
Statistical Analysis Of Yearly Revenue Ppt PowerPoint Presentation Slides Graphics PDF
Presenting this set of slides with name statistical analysis of yearly revenue ppt powerpoint presentation slides graphics pdf. The topics discussed in these slides are total profit, direct profit, channel profit, gross margin. This is a completely editable PowerPoint presentation and is available for immediate download. Download now and impress your audience.

Income Assessment Report Ppt PowerPoint Presentation Complete Deck With Slides
This complete deck acts as a great communication tool. It helps you in conveying your business message with personalized sets of graphics, icons etc. Comprising a set of fourty seven slides, this complete deck can help you persuade your audience. It also induces strategic thinking as it has been thoroughly researched and put together by our experts. Not only is it easily downloadable but also editable. The color, graphics, theme any component can be altered to fit your individual needs. So grab it now.

Cross Channel Marketing Benefits Ppt PowerPoint Presentation Complete Deck With Slides
This complete deck acts as a great communication tool. It helps you in conveying your business message with personalized sets of graphics, icons etc. Comprising a set of forty two slides, this complete deck can help you persuade your audience. It also induces strategic thinking as it has been thoroughly researched and put together by our experts. Not only is it easily downloadable but also editable. The color, graphics, theme any component can be altered to fit your individual needs. So grab it now.

Computer Laptop Tablet And Mobile With Percentage Values Powerpoint Slides
This slide which shows a mobile, a tablet and a laptop / TV screen can be perfectly used to demonstrate compatibility of an application or a website on different kind of devices, operating systems and screen sizes. This slide can be used by business and organizations dealing with technology in any manner. The slide can be used to demonstrate the usage experience on different screen sizes. It can be used to demonstrate the number of users of a website or an app or a particular platform. It can also easily depict the ratio of users on the based on their usage patterns and preferences of devise. This can be an effective way to compare one gadget with another. The slide is customizable and can be used with different icons and colors as per the convenience and needs of the user.

Amazon Business Strategies To Gain Competitive Advantage Ppt PowerPoint Presentation Complete Deck With Slides
Create a proper and aligned organizational framework that meets your business expectations. Deploy this ready to use Amazon Business Strategies To Gain Competitive Advantage Ppt PowerPoint Presentation Complete Deck With Slides and use it to design a structure for your company that showcases the quality of your management, and more. Use this eighty four Slide complete deck to showcase essential components of your organizational framework. Present this PPT Design to your stakeholders to draw an organizational framework that supports your vision and goals. Find relevant icons as well on a download, as this this presentation is completely editable and 100 percent customizable. Get it now.

Newest Trends To Gain Competitive Advantage For The Business Ppt PowerPoint Presentation Complete Deck With Slides
This complete deck acts as a great communication tool. It helps you in conveying your business message with personalized sets of graphics, icons etc. Comprising a set of fifty one slides, this complete deck can help you persuade your audience. It also induces strategic thinking as it has been thoroughly researched and put together by our experts. Not only is it easily downloadable but also editable. The color, graphics, theme any component can be altered to fit your individual needs. So grab it now.

Major Advantages Of Banking Industry Revolution Ppt PowerPoint Presentation Complete Deck With Slides
This complete deck acts as a great communication tool. It helps you in conveying your business message with personalized sets of graphics, icons etc. Comprising a set of fourt three slides, this complete deck can help you persuade your audience. It also induces strategic thinking as it has been thoroughly researched and put together by our experts. Not only is it easily downloadable but also editable. The color, graphics, theme any component can be altered to fit your individual needs. So grab it now.
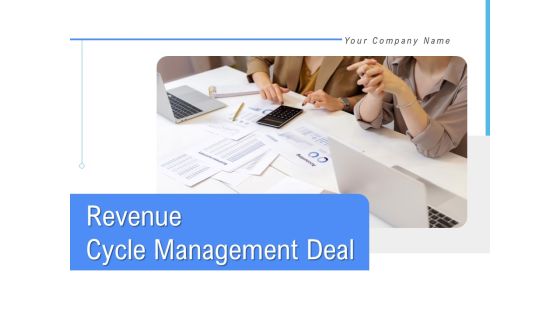
Revenue Cycle Management Deal Ppt PowerPoint Presentation Complete Deck With Slides
This complete deck acts as a great communication tool. It helps you in conveying your business message with personalized sets of graphics, icons etc. Comprising a set of forty eight slides, this complete deck can help you persuade your audience. It also induces strategic thinking as it has been thoroughly researched and put together by our experts. Not only is it easily downloadable but also editable. The color, graphics, theme any component can be altered to fit your individual needs. So grab it now.

Revenue Decrease Of A Beverage Company Ppt PowerPoint Presentation Complete Deck With Slides
This complete deck acts as a great communication tool. It helps you in conveying your business message with personalized sets of graphics, icons etc. Comprising a set of fourty seven slides, this complete deck can help you persuade your audience. It also induces strategic thinking as it has been thoroughly researched and put together by our experts. Not only is it easily downloadable but also editable. The color, graphics, theme any component can be altered to fit your individual needs. So grab it now.

Sales Funnel Management For Revenue Generation Ppt PowerPoint Presentation Complete Deck With Slides
This complete deck acts as a great communication tool. It helps you in conveying your business message with personalized sets of graphics, icons etc. Comprising a set of fifty nine slides, this complete deck can help you persuade your audience. It also induces strategic thinking as it has been thoroughly researched and put together by our experts. Not only is it easily downloadable but also editable. The color, graphics, theme any component can be altered to fit your individual needs. So grab it now.

Improving Distribution Channel To Boost Sales Revenue Ppt PowerPoint Presentation Complete Deck With Slides
This complete deck acts as a great communication tool. It helps you in conveying your business message with personalized sets of graphics, icons etc. Comprising a set of fivty eight slides, this complete deck can help you persuade your audience. It also induces strategic thinking as it has been thoroughly researched and put together by our experts. Not only is it easily downloadable but also editable. The color, graphics, theme any component can be altered to fit your individual needs. So grab it now.

Lowering Sales And Revenue Of A Telecommunication Firm Case Competition Ppt PowerPoint Presentation Complete Deck With Slides
This complete deck acts as a great communication tool. It helps you in conveying your business message with personalized sets of graphics, icons etc. Comprising a set of thirty eight slides, this complete deck can help you persuade your audience. It also induces strategic thinking as it has been thoroughly researched and put together by our experts. Not only is it easily downloadable but also editable. The color, graphics, theme any component can be altered to fit your individual needs. So grab it now.
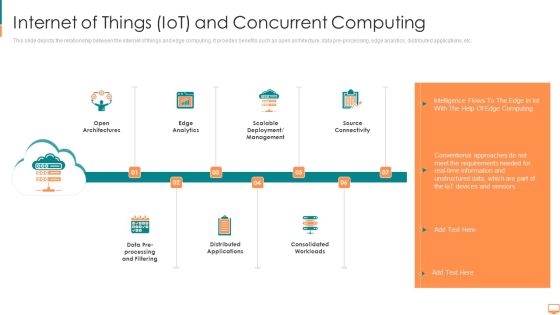
Internet Of Things Iot And Concurrent Computing Ppt Outline Objects PDF
This slide depicts the relationship between the internet of things and edge computing. It provides benefits such as open architecture, data pre processing, edge analytics, distributed applications, etc. This is a icons slide for concurrent computing ppt summary clipart pdf template with various stages. Focus and dispense information on seven stages using this creative set, that comes with editable features. It contains large content boxes to add your information on topics like intelligence, computing, approaches, conventional, information. You can also showcase facts, figures, and other relevant content using this PPT layout. Grab it now.
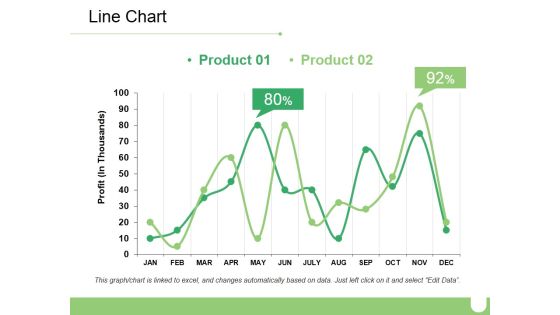
Line Chart Ppt PowerPoint Presentation Ideas Diagrams
This is a line chart ppt powerpoint presentation ideas diagrams. This is a two stage process. The stages in this process are business, marketing, percentage, financial, profit.
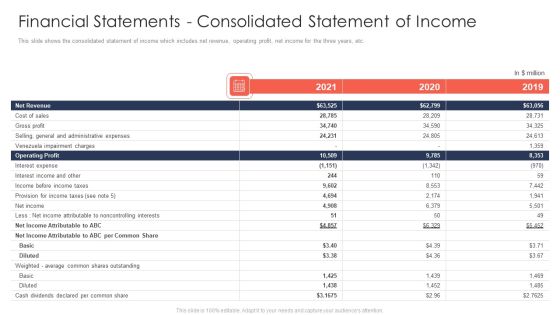
Trading Current Franchise Business Financial Statements Consolidated Statement Of Income Themes PDF
This slide shows the consolidated statement of income which includes net revenue, operating profit, net income for the three years, etc. Deliver an awe inspiring pitch with this creative trading current franchise business financial statements consolidated statement of income themes pdf bundle. Topics like net revenue, cost of sales, operating profit, gross profit, interest expense can be discussed with this completely editable template. It is available for immediate download depending on the needs and requirements of the user.

Value Production Flow Chart Presentation Powerpoint
This is a value production flow chart presentation powerpoint. This is a three stage process. The stages in this process are value production, cost, revenue, profit.

Internal And External Logistics Management Procedure Revenue Earned By Our Logistic Company Infographics PDF
This slide covers the revenue earned by our logistic company in year 2021 and 2020 along with gross profit, return on equity, EPS, etc. Deliver an awe inspiring pitch with this creative internal and external logistics management procedure revenue earned by our logistic company infographics pdf bundle. Topics like total revenue, gross profit, operating profit, return on equity can be discussed with this completely editable template. It is available for immediate download depending on the needs and requirements of the user.
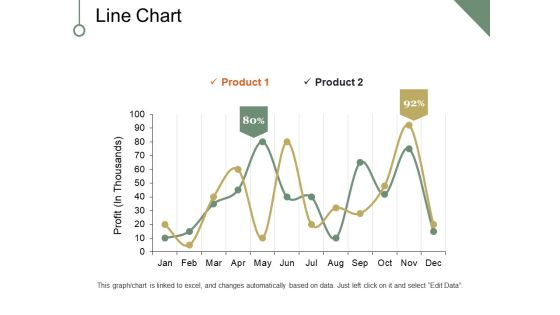
Line Chart Ppt PowerPoint Presentation Pictures Portfolio
This is a line chart ppt powerpoint presentation pictures portfolio. This is a two stage process. The stages in this process are profit, business, marketing, finance, chart.

Bubble Chart Ppt PowerPoint Presentation Professional Backgrounds
This is a bubble chart ppt powerpoint presentation professional backgrounds. This is a two stage process. The stages in this process are profit, chart, business, marketing, finance.
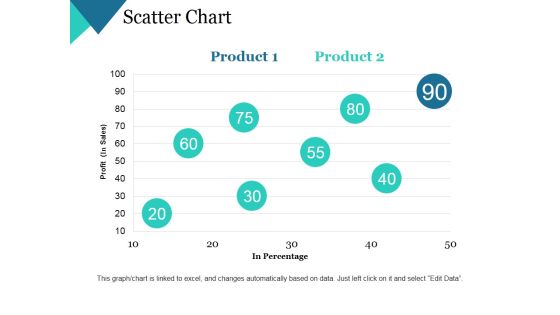
Scatter Chart Ppt PowerPoint Presentation Gallery Microsoft
This is a scatter chart ppt powerpoint presentation gallery microsoft. This is a two stage process. The stages in this process are profit, in percentage, business, marketing, chart.
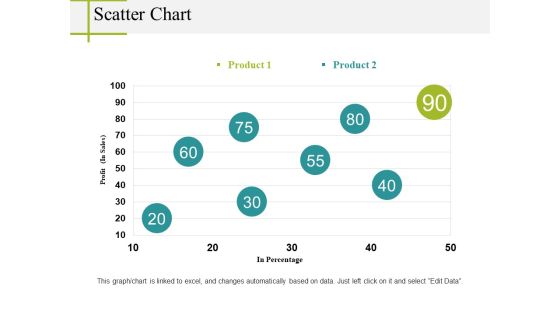
Scatter Chart Ppt PowerPoint Presentation Infographics Good
This is a scatter chart ppt powerpoint presentation infographics good. This is a two stage process. The stages in this process are in percentage, profit, chart, business, marketing.
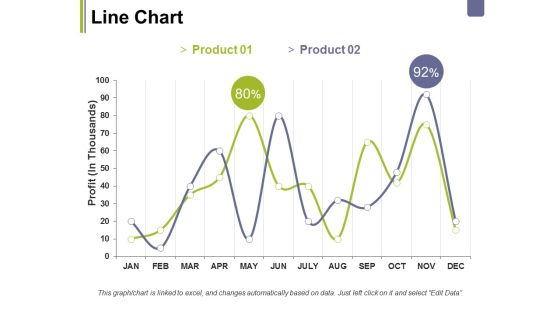
Line Chart Ppt PowerPoint Presentation Layouts Topics
This is a line chart ppt powerpoint presentation layouts topics. This is a two stage process. The stages in this process are business, profit, chart, percentage, graph, marketing.

Line Chart Ppt PowerPoint Presentation Portfolio Deck
This is a line chart ppt powerpoint presentation portfolio deck. This is a two stage process. The stages in this process are business, marketing, profit, chart, percentage.

Line Chart Ppt PowerPoint Presentation Summary Demonstration
This is a line chart ppt powerpoint presentation summary demonstration. This is a two stage process. The stages in this process are business, profit, line chart, percentage, finance.
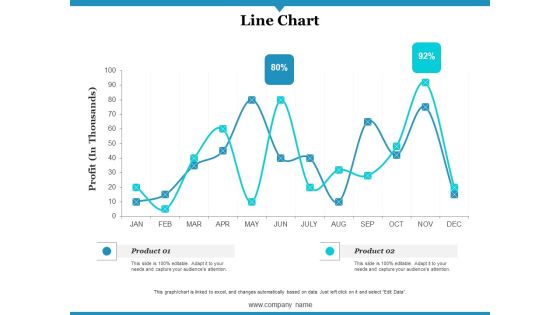
Line Chart Ppt PowerPoint Presentation Gallery Infographics
This is a line chart ppt powerpoint presentation gallery infographics. This is a two stage process. The stages in this process are profit, product, line chart.

Bubble Chart Ppt PowerPoint Presentation Summary Background
This is a bubble chart ppt powerpoint presentation summary background. This is a two stage process. The stages in this process are bubble chart, profit, product, finance, business.

Bubble Chart Ppt PowerPoint Presentation Portfolio Files
This is a bubble chart ppt powerpoint presentation portfolio files. This is a five stage process. The stages in this process are profit, bubble chart, in percentage.

Scatter Chart Ppt PowerPoint Presentation Gallery Guide
This is a scatter chart ppt powerpoint presentation gallery guide. This is a one stage process. The stages in this process are profit, product, in percentage, growth, success.

Combo Chart Ppt PowerPoint Presentation Slides Introduction
This is a combo chart ppt powerpoint presentation slides introduction. This is a four stage process. The stages in this process are profit, years, business, marketing, graph.
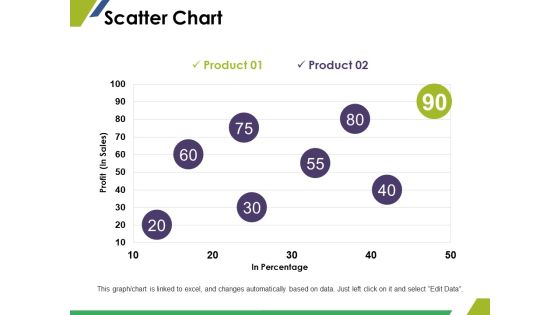
Scatter Chart Ppt PowerPoint Presentation Styles Images
This is a scatter chart ppt powerpoint presentation styles images. This is a two stage process. The stages in this process are in percentage, profit, finance, marketing, business.

Line Chart Ppt PowerPoint Presentation Summary Rules
This is a line chart ppt powerpoint presentation summary rules. This is a two stage process. The stages in this process are profit, business, marketing, graph, finance.
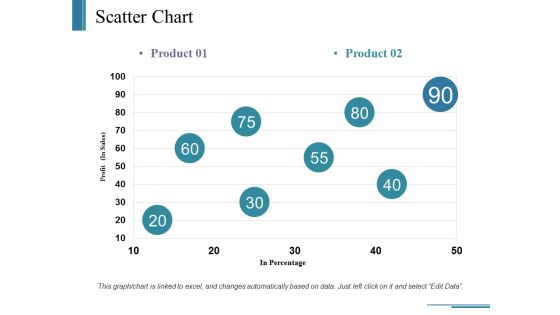
Scatter Chart Ppt PowerPoint Presentation Ideas Example
This is a scatter chart ppt powerpoint presentation ideas example. This is a two stage process. The stages in this process are business, in percentage, profit, marketing, graph.

Bubble Chart Ppt PowerPoint Presentation Styles Objects
This is a bubble chart ppt powerpoint presentation styles objects. This is a two stage process. The stages in this process are profit, business, marketing, finance, chart.
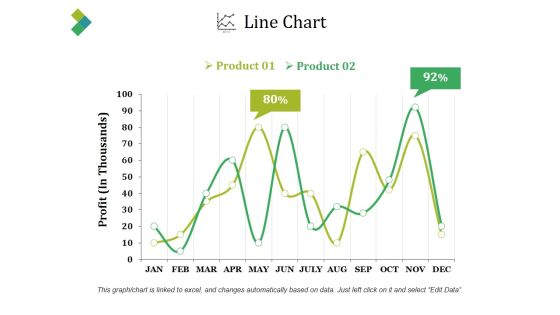
Line Chart Ppt PowerPoint Presentation Slides
This is a line chart ppt powerpoint presentation slides. This is a two stage process. The stages in this process are product, profit, percentage, finance, line chart.
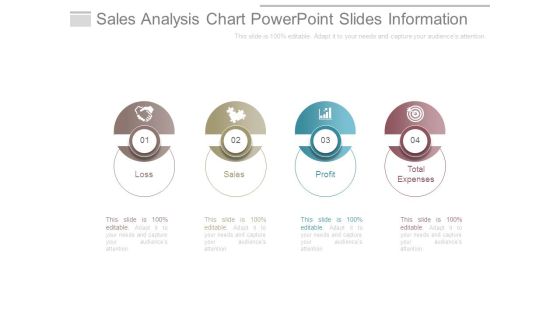
Sales Analysis Chart Powerpoint Slides Information
This is a sales analysis chart powerpoint slides information. This is a four stage process. The stages in this process are loss, sales, profit, total expenses.

Combo Chart Ppt PowerPoint Presentation Ideas Brochure
This is a combo chart ppt powerpoint presentation ideas brochure. This is a four stage process. The stages in this process are product, profit, growth, success, business.

Line Chart Ppt PowerPoint Presentation Portfolio Shapes
This is a line chart ppt powerpoint presentation portfolio shapes. This is a two stage process. The stages in this process are profit, product, business, marketing, graph.
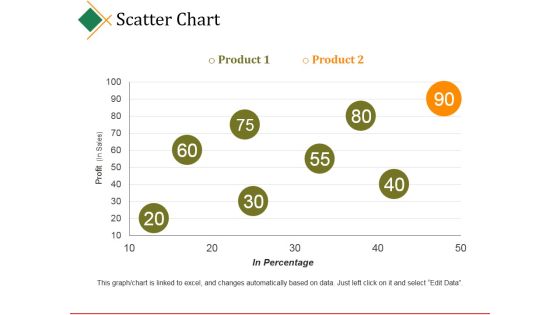
Scatter Chart Ppt PowerPoint Presentation Model
This is a scatter chart ppt powerpoint presentation model. This is a two stage process. The stages in this process are business, product, profit, in percentage, business.
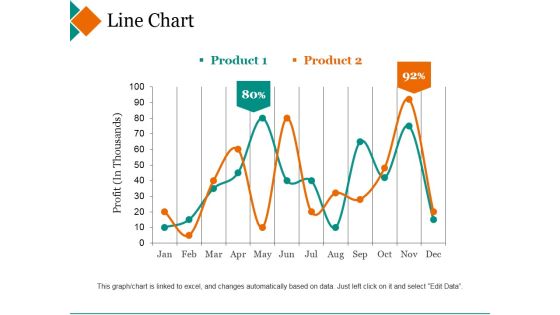
Line Chart Ppt PowerPoint Presentation Inspiration Deck
This is a line chart ppt powerpoint presentation inspiration deck. This is a two stage process. The stages in this process are product, profit, percentage, finance, line graph.
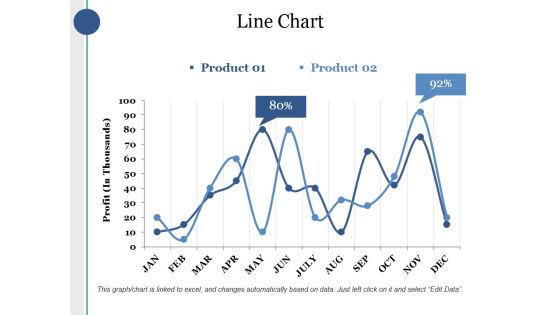
Line Chart Ppt PowerPoint Presentation Layouts Sample
This is a line chart ppt powerpoint presentation layouts sample. This is a two stage process. The stages in this process are product, profit, percentage, finance, business.

Scatter Chart Ppt PowerPoint Presentation File Visuals
This is a scatter chart ppt powerpoint presentation file visuals. This is a two stage process. The stages in this process are product, profit, in percentage, growth, success.
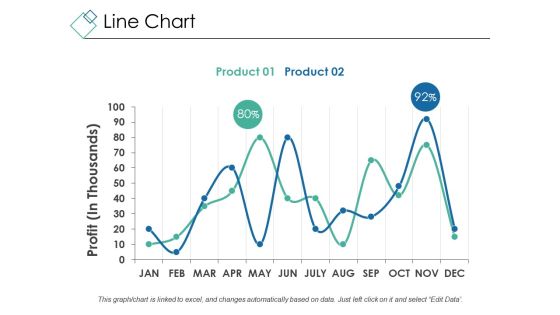
Line Chart Ppt PowerPoint Presentation Outline Design Ideas
This is a line chart ppt powerpoint presentation outline design ideas. This is a two stage process. The stages in this process are profit, percentage, chart, business, marketing.

Bubble Chart Ppt PowerPoint Presentation Styles Example Topics
This is a bubble chart ppt powerpoint presentation styles example topics. This is a two stage process. The stages in this process are profit, chart, business, marketing, finance.

Line Chart Ppt PowerPoint Presentation Portfolio File Formats
This is a line chart ppt powerpoint presentation portfolio file formats. This is a two stage process. The stages in this process are product, profit, line chart.

Stacked Line Chart Ppt PowerPoint Presentation Styles Graphics
This is a stacked line chart ppt powerpoint presentation styles graphics. This is a two stage process. The stages in this process are product, year, profit, percentage, growth.

Scatter Bubble Chart Ppt PowerPoint Presentation Summary Slides
This is a scatter bubble chart ppt powerpoint presentation summary slides. This is a one stage process. The stages in this process are product, profit, in percentage.

Area Chart Ppt PowerPoint Presentation Gallery Clipart Images
This is a area chart ppt powerpoint presentation gallery clipart images. This is a two stage process. The stages in this process are product, profit, business, finance, marketing.

Line Chart Ppt PowerPoint Presentation Visual Aids Inspiration
This is a line chart ppt powerpoint presentation visual aids inspiration. This is a two stage process. The stages in this process are product, profit, growth, decline, success.

Line Chart Ppt PowerPoint Presentation Pictures Example Introduction
This is a line chart ppt powerpoint presentation pictures example introduction. This is a two stage process. The stages in this process are product, profit, business, growth, success.
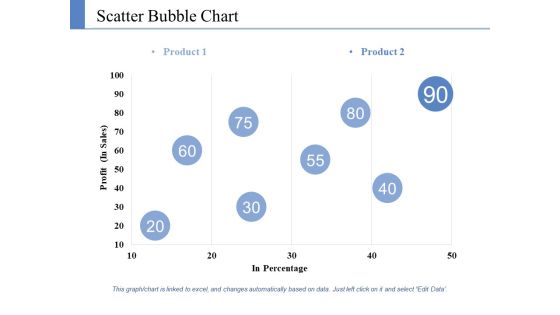
Scatter Bubble Chart Ppt PowerPoint Presentation Styles Information
This is a scatter bubble chart ppt powerpoint presentation styles information. This is a two stage process. The stages in this process are product, profit, in percentage.
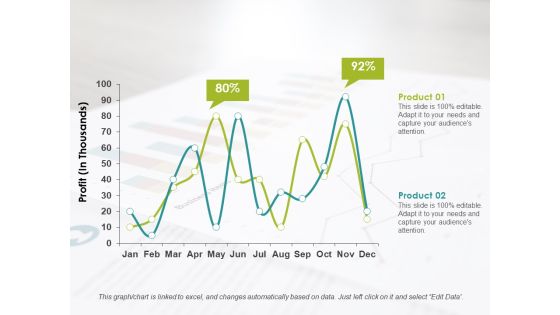
Line Chart Ppt PowerPoint Presentation Infographics Format Ideas
This is a line chart ppt powerpoint presentation infographics format ideas. This is a two stage process. The stages in this process are product, profit, business.

Maturity Stage Ppt PowerPoint Presentation Outline Themes
This is a maturity stage ppt powerpoint presentation outline themes. This is a eight stage process. The stages in this process are sales, costs, profits, marketing objectives, product.
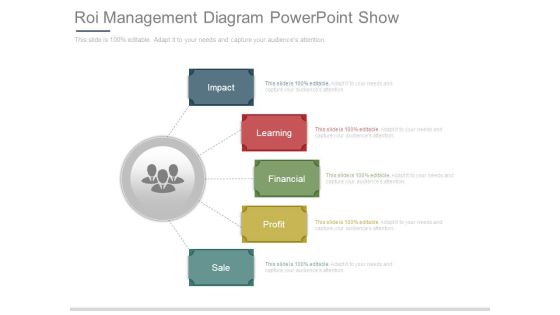
Roi Management Diagram Powerpoint Show
This is a roi management diagram powerpoint show. This is a five stage process. The stages in this process are impact, learning, financial, profit, sale.

Improving Current Organizational Logistic Process Revenue Earned By Our Logistic Company Demonstration PDF
This slide covers the revenue earned by our logistic company in year 2019 and 2018 along with gross profit, return on equity, EPS, etc. Deliver and pitch your topic in the best possible manner with this improving current organizational logistic process revenue earned by our logistic company demonstration pdf. Use them to share invaluable insights on total revenue, gross profit, operating profit, net profit, return on equity and impress your audience. This template can be altered and modified as per your expectations. So, grab it now.

Affirmative Action Program Sample Diagram Powerpoint Shapes
This is a affirmative action program sample diagram powerpoint shapes. This is a five stage process. The stages in this process are profits, benefits, skill, compensation, professional development.
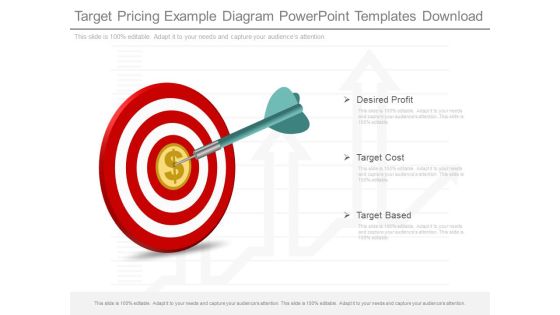
Target Pricing Example Diagram Powerpoint Templates Download
This is a target pricing example diagram powerpoint templates download. This is a three stage process. The stages in this process are desired profit, target cost, target based.

Business Management Tips Diagram Good Ppt Example
This is a business management tips diagram good ppt example. This is a five stage process. The stages in this process are team, business plan, profit, idea, strategy.

International Trading Ppt Diagram Ppt Slides Download
This is a international trading ppt diagram ppt slides download. This is a five stage process. The stages in this process are profit, money, success, strategy, trends.
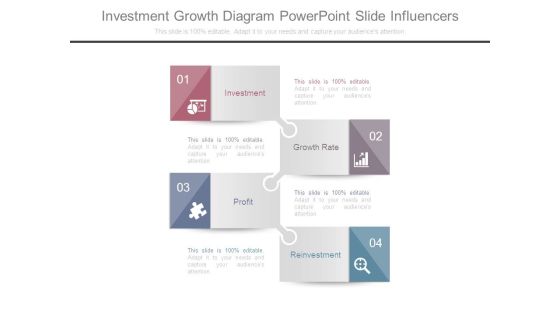
Investment Growth Diagram Powerpoint Slide Influencers
This is a investment growth diagram powerpoint slide influencers. This is a four stage process. The stages in this process are investment, growth rate, profit, reinvestment.
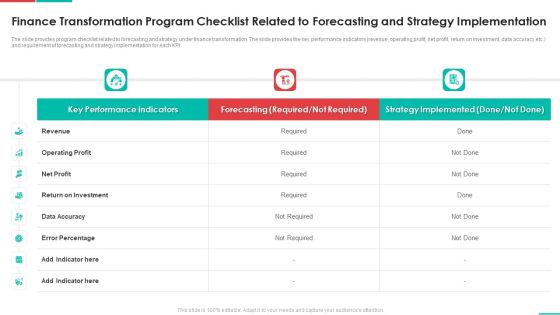
Roadmap For Financial Accounting Transformation Finance Transformation Program Checklist Related Themes PDF
The slide provides program checklist related to forecasting and strategy under finance transformation. The slide provides the key performance indicators revenue, operating profit, net profit, return on investment, data accuracy etc. and requirement of forecasting and strategy implementation for each KPI. Deliver and pitch your topic in the best possible manner with this roadmap for financial accounting transformation finance transformation program checklist related themes pdf. Use them to share invaluable insights on revenue, operating profit, net profit, return on investment, data accuracy and impress your audience. This template can be altered and modified as per your expectations. So, grab it now.

Competitor Comparison Template 2 Ppt PowerPoint Presentation Show Design Ideas
This is a competitor comparison template 2 ppt powerpoint presentation show design ideas. This is a four stage process. The stages in this process are competitor, profit, revenue.

Competitors Analysis Marketing Report Ppt PowerPoint Presentation Tips
This is a competitors analysis marketing report ppt powerpoint presentation tips. This is a five stage process. The stages in this process are competitor, revenue, profit.

Clustered Bar Ppt PowerPoint Presentation Model Slides
This is a clustered bar ppt powerpoint presentation model slides. This is a two stage process. The stages in this process are product, profit, business, finance, percentage.

Clustered Column Ppt PowerPoint Presentation File Guidelines
This is a clustered column ppt powerpoint presentation file guidelines. This is a two stage process. The stages in this process are profit, business, marketing, graph, finance.

Clustered Column Ppt PowerPoint Presentation Pictures Objects
This is a clustered column ppt powerpoint presentation pictures objects. This is a two stage process. The stages in this process are profit, business, marketing, finance graph.
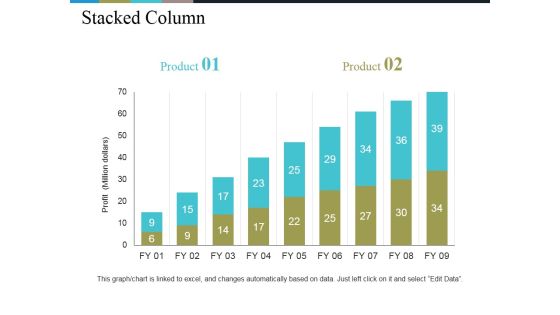
Stacked Column Ppt PowerPoint Presentation Styles File Formats
This is a stacked column ppt powerpoint presentation styles file formats. This is a two stage process. The stages in this process are profit, growth, business, graph, strategy.

Stacked Column Ppt PowerPoint Presentation Outline Information
This is a stacked column ppt powerpoint presentation outline information. This is a two stage process. The stages in this process are profit, product, bar graph, growth, success.

Clustered Column Line Ppt PowerPoint Presentation Layouts Structure
This is a clustered column line ppt powerpoint presentation layouts structure. This is a three stage process. The stages in this process are product, profit, graph, growth, success.

Clustered Bar Ppt PowerPoint Presentation Professional Grid
This is a clustered bar ppt powerpoint presentation professional grid. This is a two stage process. The stages in this process are profit, business, marketing, graph, strategy.

Clustered Bar Ppt PowerPoint Presentation Layouts Layout
This is a clustered bar ppt powerpoint presentation layouts layout. This is a two stage process. The stages in this process are profit, graph, business, marketing, finance.

Stacked Column Ppt PowerPoint Presentation Gallery Slide
This is a stacked column ppt powerpoint presentation gallery slide. This is a two stage process. The stages in this process are profit, business, marketing, growth, strategy.
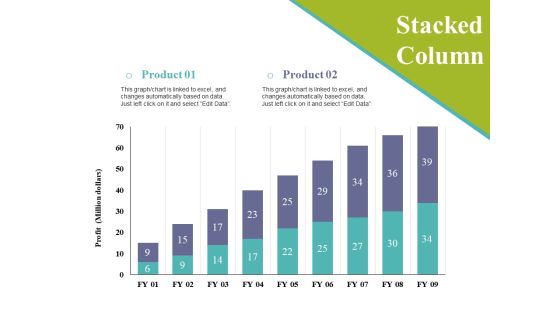
Stacked Column Ppt PowerPoint Presentation Styles Sample
This is a stacked column ppt powerpoint presentation styles sample. This is a two stage process. The stages in this process are profit, business, marketing, growth, graph.

Clustered Column Ppt PowerPoint Presentation Professional Styles
This is a clustered column ppt powerpoint presentation professional styles. This is a two stage process. The stages in this process are product, profit, bar graph, growth, success.

Clustered Bar Ppt PowerPoint Presentation Slides Deck
This is a clustered bar ppt powerpoint presentation slides deck. This is a two stage process. The stages in this process are product, profit, bar graph.

Clustered Column Ppt PowerPoint Presentation Styles Templates
This is a clustered column ppt powerpoint presentation styles templates. This is a two stage process. The stages in this process are product, profit, bar graph.

Clustered Bar Ppt PowerPoint Presentation Slides Graphic Tips
This is a clustered bar ppt powerpoint presentation slides graphic tips. This is a two stage process. The stages in this process are profit, product, clustered bar.
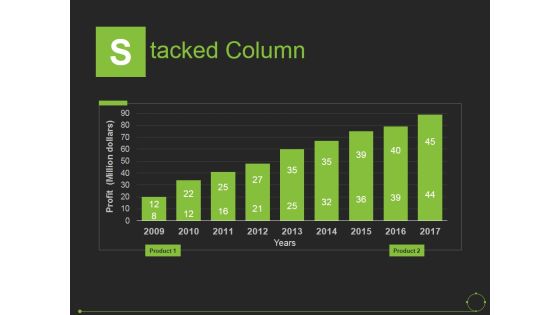
Stacked Column Ppt PowerPoint Presentation Slides Introduction
This is a stacked column ppt powerpoint presentation slides introduction. This is a nine stage process. The stages in this process are years, profit, product, business, marketing.
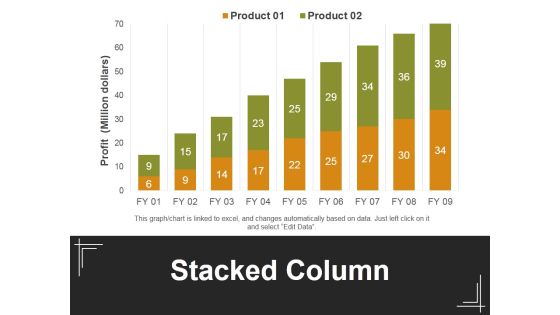
Stacked Column Ppt PowerPoint Presentation Outline Maker
This is a stacked column ppt powerpoint presentation outline maker. This is a two stage process. The stages in this process are profit, stacked bar, product, business, marketing.
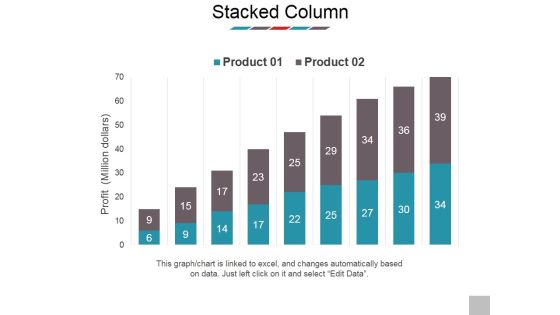
Stacked Column Ppt PowerPoint Presentation Professional Deck
This is a stacked column ppt powerpoint presentation professional deck. This is a two stage process. The stages in this process are profit, business, marketing, presentation, product.

Clustered Bar Ppt PowerPoint Presentation Styles Portfolio
This is a clustered bar ppt powerpoint presentation styles portfolio. This is a two stage process. The stages in this process are product, profit, bar graph, growth, success.

Clustered Column Ppt PowerPoint Presentation Layouts Ideas
This is a clustered column ppt powerpoint presentation layouts ideas. This is a two stage process. The stages in this process are product, profit, bar graph, growth, finance.

Clustered Column Ppt PowerPoint Presentation Show Introduction
This is a clustered column ppt powerpoint presentation show introduction. This is a two stage process. The stages in this process are product, profit, bar graph.

Clustered Bar Ppt PowerPoint Presentation Layouts Professional
This is a clustered bar ppt powerpoint presentation layouts professional. This is a two stage process. The stages in this process are clustered bar, product, profit, percentage.

Financials Summary Comparison Chart Powerpoint Show
This is a financials summary comparison chart powerpoint show. This is a three stage process. The stages in this process are revenue, cost of sales, gross profit, customer acquisition cost, other operating cost expense, operating profit, change in cash, ending cash, employees.

Calculating Customer Lifetime Value Clv Chart Powerpoint Templates
This is a calculating customer lifetime value clv chart powerpoint templates. This is a five stage process. The stages in this process are complete clv year, average acquisition cost, average customer revenue, average customer costs, average customer profit, customer retention rate, cumulative retention rate, likely customer profit, discount rate, clv per year, cumulative clv.

Financials Base Plan Table Chart Ppt Slide Templates
This is a financials base plan table chart ppt slide templates. This is a five stage process. The stages in this process are kpi, revenue, cost of sales, gross profit, customer acquisition cost, other operating cost expense, operating profit, change in cash, ending cash, employees ftes.
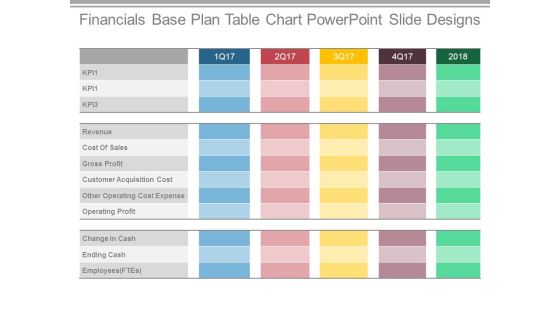
Financials Base Plan Table Chart Powerpoint Slide Designs
This is a financials base plan table chart powerpoint slide designs. This is a five stage process. The stages in this process are revenue, cost of sales, gross profit, customer acquisition cost, other operating cost expense, operating profit, change in cash, ending cash.
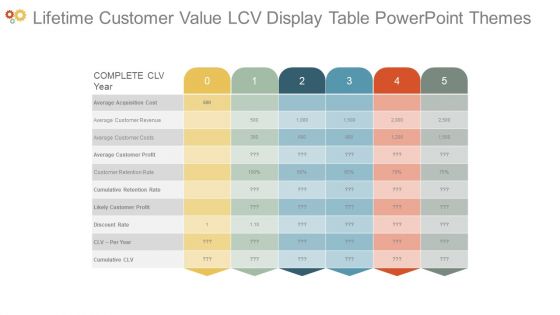
Lifetime Customer Value Lcv Display Table Powerpoint Themes
This is a lifetime customer value lcv display table powerpoint themes. This is a five stage process. The stages in this process are complete clv year, average acquisition cost, average customer revenue, average customer costs, average customer profit, customer retention rate, cumulative retention rate, likely customer profit, discount rate, clv per year, cumulative clv.
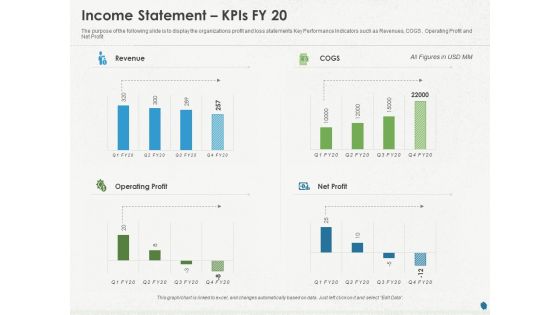
Distressed Debt Refinancing For Organizaton Income Statement Kpis FY 20 Ppt PowerPoint Presentation Model Guide PDF
Presenting this set of slides with name distressed debt refinancing for organizaton income statement kpis fy 20 ppt powerpoint presentation model guide pdf. The topics discussed in these slides are revenue, cogs, operating profit, net profit. This is a completely editable PowerPoint presentation and is available for immediate download. Download now and impress your audience.

Ways To Bounce Back From Insolvency Income Statement Graphical Presentation Slides PDF
Presenting this set of slides with name ways to bounce back from insolvency income statement graphical presentation slides pdf. The topics discussed in these slides are revenue, operating profit, net profit. This is a completely editable PowerPoint presentation and is available for immediate download. Download now and impress your audience.

Issues Which Leads To Insolvency Income Statement Graphical Presentation Download PDF
Presenting this set of slides with name issues which leads to insolvency income statement graphical presentation download pdf. The topics discussed in these slides are revenue, operating profit, net profit. This is a completely editable PowerPoint presentation and is available for immediate download. Download now and impress your audience.
