AI PPT Maker
Templates
PPT Bundles
Design Services
Business PPTs
Business Plan
Management
Strategy
Introduction PPT
Roadmap
Self Introduction
Timelines
Process
Marketing
Agenda
Technology
Medical
Startup Business Plan
Cyber Security
Dashboards
SWOT
Proposals
Education
Pitch Deck
Digital Marketing
KPIs
Project Management
Product Management
Artificial Intelligence
Target Market
Communication
Supply Chain
Google Slides
Research Services
 One Pagers
All Categories
-
Home
- Customer Favorites
- Profit Icon
Profit Icon

Banner Infographic For Sustained Competitive Advantage Powerpoint Template
Create visually amazing presentations with this diagram of four infographic banners. Use this business slide to depict sustained competitive advantages. You may use this slide to share a plan to achieve the desired goals.

3d Interconnected Arrows 7 Stages Ppt How To Create Flow Chart PowerPoint Slides
We present our 3d interconnected arrows 7 stages ppt how to create flow chart PowerPoint Slides. Use our Business PowerPoint Templates because, Marketing Strategy Business Template: - Maximizing sales of your product is the intended destination. Use our Arrows PowerPoint Templates because, you have the ideas to develop the teams vision of where they need to be in the future. Use our Shapes PowerPoint Templates because; unravel the desired and essential elements of your overall strategy. Use our Abstract PowerPoint Templates because, Weak Links & Chains:- Chain reactions and the element of teamwork add value to your efforts. Use our Process and Flows PowerPoint Templates because; enlighten your peers with the help of our topical templates. Use these PowerPoint slides for presentations relating to abstract, age, ancient, antique, arrows, art, artistic, background, colorful, colors, contemporary, decoration, design, dirt, dynamic, edge, element, frame, future, grunge, illustration, linear, lines, modern, pattern, place, pointer, poster, texture, vintage. The prominent colors used in the PowerPoint template are Pink, Gray, and Black
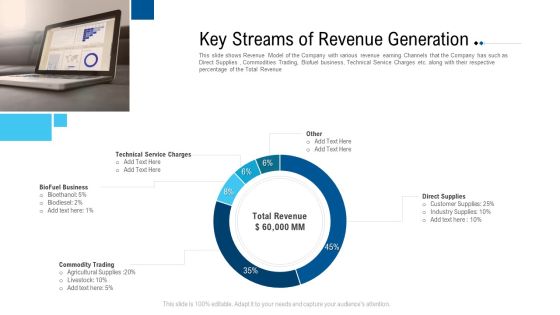
Funding Deck To Raise Grant Funds From Public Organizations Key Streams Of Revenue Generation Ideas PDF
This slide shows Revenue Model of the Company with various revenue earning Channels that the Company has such as Direct Supplies , Commodities Trading, Biofuel business, Technical Service Charges etc. along with their respective percentage of the Total Revenue. Deliver an awe inspiring pitch with this creative funding deck to raise grant funds from public organizations key streams of revenue generation ideas pdf bundle. Topics like technical service charges, revenue, key streams of revenue generation can be discussed with this completely editable template. It is available for immediate download depending on the needs and requirements of the user.

Stock Photo Business Integration Strategy Magical Image Of Pink Castle Images And Graphics
Allow The Forces To Flow With Our stock photo business integration strategy magical image of pink castle images and graphics. Create A Channel For Your Thoughts. Channel Your Thoughts To Your Advantage. Let The Force Flow With Our business.

Stock Photo Develop Business Strategy Computer Folder American Colors Stock Images
Our stock photo develop business strategy computer folder american colors stock images ensure a good footing. Your thoughts begin with an additional advantage. Feel sure footed with our americana. Your thoughts will acquire the correct balance.
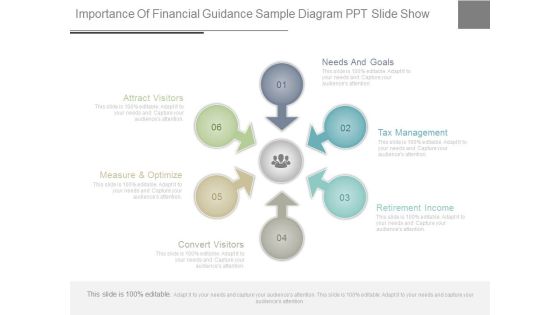
Importance Of Financial Guidance Sample Diagram Ppt Slide Show
This is a importance of financial guidance sample diagram ppt slide show. This is a six stage process. The stages in this process are attract visitors, needs and goals, tax management, retirement income, convert visitors, measure and optimize.

Key Steps For Building Investment Portfolio Sample Diagram Ppt Slides
This is a key steps for building investment portfolio sample diagram ppt slides. This is a eight stage process. The stages in this process are know yourself, rebalancing your portfolio, defensive, cyclical, growth, income, know your investments, diversify portfolio risks.
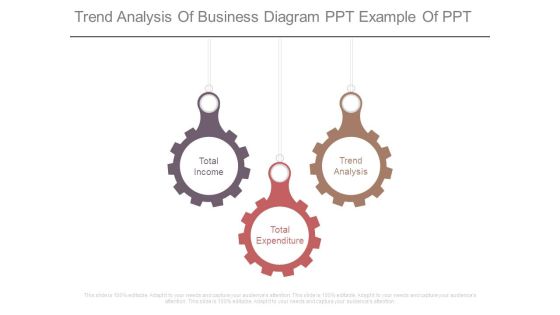
Trend Analysis Of Business Diagram Ppt Example Of Ppt
This is a trend analysis of business diagram ppt example of ppt. This is a three stage process. The stages in this process are total income, total expenditure, trend analysis.
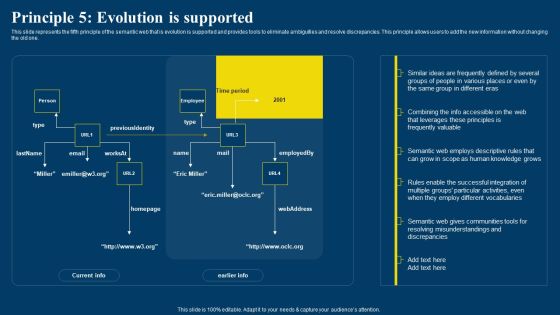
Semantic Web Business Framework Advantages IT Principle 5 Evolution Is Supported Diagrams PDF
This slide represents the fifth principle of the semantic web that is evolution is supported and provides tools to eliminate ambiguities and resolve discrepancies. This principle allows users to add the new information without changing the old one. Do you know about Slidesgeeks Semantic Web Business Framework Advantages IT Principle 5 Evolution Is Supported Diagrams PDF These are perfect for delivering any kind od presentation. Using it, create PowerPoint presentations that communicate your ideas and engage audiences. Save time and effort by using our pre-designed presentation templates that are perfect for a wide range of topic. Our vast selection of designs covers a range of styles, from creative to business, and are all highly customizable and easy to edit. Download as a PowerPoint template or use them as Google Slides themes.
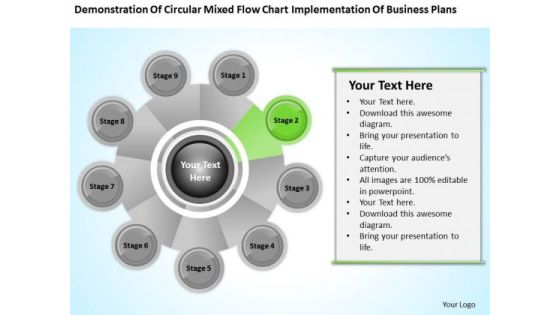
Business Process Flow Diagram Chart Implementation Plans Ppt PowerPoint Slides
We present our business process flow diagram chart implementation plans ppt PowerPoint Slides.Present our Process and Flows PowerPoint Templates because You can Double your output with our PowerPoint Templates and Slides. They make beating deadlines a piece of cake. Download our Circle Charts PowerPoint Templates because Our PowerPoint Templates and Slides will provide you a launch platform. Give a lift off to your ideas and send them into orbit. Use our Flow Chart PowerPoint Templates because It is Aesthetically crafted by artistic young minds. Our PowerPoint Templates and Slides are designed to display your dexterity. Present our Business PowerPoint Templates because Our PowerPoint Templates and Slides will let you Leave a lasting impression to your audiences. They possess an inherent longstanding recall factor. Use our Shapes PowerPoint Templates because Our PowerPoint Templates and Slides offer you the widest possible range of options.Use these PowerPoint slides for presentations relating to Chart, flow, vector, flowchart, circular, position, diagram elements, segment, diagram vector, business, concept, sign, diagram chart, presentation, diagram, circle, graphic, description, element, shape, cycle, circulation, illustration, diagram circle, business, section, web, direction, design, color, text , brainstorm, background, fresh, present. The prominent colors used in the PowerPoint template are Green, Gray, Black.
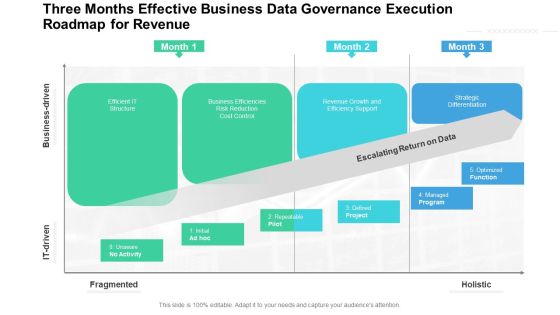
Three Months Effective Business Data Governance Execution Roadmap For Revenue Themes
We present our three months effective business data governance execution roadmap for revenue themes. This PowerPoint layout is easy to edit so you can change the font size, font type, color, and shape conveniently. In addition to this, the PowerPoint layout is Google Slides compatible, so you can share it with your audience and give them access to edit it. Therefore, download and save this well researched three months effective business data governance execution roadmap for revenue themes in different formats like PDF, PNG, and JPG to smoothly execute your business plan.

Sipoc Process Infogarphic Chart Powerpoint Slide Influencers
This is a sipoc process infogarphic chart powerpoint slide influencers. This is a five stage process. The stages in this process are suppliers, input, process, output, customer, start, finish, sipoc.

Post Implementation Other Operation And Financial Kpis Summary PDF
The slide provides five years graphs 2022F to 2026F forecasted number of major KPIs key performance indicators, that might help to track the performance of ABC Railway. Covered KPIs include Revenue, Total Passengers, operating income, customer satisfaction rate etc.Deliver and pitch your topic in the best possible manner with this post implementation other operation and financial KPIs summary pdf. Use them to share invaluable insights on total passengers, operating income, revenue, 2022 to 2026 and impress your audience. This template can be altered and modified as per your expectations. So, grab it now.

Drug Indicator Extension In A Pharmaceuticals Company Financial Results Of SW Care Company After Implementing Strategies Designs PDF
This slide shows the Financial Results of SW Care Company after implementing Strategies in terms of increasing Net Income and Revenue over the coming years. Deliver and pitch your topic in the best possible manner with this drug indicator extension in a pharmaceuticals company financial results of sw care company after implementing strategies designs pdf. Use them to share invaluable insights on revenue, net income and impress your audience. This template can be altered and modified as per your expectations. So, grab it now.
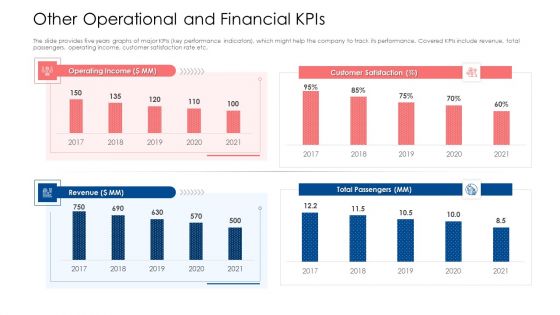
Building Brand Image Of A Railway Firm Other Operational And Financial Kpis Structure PDF
The slide provides five years graphs of major KPIs key performance indicators, which might help the company to track its performance. Covered KPIs include revenue, total passengers, operating income, customer satisfaction rate etc. Deliver and pitch your topic in the best possible manner with this building brand image of a railway firm other operational and financial kpis structure pdf. Use them to share invaluable insights on operating income, customer satisfaction, revenue and impress your audience. This template can be altered and modified as per your expectations. So, grab it now.

Post Implementation Other Operation And Financial Kpis Ppt Infographic Template PDF
The slide provides five years graphs 2020F-2024F forecasted number of major KPIs key performance indicators, that might help to track the performance of ABC Railway. Covered KPIs include Revenue, Total Passengers, operating income, customer satisfaction rate etc. Deliver an awe inspiring pitch with this creative post implementation other operation and financial kpis ppt infographic template pdf bundle. Topics like operating income, revenue, customer satisfaction can be discussed with this completely editable template. It is available for immediate download depending on the needs and requirements of the user.

Post Implementation Other Operation And Financial Kpis Inspiration PDF
The slide provides five years graphs 2022F-2026F forecasted number of major KPIs key performance indicators, that might help to track the performance of ABC Railway. Covered KPIs include Revenue, Total Passengers, operating income, customer satisfaction rate etc. Deliver and pitch your topic in the best possible manner with this post implementation other operation and financial kpis inspiration pdf. Use them to share invaluable insights on revenue, operating income, customer satisfaction and impress your audience. This template can be altered and modified as per your expectations. So, grab it now.

Business Cashflow Predictive For Operating Financial And Investing Activities Ppt Inspiration Infographic Template PDF
The following slide highlights the business cashflow forecast with for operating financial and investing activities illustrating key headings which includes key headings which includes cashflow statement, revenue, net income, free cash flow and cash balance. Pitch your topic with ease and precision using this business cashflow predictive for operating financial and investing activities ppt inspiration infographic template pdf. This layout presents information on revenue, net income, free cash flow, cash balance, 2020 to 2024. It is also available for immediate download and adjustment. So, changes can be made in the color, design, graphics or any other component to create a unique layout.
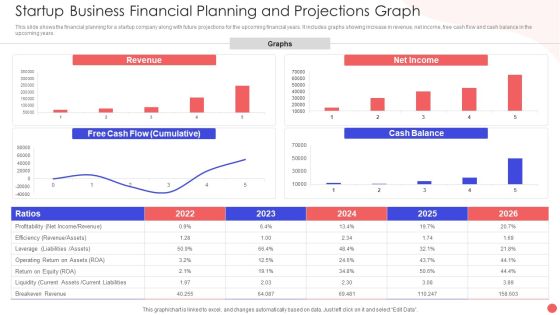
Startup Business Financial Planning And Projections Graph Slides PDF
This slide shows the financial planning for a startup company along with future projections for the upcoming financial years. It includes graphs showing increase in revenue, net income, free cash flow and cash balance in the upcoming years. Pitch your topic with ease and precision using this Startup Business Financial Planning And Projections Graph Slides PDF. This layout presents information on Revenue Graphs Operating, Free Cash Flow, Net Income Ration. It is also available for immediate download and adjustment. So, changes can be made in the color, design, graphics or any other component to create a unique layout.
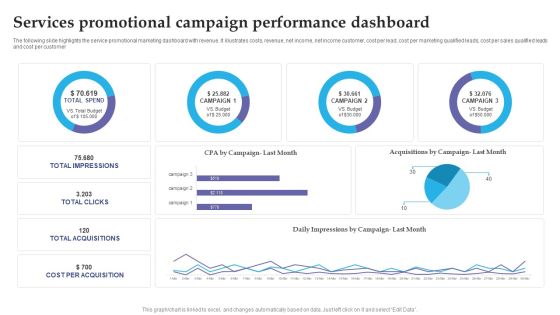
Services Promotional Campaign Performance Dashboard Slides PDF
The following slide highlights the service promotional marketing dashboard with revenue. It illustrates costs, revenue, net income, net income customer, cost per lead, cost per marketing qualified leads, cost per sales qualified leads and cost per customer. Pitch your topic with ease and precision using this Services Promotional Campaign Performance Dashboard Slides PDF. This layout presents information on Services Promotional, Campaign Performance Dashboard. It is also available for immediate download and adjustment. So, changes can be made in the color, design, graphics or any other component to create a unique layout.

PowerPoint Template Process Circular Arrow Ppt Theme
The Circle of Life - a concept emmbedded in our minds and hence easy to comprehend. Life and Business is made up of processes comprising stages that flow from one to another. An excellent graphic to attract the attention of and understanding by your audience to improve earnings.

PowerPoint Templates Company Circular Arrow Ppt Themes
The Circle of Life - a concept emmbedded in our minds and hence easy to comprehend. Life and Business is made up of processes comprising stages that flow from one to another. An excellent graphic to attract the attention of and understanding by your audience to improve earnings.

3 Stages Marketing Plans Venn Diagram Ppt Develop Business PowerPoint Templates
We present our 3 stages marketing plans venn diagram ppt develop business PowerPoint templates.Present our Venn Diagrams PowerPoint Templates because You can Create a matrix with our PowerPoint Templates and Slides. Feel the strength of your ideas click into place. Use our Process and Flows PowerPoint Templates because You should Bet on your luck with our PowerPoint Templates and Slides. Be assured that you will hit the jackpot. Use our Flow Charts PowerPoint Templates because You can Connect the dots. Fan expectations as the whole picture emerges. Download and present our Marketing PowerPoint Templates because You can Double your output with our PowerPoint Templates and Slides. They make beating deadlines a piece of cake. Present our Shapes PowerPoint Templates because Our PowerPoint Templates and Slides will bullet point your ideas. See them fall into place one by one.Use these PowerPoint slides for presentations relating to Project, integrate, integrating, plan, concept, product, vision, components, circles, venn, product,management, business, elements, diagram, process,workflow, goal, overlapping, marketing, word, management, manage, lifecycle, intersect, method, company, venndiagram, overlap,intersecting, information, background, principle, industry, conceptual, square, initiative, communicate, communication. The prominent colors used in the PowerPoint template are Blue light, White, Black.
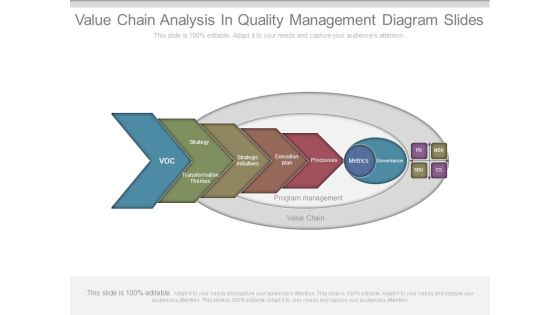
Value Chain Analysis In Quality Management Diagram Slides
This is a value chain analysis in quality management diagram slides. This is a five stage process. The stages in this process are voc, strategy, themes, transformation, strategic initiatives, execution plan, processes, metrics, governance, program management, value chain, pd, mbu, sbu, cs.
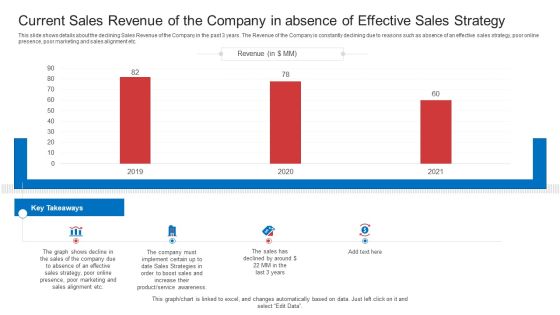
Strategic Plan To Increase Sales Volume And Revenue Current Sales Revenue Of The Company In Absence Of Effective Sales Strategy Diagrams PDF
This slide shows details about the declining Sales Revenue of the Company in the past 3 years. The Revenue of the Company is constantly declining due to reasons such as absence of an effective sales strategy, poor online presence, poor marketing and sales alignment etc. Deliver and pitch your topic in the best possible manner with this strategic plan to increase sales volume and revenue current sales revenue of the company in absence of effective sales strategy diagrams pdf. Use them to share invaluable insights on marketing, sales, strategy, effective, awareness and impress your audience. This template can be altered and modified as per your expectations. So, grab it now.
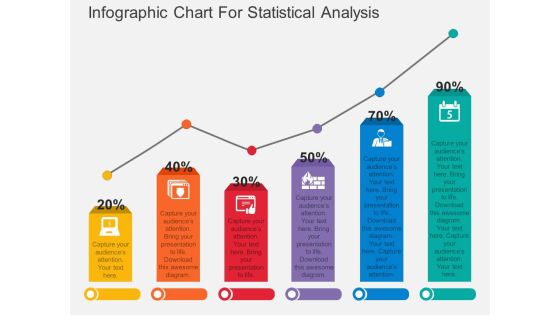
Infographic Chart For Statistical Analysis Powerpoint Template
Download this exclusive business diagram to display statistical analysis. This PowerPoint template contains bar chart with percentage values. This diagram is useful for business presentations.
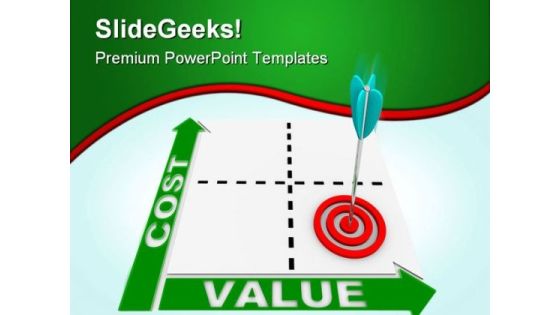
Cost Value Business PowerPoint Themes And PowerPoint Slides 0411
Microsoft PowerPoint Theme and Slide with a cost-value matrix with arrow and target

PPM Private Equity Key Streams Of Revenue Generation Ppt PowerPoint Presentation Infographic Template Show PDF
This slide shows Revenue Model of the Company with various revenue earning Channels that the Company has such as Online Stores, Product Sales, Subscription Fees etc. along with their respective percentage of the Total Revenue. Deliver an awe-inspiring pitch with this creative ppm private equity key streams of revenue generation ppt powerpoint presentation infographic template show pdf bundle. Topics like subscription fee technology, digital service, product sale, online sale, total revenue can be discussed with this completely editable template. It is available for immediate download depending on the needs and requirements of the user.

Funding Deck To Procure Funds From Public Enterprises Key Streams Of Revenue Generation Elements PDF
This slide shows Revenue Model of the Company with various revenue earning Channels that the Company has such as Direct Supplies , Commodities Trading, Biofuel business, Technical Service Charges etc. along with their respective percentage of the Total Revenue. Deliver and pitch your topic in the best possible manner with this funding deck to procure funds from public enterprises key streams of revenue generation elements pdf. Use them to share invaluable insights on technical service charges, biofuel business, commodity trading, direct supplies, total revenue and impress your audience. This template can be altered and modified as per your expectations. So, grab it now.

PowerPoint Slides Chart Process Chart Ppt Template
PowerPoint Slides Chart process chart PPT Template-The Circle of Life - a concept emmbedded in our minds and hence easy to comprehend. Life and Business is made up of processes comprising stages that flow from one to another. An excellent graphic to attract the attention of and understanding by your audience to improve earnings.-These amazing PowerPoint pre-designed slides and PowerPoint templates have been carefully created by our team of experts to help you impress your audience. Our stunning collection of Powerpoint slides are 100% editable and can easily fit in any PowerPoint presentations. By using these animations and graphics in PowerPoint and you can easily make professional presentations. Any text can be entered at any point in the PowerPoint template or slide. Just DOWNLOAD our awesome PowerPoint templates and you are ready to go.

PowerPoint Process Chart Process Chart Ppt Design
PowerPoint Process Chart Process Chart PPT Design Power Point templates-The Circle of Life - a concept emmbedded in our minds and hence easy to comprehend. Life and Business is made up of processes comprising stages that flow from one to another. An excellent graphic to attract the attention of and understanding by your audience to improve earnings.-These amazing PowerPoint pre-designed slides and PowerPoint templates have been carefully created by our team of experts to help you impress your audience. Our stunning collection of Powerpoint slides are 100% editable and can easily fit in any PowerPoint presentations. By using these animations and graphics in PowerPoint and you can easily make professional presentations. Any text can be entered at any point in the PowerPoint template or slide. Just DOWNLOAD our awesome PowerPoint templates and you are ready to go.

Business Sales And Revenue Summary Dashboard Brochure PDF
This slide exhibits sales report dashboards that provides information of sales activities and performance in financial year. It includes elements such as average weekly sales revenue, customer acquisition cost, customer lifetime value and sales target. Pitch your topic with ease and precision using this Business Sales And Revenue Summary Dashboard Brochure PDF. This layout presents information on Average Revenue, Customer Lifetime, Customer Acquisition. It is also available for immediate download and adjustment. So, changes can be made in the color, design, graphics or any other component to create a unique layout.
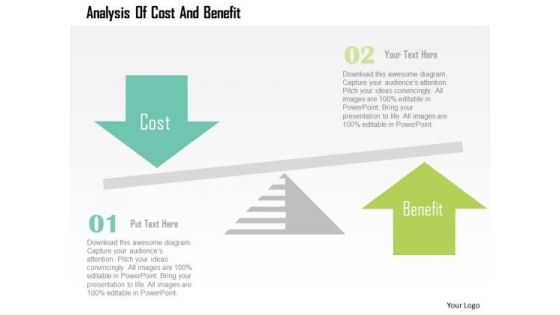
Business Diagram Analysis Of Cost And Benefit Presentation Template
This business diagram contains graphics of balancing scale with arrows of cost and benefit. You may use this diagram for analysis of cost and benefit. Communicate effectively with your group through this slide.

PowerPoint Design Cycle Process Chart Ppt Template
PowerPoint Design Cycle Process Chart PPT Template- Life and Business is made up of processes comprising stages that flow from one to another. An excellent graphic to attract the attention of and understanding by your audience to improve earnings.-PowerPoint Design Cycle Process Chart PPT Template-Background, Business, Chart, Circle, Circular, Marketing, Management, Flow, Graph, Process, Round, Segmented, Sequence, Wheel, Diagram, Division, Continuity, Template, Web, Illustration

Cross Sell In Banking Industry Targeting The Revenue Generating Segment Ppt Layouts Information PDF
This is a cross sell in banking industry targeting the revenue generating segment ppt layouts information pdf template with various stages. Focus and dispense information on four stages using this creative set, that comes with editable features. It contains large content boxes to add your information on topics like digital stars, pros, financial stars, traditionalists. You can also showcase facts, figures, and other relevant content using this PPT layout. Grab it now.

Cross Selling Of Retail Banking Products Targeting The Revenue Generating Segment Ppt Templates PDF
This is a cross selling of retail banking products targeting the revenue generating segment ppt templates pdf template with various stages. Focus and dispense information on four stages using this creative set, that comes with editable features. It contains large content boxes to add your information on topics like digital stars, pros, financial stars, traditionalists. You can also showcase facts, figures, and other relevant content using this PPT layout. Grab it now.

PowerPoint Slidelayout Process Double Ring Ppt Theme
PowerPoint Slidelayout Process Double Ring PPT Theme-The Circle of Life - a concept emmbedded in our minds and hence easy to comprehend. Life and Business is made up of processes comprising stages that flow from one to another. An excellent graphic to attract the attention of and understanding by your audience to improve earnings.-These amazing PowerPoint pre-designed slides and PowerPoint templates have been carefully created by our team of experts to help you impress your audience. Our stunning collection of Powerpoint slides are 100% editable and can easily fit in any PowerPoint presentations. By using these animations and graphics in PowerPoint and you can easily make professional presentations. Any text can be entered at any point in the PowerPoint template or slide. Just DOWNLOAD our awesome PowerPoint templates and you are ready to go.
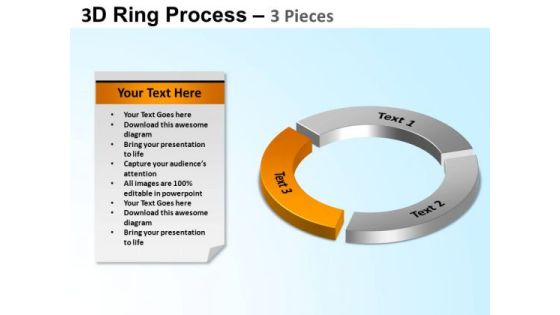
PowerPoint Themes Global Ring Process Ppt Slide
PowerPoint Themes Global ring process PPT Slide-The Circle of Life - a concept emmbedded in our minds and hence easy to comprehend. Life and Business is made up of processes comprising stages that flow from one to another. An excellent graphic to attract the attention of and understanding by your audience to improve earnings.-These amazing PowerPoint pre-designed slides and PowerPoint templates have been carefully created by our team of experts to help you impress your audience. Our stunning collection of Powerpoint slides are 100% editable and can easily fit in any PowerPoint presentations. By using these animations and graphics in PowerPoint and you can easily make professional presentations. Any text can be entered at any point in the PowerPoint template or slide. Just DOWNLOAD our awesome PowerPoint templates and you are ready to go.

Fund Management For Financial Growth Sample Diagram Ppt Diagrams
This is a fund management for financial growth sample diagram ppt diagrams. This is a five stage process. The stages in this process are funds directory, sharia compliant funds, hybrid funds, equity funds, fixed income funds, gilt edged fund, corporate debt fund, gilt edged and corporate debt fund, listed equity fund, growth dividend fund, index fund, fis and equity fund.
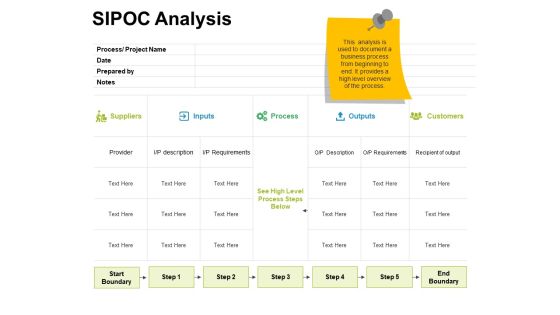
Sipoc Analysis Ppt PowerPoint Presentation Layouts Themes
This is a sipoc analysis ppt powerpoint presentation layouts themes. This is a five stage process. The stages in this process are suppliers, inputs, process, outputs, customers.
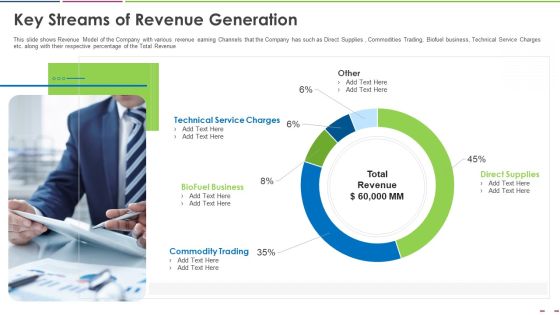
Investor Deck To Increase Grant Funds From Public Corporation Key Streams Of Revenue Generation Guidelines PDF
This slide shows Revenue Model of the Company with various revenue earning Channels that the Company has such as Direct Supplies , Commodities Trading, Biofuel business, Technical Service Charges etc. along with their respective percentage of the Total Revenue. Deliver an awe-inspiring pitch with this creative investor deck to increase grant funds from public corporation key streams of revenue generation guidelines pdf. bundle. Topics like technical service charges, biofuel business, commodity trading, direct supplies can be discussed with this completely editable template. It is available for immediate download depending on the needs and requirements of the user.

Funding Deck To Obtain Grant Facilities From Public Companies Key Streams Of Revenue Generation Graphics PDF
This slide shows Revenue Model of the Company with various revenue earning Channels that the Company has such as Direct Supplies , Commodities Trading, Biofuel business, Technical Service Charges etc. along with their respective percentage of the Total Revenue. Deliver an awe inspiring pitch with this creative funding deck to obtain grant facilities from public companies key streams of revenue generation graphics pdf bundle. Topics like technical service charges, bio fuel business, commodity trading, direct supplies can be discussed with this completely editable template. It is available for immediate download depending on the needs and requirements of the user.

6 Year Revenue Declining Graph Ppt PowerPoint Presentation Outline Sample PDF
This slide shows the revenues of the company over the last years to have a clear idea of organization growth and financial status . It includes the 6 year 2017 to 2022 revenue earned by the company.Showcasing this set of slides titled 6 Year Revenue Declining Graph Ppt PowerPoint Presentation Outline Sample PDF. The topics addressed in these templates are Revenue Company, Highest Comparison, Conditions Restrictions. All the content presented in this PPT design is completely editable. Download it and make adjustments in color, background, font etc. as per your unique business setting.

Landing Page Leads And Revenue Generation Analytics For User Experience Optimization Dashboard Formats PDF
This slide covers website analytics based on revenue earned. It also included leads generated, bounce rates, customer churn stats, annual and monthly recurring revenue, etc. Pitch your topic with ease and precision using this Landing Page Leads And Revenue Generation Analytics For User Experience Optimization Dashboard Formats PDF. This layout presents information on Monthly Recurring Revenue, Bounce Rate, Gross Volume. It is also available for immediate download and adjustment. So, changes can be made in the color, design, graphics or any other component to create a unique layout.

Business Revenue Bar Graph With Business Operational Expenditure Details Summary PDF
This slide represents business revenue bar graph with OPEX details which can be referred by companies to earn more revenue by controlling expenditures. It also provides information about marketing and sales, research and development, administration, total revenue, etc. Pitch your topic with ease and precision using this Business Revenue Bar Graph With Business Operational Expenditure Details Summary PDF. This layout presents information on Cost Of Marketing, Sales, Highest Amount. It is also available for immediate download and adjustment. So, changes can be made in the color, design, graphics or any other component to create a unique layout.

Analyzing The Impact Of Russia Ukraine Conflict On Agriculture Sector Ukraines Share Of Grains Pictures PDF
This slide covers the impact of war on Ukraines agricultural exports. It includes percentage of wheat and corn still to be exported, lower yields impacting next seasons output, and are not all areas will be harvested during the forthcoming season if war continues. Deliver and pitch your topic in the best possible manner with this analyzing the impact of russia ukraine conflict on agriculture sector ukraines share of grains pictures pdf Use them to share invaluable insights on ukraines share of grains still to be exported and impress your audience. This template can be altered and modified as per your expectations. So, grab it now.
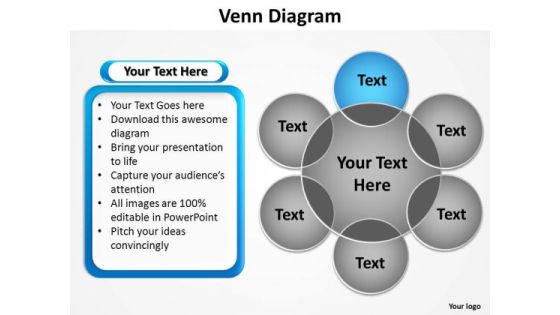
PowerPoint Layouts Download Venn Diagram Ppt Template
PowerPoint Layouts Download Venn Diagram PPT Template Business Power Points-The Venn graphic comprising interlinking circles geometrically demonstrate how various functions operating independently, to a large extent, are essentially interdependent. Amplify on this basic corporate concept and forefront the benefits of overlapping processes to arrive at common goals.-These amazing PowerPoint pre-designed slides and PowerPoint templates have been carefully created by our team of experts to help you impress your audience. Our stunning collection of Powerpoint slides are 100% editable and can easily fit in any PowerPoint presentations. By using these animations and graphics in PowerPoint and you can easily make professional presentations. Any text can be entered at any point in the PowerPoint template or slide. Just DOWNLOAD our awesome PowerPoint templates and you are ready to go.
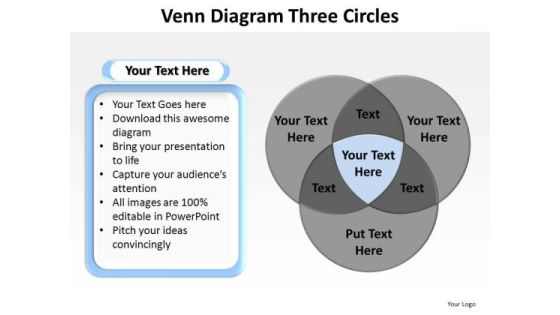
PowerPoint Presentation Company Venn Diagram Ppt Presentation
PowerPoint Presentation Company Venn Diagram PPT Presentation Business Power Points-The Venn graphic comprising interlinking circles geometrically demonstrate how various functions operating independently, to a large extent, are essentially interdependent. Amplify on this basic corporate concept and forefront the benefits of overlapping processes to arrive at common goals.-These amazing PowerPoint pre-designed slides and PowerPoint templates have been carefully created by our team of experts to help you impress your audience. Our stunning collection of Powerpoint slides are 100% editable and can easily fit in any PowerPoint presentations. By using these animations and graphics in PowerPoint and you can easily make professional presentations. Any text can be entered at any point in the PowerPoint template or slide. Just DOWNLOAD our awesome PowerPoint templates and you are ready to go.

PowerPoint Presentation Editable Venn Diagram Ppt Presentation
PowerPoint Presentation Editable Venn Diagram PPT Presentation Business Power Points-The Venn graphic comprising interlinking circles geometrically demonstrate how various functions operating independently, to a large extent, are essentially interdependent. Amplify on this basic corporate concept and forefront the benefits of overlapping processes to arrive at common goals.-These amazing PowerPoint pre-designed slides and PowerPoint templates have been carefully created by our team of experts to help you impress your audience. Our stunning collection of Powerpoint slides are 100% editable and can easily fit in any PowerPoint presentations. By using these animations and graphics in PowerPoint and you can easily make professional presentations. Any text can be entered at any point in the PowerPoint template or slide. Just DOWNLOAD our awesome PowerPoint templates and you are ready to go.
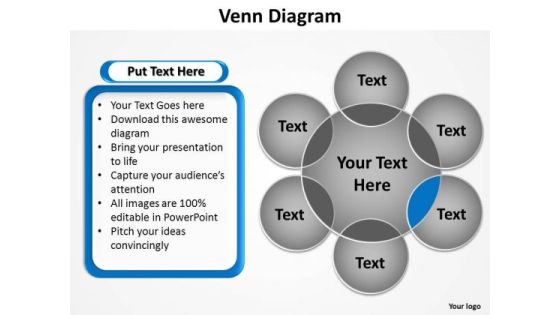
PowerPoint Presentation Image Venn Diagram Ppt Slide
PowerPoint Presentation Image Venn Diagram PPT Slide Business Power Points-The Venn graphic comprising interlinking circles geometrically demonstrate how various functions operating independently, to a large extent, are essentially interdependent. Amplify on this basic corporate concept and forefront the benefits of overlapping processes to arrive at common goals.-These amazing PowerPoint pre-designed slides and PowerPoint templates have been carefully created by our team of experts to help you impress your audience. Our stunning collection of Powerpoint slides are 100% editable and can easily fit in any PowerPoint presentations. By using these animations and graphics in PowerPoint and you can easily make professional presentations. Any text can be entered at any point in the PowerPoint template or slide. Just DOWNLOAD our awesome PowerPoint templates and you are ready to go.
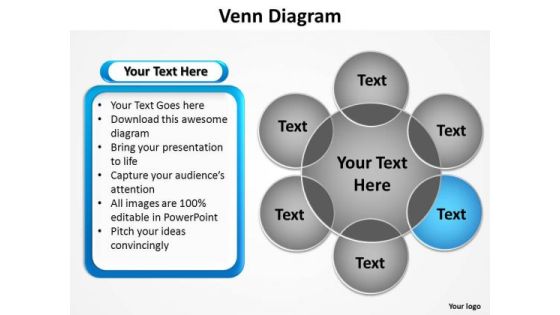
PowerPoint Presentation Sales Venn Diagram Ppt Presentation
PowerPoint Presentation Sales Venn Diagram PPT Presentation Business Power Points-The Venn graphic comprising interlinking circles geometrically demonstrate how various functions operating independently, to a large extent, are essentially interdependent. Amplify on this basic corporate concept and forefront the benefits of overlapping processes to arrive at common goals.-These amazing PowerPoint pre-designed slides and PowerPoint templates have been carefully created by our team of experts to help you impress your audience. Our stunning collection of Powerpoint slides are 100% editable and can easily fit in any PowerPoint presentations. By using these animations and graphics in PowerPoint and you can easily make professional presentations. Any text can be entered at any point in the PowerPoint template or slide. Just DOWNLOAD our awesome PowerPoint templates and you are ready to go.
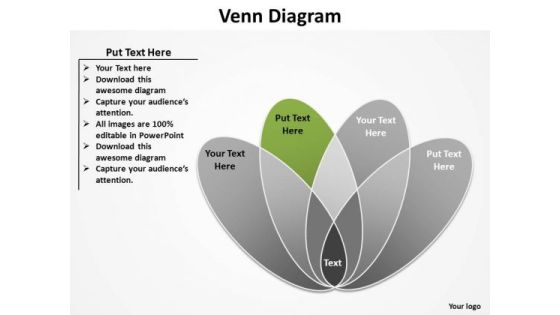
PowerPoint Process Sales Venn Diagram Ppt Slides
PowerPoint Process Sales Venn Diagram PPT Slides Business Power Points-The Venn graphic comprising interlinking circles geometrically demonstrate how various functions operating independently, to a large extent, are essentially interdependent. Amplify on this basic corporate concept and forefront the benefits of overlapping processes to arrive at common goals.-These amazing PowerPoint pre-designed slides and PowerPoint templates have been carefully created by our team of experts to help you impress your audience. Our stunning collection of Powerpoint slides are 100% editable and can easily fit in any PowerPoint presentations. By using these animations and graphics in PowerPoint and you can easily make professional presentations. Any text can be entered at any point in the PowerPoint template or slide. Just DOWNLOAD our awesome PowerPoint templates and you are ready to go.
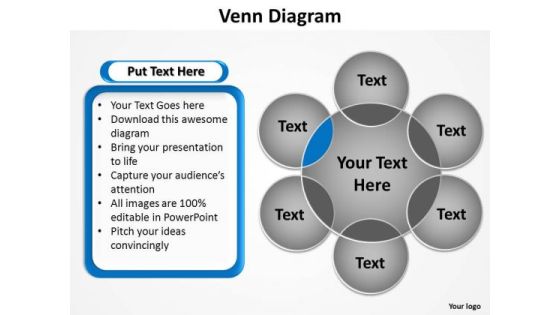
PowerPoint Process Success Venn Diagram Ppt Design
PowerPoint Process Success Venn Diagram PPT Design Business Power Points-The Venn graphic comprising interlinking circles geometrically demonstrate how various functions operating independently, to a large extent, are essentially interdependent. Amplify on this basic corporate concept and forefront the benefits of overlapping processes to arrive at common goals.-These amazing PowerPoint pre-designed slides and PowerPoint templates have been carefully created by our team of experts to help you impress your audience. Our stunning collection of Powerpoint slides are 100% editable and can easily fit in any PowerPoint presentations. By using these animations and graphics in PowerPoint and you can easily make professional presentations. Any text can be entered at any point in the PowerPoint template or slide. Just DOWNLOAD our awesome PowerPoint templates and you are ready to go.

3 Months Action Plan Advantage Roadmap For Employing Business Intelligence Mockup
Presenting our innovatively structured 3 months action plan advantage roadmap for employing business intelligence mockup Template. Showcase your roadmap process in different formats like PDF, PNG, and JPG by clicking the download button below. This PPT design is available in both Standard Screen and Widescreen aspect ratios. It can also be easily personalized and presented with modified font size, font type, color, and shapes to measure your progress in a clear way.

3 Months Advantage Action Plan Roadmap For Lead Generation Activities Rules
Introducing our 3 months advantage action plan roadmap for lead generation activities rules. This PPT presentation is Google Slides compatible, therefore, you can share it easily with the collaborators for measuring the progress. Also, the presentation is available in both standard screen and widescreen aspect ratios. So edit the template design by modifying the font size, font type, color, and shapes as per your requirements. As this PPT design is fully editable it can be presented in PDF, JPG and PNG formats.

5 Year Action Plan And Advantage Roadmap For Employing Business Intelligence Guidelines
Presenting our innovatively structured 5 year action plan and advantage roadmap for employing business intelligence guidelines Template. Showcase your roadmap process in different formats like PDF, PNG, and JPG by clicking the download button below. This PPT design is available in both Standard Screen and Widescreen aspect ratios. It can also be easily personalized and presented with modified font size, font type, color, and shapes to measure your progress in a clear way.

5 Year Advantage Action Plan Roadmap For Lead Generation Activities Infographics
Introducing our 5 year advantage action plan roadmap for lead generation activities infographics. This PPT presentation is Google Slides compatible, therefore, you can share it easily with the collaborators for measuring the progress. Also, the presentation is available in both standard screen and widescreen aspect ratios. So edit the template design by modifying the font size, font type, color, and shapes as per your requirements. As this PPT design is fully editable it can be presented in PDF, JPG and PNG formats.

6 Months Action Plan Advantage Roadmap For Employing Business Intelligence Mockup
Presenting our innovatively structured 6 months action plan advantage roadmap for employing business intelligence mockup Template. Showcase your roadmap process in different formats like PDF, PNG, and JPG by clicking the download button below. This PPT design is available in both Standard Screen and Widescreen aspect ratios. It can also be easily personalized and presented with modified font size, font type, color, and shapes to measure your progress in a clear way.

6 Months Advantage Action Plan Roadmap For Lead Generation Activities Mockup
Introducing our 6 months advantage action plan roadmap for lead generation activities mockup. This PPT presentation is Google Slides compatible, therefore, you can share it easily with the collaborators for measuring the progress. Also, the presentation is available in both standard screen and widescreen aspect ratios. So edit the template design by modifying the font size, font type, color, and shapes as per your requirements. As this PPT design is fully editable it can be presented in PDF, JPG and PNG formats.
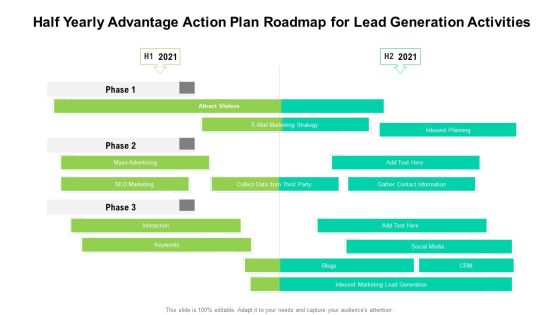
Half Yearly Advantage Action Plan Roadmap For Lead Generation Activities Clipart
Introducing our half yearly advantage action plan roadmap for lead generation activities clipart. This PPT presentation is Google Slides compatible, therefore, you can share it easily with the collaborators for measuring the progress. Also, the presentation is available in both standard screen and widescreen aspect ratios. So edit the template design by modifying the font size, font type, color, and shapes as per your requirements. As this PPT design is fully editable it can be presented in PDF, JPG and PNG formats.
