Profit And Loss Dashboard
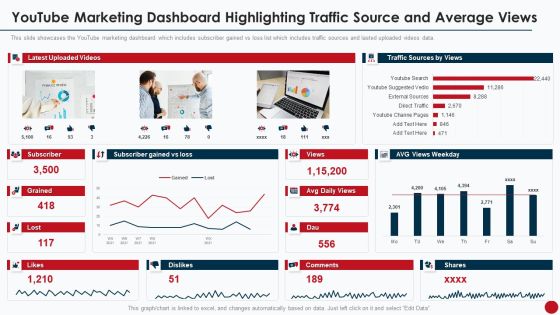
Marketing Manual For Product Promotion On Youtube Channel Youtube Marketing Dashboard Highlighting Traffic Professional PDF
This slide showcases the YouTube marketing dashboard which includes subscriber gained vs loss list which includes traffic sources and lasted uploaded videos data.Deliver an awe inspiring pitch with this creative Marketing Manual For Product Promotion On Youtube Channel Youtube Marketing Dashboard Highlighting Traffic Professional PDF bundle. Topics like Direct Traffic, External Sources, Suggested Video can be discussed with this completely editable template. It is available for immediate download depending on the needs and requirements of the user.
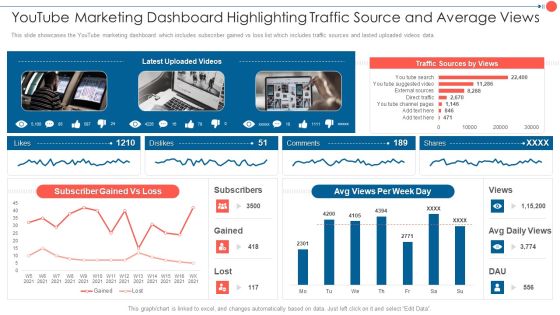
Youtube Advertising Techniques Youtube Marketing Dashboard Highlighting Traffic Source Summary PDF
This slide showcases the YouTube marketing dashboard which includes subscriber gained vs loss list which includes traffic sources and lasted uploaded videos data. Deliver an awe inspiring pitch with this creative Youtube Advertising Techniques Youtube Marketing Dashboard Highlighting Traffic Source Summary PDF bundle. Topics like Subscriber Gained, Traffic Sources, Avg Views can be discussed with this completely editable template. It is available for immediate download depending on the needs and requirements of the user.

CRM System Competitive Dashboard With Sales Pipeline Ppt PowerPoint Presentation Icon Outfit PDF
Showcasing this set of slides titled crm system competitive dashboard with sales pipeline ppt powerpoint presentation icon outfit pdf. The topics addressed in these templates are sales forecast by competitor, win loss report, open opportunity revenue by competitor, sales pipeline by sales rep, competitor. All the content presented in this PPT design is completely editable. Download it and make adjustments in color, background, font etc. as per your unique business setting.
Youtube Marketing Dashboard Highlighting Traffic Source And Average Views Icons PDF
This slide showcases the youtube marketing dashboard which includes subscriber gained vs loss list which includes traffic sources and lasted uploaded videos data.Create an editable Youtube Marketing Dashboard Highlighting Traffic Source And Average Views Icons PDF that communicates your idea and engages your audience. Whether you are presenting a business or an educational presentation, pre-designed presentation templates help save time. Youtube Marketing Dashboard Highlighting Traffic Source And Average Views Icons PDF is highly customizable and very easy to edit, covering many different styles from creative to business presentations. Slidegeeks has creative team members who have crafted amazing templates. So, go and get them without any delay.

Data Theft And Breach Threats Monitoring Dashboard Ppt Outline Designs PDF
This slide covers dashboard to monitor top data breaches and loss of confidential data in organization. It includes KPIs such percentage of data risks detected, number of data risks, data risk analysis, response progress for data risks, data risk ratings. Showcasing this set of slides titled Data Theft And Breach Threats Monitoring Dashboard Ppt Outline Designs PDF. The topics addressed in these templates are Number Risk Threshold, Data Analysts Progress, Action Plan Breakdown. All the content presented in this PPT design is completely editable. Download it and make adjustments in color, background, font etc. as per your unique business setting.

Kpi Dashboard To Measure Talent Performance Employee Performance Management Tactics Professional PDF
This slide represents dashboard to measure talent performance in organization. It includes talent applicant status, team training methods, talented candidate status, risk for loss of potential talent pool etc.The Kpi Dashboard To Measure Talent Performance Employee Performance Management Tactics Professional PDF is a compilation of the most recent design trends as a series of slides. It is suitable for any subject or industry presentation, containing attractive visuals and photo spots for businesses to clearly express their messages. This template contains a variety of slides for the user to input data, such as structures to contrast two elements, bullet points, and slides for written information. Slidegeeks is prepared to create an impression.

Workforce Management Strategies For Effective Hiring Process Kpi Dashboard To Measure Talent Performance Formats PDF
This slide represents dashboard to measure talent performance in organization. It includes talent applicant status, team training methods, talented candidate status, risk for loss of potential talent pool etc. Deliver an awe inspiring pitch with this creative Workforce Management Strategies For Effective Hiring Process Kpi Dashboard To Measure Talent Performance Formats PDF bundle. Topics like Potential Candidate, Talent Performance, Learning Platform can be discussed with this completely editable template. It is available for immediate download depending on the needs and requirements of the user.
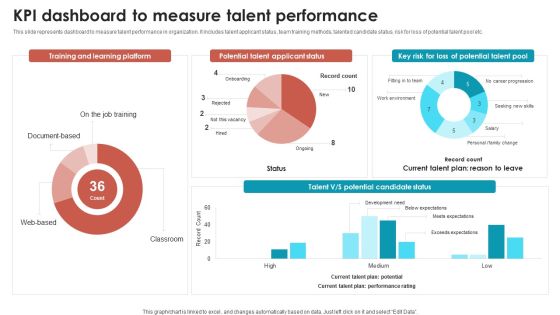
Talent Management Optimization With Workforce Staffing Kpi Dashboard To Measure Talent Performance Sample PDF
This slide represents dashboard to measure talent performance in organization. It includes talent applicant status, team training methods, talented candidate status, risk for loss of potential talent pool etc. If your project calls for a presentation, then Slidegeeks is your go to partner because we have professionally designed, easy to edit templates that are perfect for any presentation. After downloading, you can easily edit Talent Management Optimization With Workforce Staffing Kpi Dashboard To Measure Talent Performance Sample PDF and make the changes accordingly. You can rearrange slides or fill them with different images. Check out all the handy templates.

Lean Operational Excellence Strategy Manufacturing Dashboard To Check Production System Efficiency Pictures PDF
This slide showcases manufacturing dashboard to track KPIs defined under lean and kaizen process improvement plans. Key performance metrics included here are TEEP, OEE, loading time, production quality, losses by hours, losses by categories etc. Pitch your topic with ease and precision using this Lean Operational Excellence Strategy Manufacturing Dashboard To Check Production System Efficiency Pictures PDF. This layout presents information on Loading, Availability, Performance. It is also available for immediate download and adjustment. So, changes can be made in the color, design, graphics or any other component to create a unique layout.

Cloud Intelligence Framework For Application Consumption Financial Losses To The Organizations Due To Security Issues Mockup PDF
The slide provides total financial losses from the year 2017 to 2021 reported by the organizations in United states along with the key reasons behind those losses. Deliver an awe inspiring pitch with this creative cloud intelligence framework for application consumption financial losses to the organizations due to security issues mockup pdf bundle. Topics like security vulnerabilities, primary reasons for the growing, physical theft of a data-carrying device, 2016 to 2020 can be discussed with this completely editable template. It is available for immediate download depending on the needs and requirements of the user.
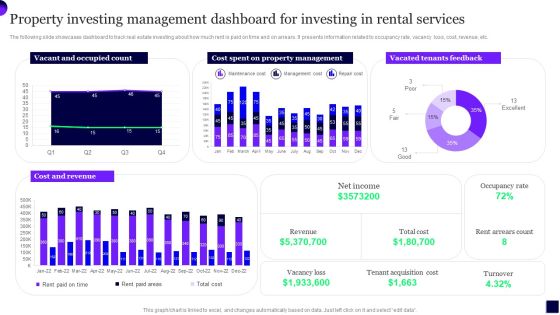
Property Investing Management Dashboard For Investing In Rental Services Template PDF
The following slide showcases dashboard to track real estate investing about how much rent is paid on time and on arrears. It presents information related to occupancy rate, vacancy loss, cost, revenue, etc. Showcasing this set of slides titled Property Investing Management Dashboard For Investing In Rental Services Template PDF. The topics addressed in these templates are Cost, Property Management, Revenue. All the content presented in this PPT design is completely editable. Download it and make adjustments in color, background, font etc. as per your unique business setting.
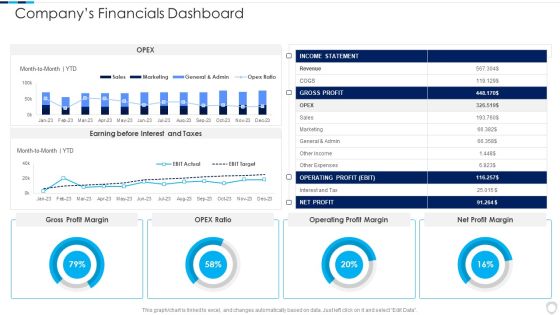
Financial Report Of An IT Firm Companys Financials Dashboard Infographics PDF
Deliver an awe inspiring pitch with this creative Financial Report Of An IT Firm Companys Financials Dashboard Infographics PDF bundle. Topics like Operating Profit, Gross Profit, Income Statement can be discussed with this completely editable template. It is available for immediate download depending on the needs and requirements of the user.

R2R Dashboard With Income Statement Ppt PowerPoint Presentation Show Slide Download PDF
Following slide outlines a comprehensive R2R dashboard used for taking financial decisions. The various metrics covered in this slide are total income, expenses, net profit, cash at end of month, income and expenses, quick ratio, current ratio etc.Showcasing this set of slides titled R2R Dashboard With Income Statement Ppt PowerPoint Presentation Show Slide Download PDF. The topics addressed in these templates are Operating Expenses, Total Experience, Accounts Receivable. All the content presented in this PPT design is completely editable. Download it and make adjustments in color, background, font etc. as per your unique business setting.

Dashboard For Reverse Proxy Performance Tracking Reverse Proxy For Load Balancing Slides PDF
This slide represents the dashboard for reverse proxy performance tracking by covering details of CPU load, available memory, and connections.Deliver an awe inspiring pitch with this creative Dashboard For Reverse Proxy Performance Tracking Reverse Proxy For Load Balancing Slides PDF bundle. Topics like Dashboard For Reverse, Proxy Performance, Tracking can be discussed with this completely editable template. It is available for immediate download depending on the needs and requirements of the user.
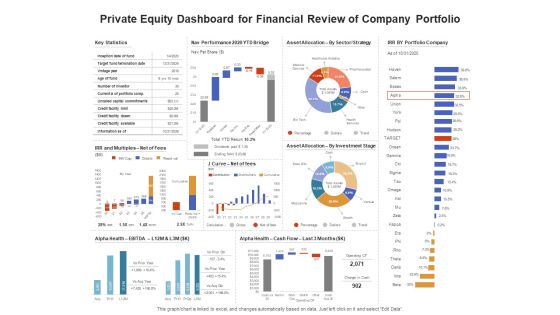
Venture Capitalist Control Board Private Equity Dashboard For Financial Review Of Company Portfolio Information PDF
Presenting this set of slides with name venture capitalist control board private equity dashboard for financial review of company portfolio information pdf. The topics discussed in these slides are contribution margin, margin analysis, income statement, dashboards controls. This is a completely editable PowerPoint presentation and is available for immediate download. Download now and impress your audience.

Degree Of Operational Leverage Dashboard With Income Statement Ppt Infographics Layout PDF
This slide illustrates graphical representation of company revenue and income statement. It includes monthly revenue, revenue by products, revenue by country etc. Pitch your topic with ease and precision using this Degree Of Operational Leverage Dashboard With Income Statement Ppt Infographics Layout PDF. This layout presents information on Monthly Revenue, Income Statement, Product. It is also available for immediate download and adjustment. So, changes can be made in the color, design, graphics or any other component to create a unique layout.

Techniques To Optimize UX Customer Support Service Analysis Dashboard Template PDF
This slide exhibits customer service dashboard to improve visibility. The dashboard includes resolved and active cases, incoming cases by subject, priority, SLA status and age, CSAT and escalated case volume. Crafting an eye-catching presentation has never been more straightforward. Let your presentation shine with this tasteful yet straightforward Techniques To Optimize UX Customer Support Service Analysis Dashboard Template PDF template. It offers a minimalistic and classy look that is great for making a statement. The colors have been employed intelligently to add a bit of playfulness while still remaining professional. Construct the ideal Techniques To Optimize UX Customer Support Service Analysis Dashboard Template PDF that effortlessly grabs the attention of your audience Begin now and be certain to wow your customers.

Dashboard For Monitoring Reverse Proxy Server Performance Reverse Proxy For Load Balancing Structure PDF
This slide depicts the dashboard for monitoring reverse proxy server performance by covering metrics, log analytics, traces, and infrastructure.Deliver and pitch your topic in the best possible manner with this Dashboard For Monitoring Reverse Proxy Server Performance Reverse Proxy For Load Balancing Structure PDF. Use them to share invaluable insights on Connections, Reading, Writing and impress your audience. This template can be altered and modified as per your expectations. So, grab it now.
Patient Healthcare Online Transformation Dashboard Ppt PowerPoint Presentation Icon Example File PDF
This slide displays the dashboard depicting the results of patients after the digital transformation. It includes the daily activity of the patients on the app, appointments, water balance, etc. Pitch your topic with ease and precision using this Patient Healthcare Online Transformation Dashboard Ppt PowerPoint Presentation Icon Example File PDF. This layout presents information on General Health, Water Balance, Transformation Dashboard. It is also available for immediate download and adjustment. So, changes can be made in the color, design, graphics or any other component to create a unique layout.
Environmental Assessment Financial Dashboard For Business Impact Tracking Ppt Layouts Guidelines PDF
This slide shows financial dashboard for business impact tracking with key performance indicators like quick ratio, current ratio, monthly cash flow etc Deliver and pitch your topic in the best possible manner with this environmental assessment financial dashboard for business impact tracking ppt layouts guidelines pdf. Use them to share invaluable insights on sales outstanding, cash balance, accounts payable and impress your audience. This template can be altered and modified as per your expectations. So, grab it now.

Net Banking Channel And Service Management Online Banking Dashboard To Track Transactions Professional PDF
This slide represents online banking dashboard for tracking financial transactions. It includes account balance, saving account, current account, income, expenses etc. Boost your pitch with our creative Net Banking Channel And Service Management Online Banking Dashboard To Track Transactions Professional PDF. Deliver an awe inspiring pitch that will mesmerize everyone. Using these presentation templates you will surely catch everyones attention. You can browse the ppts collection on our website. We have researchers who are experts at creating the right content for the templates. So you dont have to invest time in any additional work. Just grab the template now and use them.

Stock Market Research Report Organization Performance Dashboard For Equity Research Slides PDF
Deliver an awe-inspiring pitch with this creative stock market research report organization performance dashboard for equity research slides pdf bundle. Topics like balance sheet, return on assets, working capital ratio, return on equity, debt equity ratio can be discussed with this completely editable template. It is available for immediate download depending on the needs and requirements of the user.

Business Dashboard Showing Return On Assests Ppt PowerPoint Presentation Show Graphic Images PDF
Presenting this set of slides with name business dashboard showing return on assests ppt powerpoint presentation show graphic images pdf. The topics discussed in these slides are return on assets, working capital ratio, balance sheet, return on equity, debt equity ratio. This is a completely editable PowerPoint presentation and is available for immediate download. Download now and impress your audience.

Cash Management Dashboard With Sales Outstanding And Liquidity Ratio Analysis Information PDF
This showcases dashboard that can help organization in cash management and track KPIs to evaluate the financial performance of company. It key components are liquidity ratios, cash balance. days sales outstanding, days inventory outstanding and days payable outstanding. Pitch your topic with ease and precision using this Cash Management Dashboard With Sales Outstanding And Liquidity Ratio Analysis Information PDF. This layout presents information on Cash Conversion, Working Capital, Cash Balance. It is also available for immediate download and adjustment. So, changes can be made in the color, design, graphics or any other component to create a unique layout.
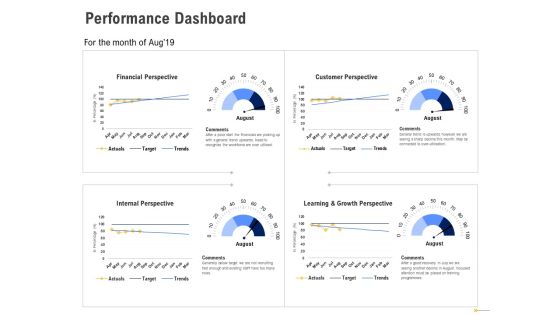
Using Balanced Scorecard Strategy Maps Drive Performance Dashboard Ppt Styles Themes PDF
Presenting this set of slides with name using balanced scorecard strategy maps drive performance dashboard ppt styles themes pdf. The topics discussed in these slides are financial perspective, customer perspective, internal perspective, learning and growth perspective. This is a completely editable PowerPoint presentation and is available for immediate download. Download now and impress your audience.

Balanced Scorecard Outline Performance Dashboard Ppt PowerPoint Presentation Outline Slides PDF
Presenting this set of slides with name balanced scorecard outline performance dashboard ppt powerpoint presentation outline slides pdf. The topics discussed in these slides are financial perspective, customer perspective, internal perspective, learning and growth perspective, actual, target, trade. This is a completely editable PowerPoint presentation and is available for immediate download. Download now and impress your audience.

Staff Turnover Ratio BSC Employee Turnover Rate Balanced Scorecard Dashboard Professional PDF
Deliver an awe inspiring pitch with this creative staff turnover ratio bsc employee turnover rate balanced scorecard dashboard professional pdf bundle. Topics like employees, hiring, termination, absenteeism, performance, trainings can be discussed with this completely editable template. It is available for immediate download depending on the needs and requirements of the user.
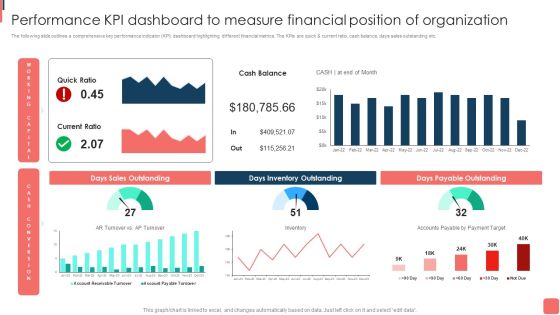
Effective Financial Planning Assessment Techniques Performance Kpi Dashboard To Measure Financial Graphics PDF
The following slide outlines a comprehensive key performance indicator KPI dashboard highlighting different financial metrics. The KPIs are quick and current ratio, cash balance, days sales outstanding etc. The best PPT templates are a great way to save time, energy, and resources. Slidegeeks have 100 precent editable powerpoint slides making them incredibly versatile. With these quality presentation templates, you can create a captivating and memorable presentation by combining visually appealing slides and effectively communicating your message. Download Effective Financial Planning Assessment Techniques Performance Kpi Dashboard To Measure Financial Graphics PDF from Slidegeeks and deliver a wonderful presentation.

Financial Forecast And Essential Metrics Dashboard Showing Cash Management Designs PDF
This slide contains the projections of the company financials to predict the future position so that better decisions could be taken for the growth prospective. It also includes ratios, cash balance, inventory analysis , etc. Showcasing this set of slides titled Financial Forecast And Essential Metrics Dashboard Showing Cash Management Designs PDF. The topics addressed in these templates are Days Sales Outstanding, Cash Management Dashboard, Days Inventory Outstanding. All the content presented in this PPT design is completely editable. Download it and make adjustments in color, background, font etc. as per your unique business setting.

Dashboard For Domestic Budget Planning And Management Ppt PowerPoint Presentation Icon Maker PDF
This slide showcases a dashboard for domestic planning and efficient spending. Its key elements are total receipts, total payments, receipts classification, expenses classification, cash transactions, current cash balance and cash transactions. Showcasing this set of slides titled Dashboard For Domestic Budget Planning And Management Ppt PowerPoint Presentation Icon Maker PDF. The topics addressed in these templates are Total Receipts, Total Payments, Cash Transactions. All the content presented in this PPT design is completely editable. Download it and make adjustments in color, background, font etc. as per your unique business setting.

Facts Assessment Business Intelligence KPI Dashboard Assets Ppt PowerPoint Presentation Slides Show PDF
Presenting this set of slides with name facts assessment business intelligence kpi dashboard assets ppt powerpoint presentation slides show pdf. The topics discussed in these slides are expenses class, top 5 accounts receivables balance, assets profile, working capital, checking savings, monthly revenues and expenses. This is a completely editable PowerPoint presentation and is available for immediate download. Download now and impress your audience.

Introduction To Digital Banking Services Metric Dashboard To Track Internet Banking Activities Download PDF
This slide represents KPI dashboard showcasing metrics for internet banking enabling customer to track progress. It includes account balance, income, expenditure, loan etc. Slidegeeks is here to make your presentations a breeze with Introduction To Digital Banking Services Metric Dashboard To Track Internet Banking Activities Download PDF With our easy to use and customizable templates, you can focus on delivering your ideas rather than worrying about formatting. With a variety of designs to choose from, you are sure to find one that suits your needs. And with animations and unique photos, illustrations, and fonts, you can make your presentation pop. So whether you are giving a sales pitch or presenting to the board, make sure to check out Slidegeeks first.
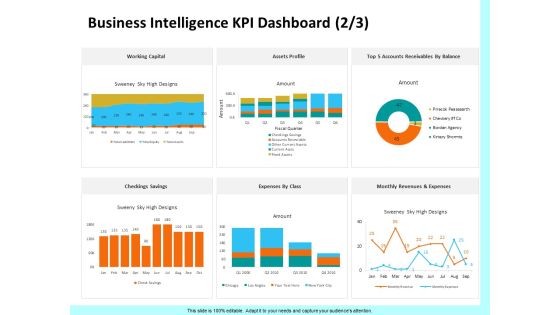
Firm Productivity Administration Business Intelligence KPI Dashboard Assets Ppt PowerPoint Presentation Slides Background Designs PDF
Presenting this set of slides with name firm productivity administration business intelligence kpi dashboard assets ppt powerpoint presentation slides background designs pdf. The topics discussed in these slides are expenses class, top 5 accounts receivables balance, assets profile, working capital, checking savings, monthly revenues and expenses. This is a completely editable PowerPoint presentation and is available for immediate download. Download now and impress your audience.

Enterprise Problem Solving And Intellect Business Intelligence KPI Dashboard Profile Ppt PowerPoint Presentation Summary Structure PDF
Presenting this set of slides with name enterprise problem solving and intellect business intelligence kpi dashboard profile ppt powerpoint presentation summary structure pdf. The topics discussed in these slides are expenses class, top 5 accounts receivables balance, assets profile, working capital, checking savings, monthly revenues and expenses. This is a completely editable PowerPoint presentation and is available for immediate download. Download now and impress your audience.
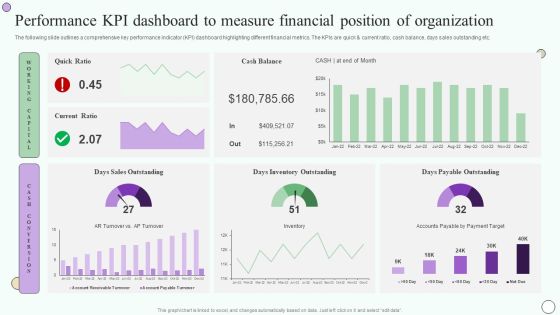
Estimating Business Overall Performance Kpi Dashboard To Measure Financial Position Inspiration PDF
The following slide outlines a comprehensive key performance indicator KPI dashboard highlighting different financial metrics. The KPIs are quick and current ratio, cash balance, days sales outstanding etc. Welcome to our selection of the Estimating Business Overall Performance Kpi Dashboard To Measure Financial Position Inspiration PDF. These are designed to help you showcase your creativity and bring your sphere to life. Planning and Innovation are essential for any business that is just starting out. This collection contains the designs that you need for your everyday presentations. All of our PowerPoints are 100 percent editable, so you can customize them to suit your needs. This multi-purpose template can be used in various situations. Grab these presentation templates today.

Overview Of Organizational Performance Kpi Dashboard To Measure Financial Position Sample PDF
The following slide outlines a comprehensive key performance indicator KPI dashboard highlighting different financial metrics. The KPIs are quick and current ratio, cash balance, days sales outstanding etc. Welcome to our selection of the Overview Of Organizational Performance Kpi Dashboard To Measure Financial Position Sample PDF. These are designed to help you showcase your creativity and bring your sphere to life. Planning and Innovation are essential for any business that is just starting out. This collection contains the designs that you need for your everyday presentations. All of our PowerPoints are 100 percent editable, so you can customize them to suit your needs. This multi-purpose template can be used in various situations. Grab these presentation templates today.

Performance KPI Dashboard To Measure Financial Position Of Organization Pictures PDF
The following slide outlines a comprehensive key performance indicator KPI dashboard highlighting different financial metrics. The KPIs are quick and current ratio, cash balance, days sales outstanding etc. Slidegeeks is here to make your presentations a breeze with Performance KPI Dashboard To Measure Financial Position Of Organization Pictures PDF With our easy to use and customizable templates, you can focus on delivering your ideas rather than worrying about formatting. With a variety of designs to choose from, you are sure to find one that suits your needs. And with animations and unique photos, illustrations, and fonts, you can make your presentation pop. So whether you are giving a sales pitch or presenting to the board, make sure to check out Slidegeeks first.
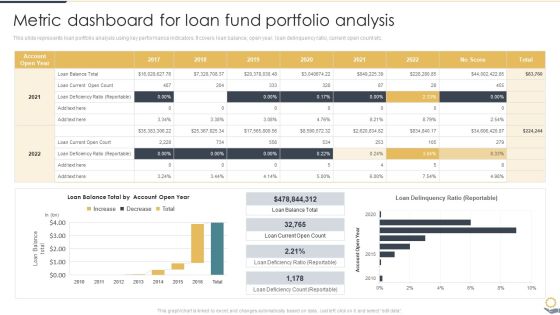
Metric Dashboard For Loan Fund Portfolio Analysis Portfolio Investment Analysis Formats PDF
This slide represents loan portfolio analysis using key performance indicators. It covers loan balance, open year, loan delinquency ratio, current open count etc.From laying roadmaps to briefing everything in detail, our templates are perfect for you. You can set the stage with your presentation slides. All you have to do is download these easy-to-edit and customizable templates. Metric Dashboard For Loan Fund Portfolio Analysis Portfolio Investment Analysis Formats PDF will help you deliver an outstanding performance that everyone would remember and praise you for. Do download this presentation today.

Company Financial Performance Indicators Dashboard With Liquidity And Turnover Ratios Formats PDF
This graph or chart is linked to excel, and changes automatically based on data. Just left click on it and select Edit Data. Pitch your topic with ease and precision using this Company Financial Performance Indicators Dashboard With Liquidity And Turnover Ratios Formats PDF. This layout presents information on Cash Balance, Days Inventory Outstanding, Days Payable Outstanding. It is also available for immediate download and adjustment. So, changes can be made in the color, design, graphics or any other component to create a unique layout.

Monetary Planning And Evaluation Guide Performance KPI Dashboard To Measure Financial Position Of Organization Ppt File Slides PDF
The following slide outlines a comprehensive key performance indicator KPI dashboard highlighting different financial metrics. The KPIs are quick and current ratio, cash balance, days sales outstanding etc. The best PPT templates are a great way to save time, energy, and resources. Slidegeeks have 100 percent editable powerpoint slides making them incredibly versatile. With these quality presentation templates, you can create a captivating and memorable presentation by combining visually appealing slides and effectively communicating your message. Download Monetary Planning And Evaluation Guide Performance KPI Dashboard To Measure Financial Position Of Organization Ppt File Slides PDF from Slidegeeks and deliver a wonderful presentation.

Adjusting Financial Strategies And Planning Quarterly Income Statement For Monitoring Business Profitability Infographics PDF
This slide provides glimpse about quarterly profit and loss statement that can help our business to calculate net profit or loss. It includes revenue, net sales, cost of goods sold, operating expenses, operating profit, etc. The Adjusting Financial Strategies And Planning Quarterly Income Statement For Monitoring Business Profitability Infographics PDF is a compilation of the most recent design trends as a series of slides. It is suitable for any subject or industry presentation, containing attractive visuals and photo spots for businesses to clearly express their messages. This template contains a variety of slides for the user to input data, such as structures to contrast two elements, bullet points, and slides for written information. Slidegeeks is prepared to create an impression.
Product Manufacturing Dashboards Ppt Icon Inspiration PDF
Following slide shows product manufacturing dashboard. This includes production rate, overall productivity, unit loss and operators availability status.Deliver and pitch your topic in the best possible manner with this product manufacturing dashboards ppt icon inspiration pdf. Use them to share invaluable insights on overall plant productivity, overall productivity, productivity and impress your audience. This template can be altered and modified as per your expectations. So, grab it now.

Dashboards And Scorecards Comparison Diagram Ppt Slides
This is a dashboards and scorecards comparison diagram ppt slides. This is a three stage process. The stages in this process are dashboard, balanced scorecard, differences, performance management, periodically monthly, gps shows how will arrive, is used for, is update, in automobile it is, performance monitoring, in real time, automobile dashboard shows how your car is operating.

Information Technology Transformation Organization Product Manufacturing Dashboards Demonstration PDF
Following slide shows product manufacturing dashboard. This includes production rate, overall productivity, unit loss and operators availability status. Deliver an awe inspiring pitch with this creative information technology transformation organization product manufacturing dashboards demonstration pdf bundle. Topics like product manufacturing dashboards can be discussed with this completely editable template. It is available for immediate download depending on the needs and requirements of the user.

Executive Dashboards To Track Sales Performance Guidelines PDF
This slide represents the CEO dashboard for tracking the sales performance of the organization. It includes key performance indicators such as gross, operating and net profit, sales amount by category, income statement etc. Pitch your topic with ease and precision using this Executive Dashboards To Track Sales Performance Guidelines PDF. This layout presents information on Income Statement, Monthly Sales Growth, Days Receivable Outstanding. It is also available for immediate download and adjustment. So, changes can be made in the color, design, graphics or any other component to create a unique layout.
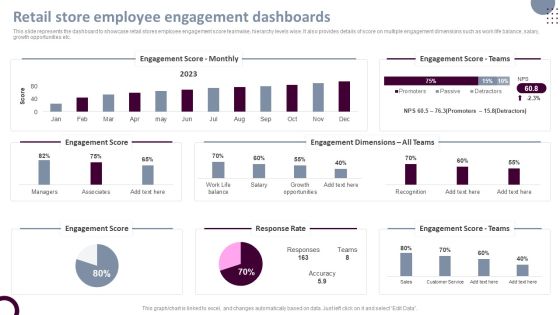
Retail Store Operations Retail Store Employee Engagement Dashboards Guidelines PDF
This slide represents the dashboard to showcase retail stores employee engagement score teamwise, hierarchy levels wise. It also provides details of score on multiple engagement dimensions such as work life balance, salary, growth opportunities etc. Slidegeeks is here to make your presentations a breeze with Retail Store Operations Retail Store Employee Engagement Dashboards Guidelines PDF With our easy-to-use and customizable templates, you can focus on delivering your ideas rather than worrying about formatting. With a variety of designs to choose from, youre sure to find one that suits your needs. And with animations and unique photos, illustrations, and fonts, you can make your presentation pop. So whether youre giving a sales pitch or presenting to the board, make sure to check out Slidegeeks first.

Business Strategy Development Process Business Management Dashboards Balance Download PDF
Deliver an awe inspiring pitch with this creative business strategy development process business management dashboards balance download pdf bundle. Topics like actual income vs budget, actual expenses vs budget can be discussed with this completely editable template. It is available for immediate download depending on the needs and requirements of the user.

Enterprise Management Business Management Dashboards Jan Slides PDF
Deliver and pitch your topic in the best possible manner with this enterprise management business management dashboards jan slides pdf. Use them to share invaluable insights on actual income vs budget, actual expenses vs budget, balance and impress your audience. This template can be altered and modified as per your expectations. So, grab it now.
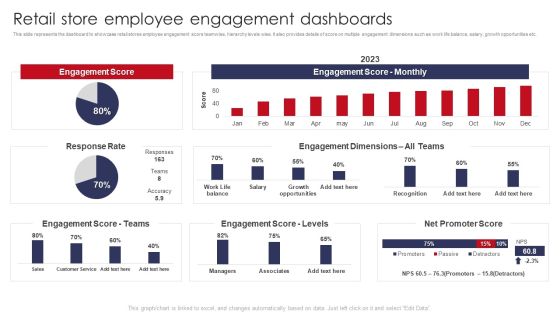
Retail Store Employee Engagement Dashboards Retail Outlet Operations Performance Evaluation Background PDF
This slide represents the dashboard to showcase retail stores employee engagement score teamwise, hierarchy levels wise. It also provides details of score on multiple engagement dimensions such as work life balance, salary, growth opportunities etc.Deliver an awe inspiring pitch with this creative Retail Store Employee Engagement Dashboards Retail Outlet Operations Performance Evaluation Background PDF bundle. Topics like Engagement Score, Engagement Dimensions, Score Teams can be discussed with this completely editable template. It is available for immediate download depending on the needs and requirements of the user.
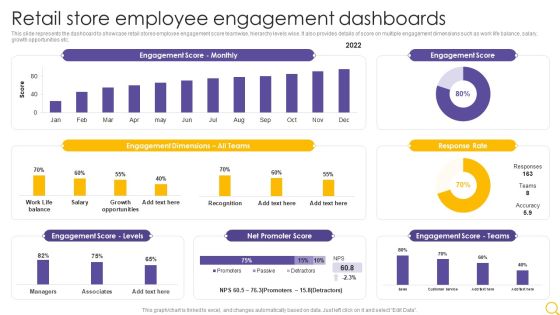
Retail Outlet Operational Efficiency Analytics Retail Store Employee Engagement Dashboards Sample PDF
This slide represents the dashboard to showcase retail stores employee engagement score teamwise, hierarchy levels wise. It also provides details of score on multiple engagement dimensions such as work life balance, salary, growth opportunities etc. Deliver an awe inspiring pitch with this creative Retail Outlet Operational Efficiency Analytics Retail Store Employee Engagement Dashboards Sample PDF bundle. Topics like Engagement Score Monthly, Engagement Dimensions, Engagement Score Levels can be discussed with this completely editable template. It is available for immediate download depending on the needs and requirements of the user.

Retail Store Employee Engagement Dashboards Retail Outlet Performance Assessment Summary PDF
This slide represents the dashboard to showcase retail stores employee engagement score teamwise, hierarchy levels wise. It also provides details of score on multiple engagement dimensions such as work life balance, salary, growth opportunities etc.Deliver an awe inspiring pitch with this creative Retail Store Employee Engagement Dashboards Retail Outlet Performance Assessment Summary PDF bundle. Topics like Engagement Score, Promoter Score, Engagement Dimensions can be discussed with this completely editable template. It is available for immediate download depending on the needs and requirements of the user.

Problem And Recommendation 1 Absence Of Latest Technologies Download PDF
This slide shows the problem that the company is facing related to absence of latest technologies in the company. Also, some recommendations are provided to solve the problem. Presenting problem and recommendation 1 absence of latest technologies download pdf to provide visual cues and insights. Share and navigate important information on three stages that need your due attention. This template can be used to pitch topics like customer loss, market, cosmetic technologies. In addtion, this PPT design contains high resolution images, graphics, etc, that are easily editable and available for immediate download.

Balanced Scorecard Kpi S Ppt Slide Examples
This is a balanced scorecard kpi s ppt slide examples. This is a four stage process. The stages in this process are learning and growth, customer, financial, internal business processes.
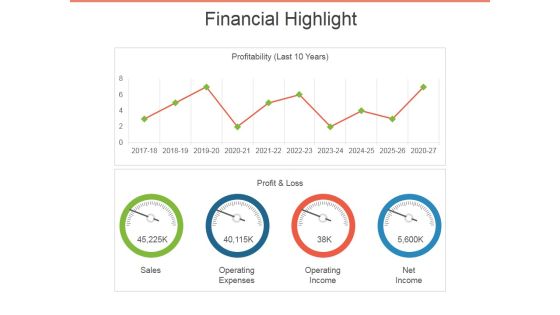
Financial Highlight Template 2 Ppt PowerPoint Presentation Outline Visuals
This is a financial highlight template 2 ppt powerpoint presentation outline visuals. This is a two stage process. The stages in this process are sales, profit and loss, operating expenses, operating income, net income.

Implementation Of Growth Strategy Example Ppt Images Gallery
This is a implementation of growth strategy example ppt images gallery. This is a five stage process. The stages in this process are necessity of fit , importance of integrating strategy, strategy formulation, focus on structure, control issues, loss, profit.

Balanced Scorecard Leading And Lagging Indicators Powerpoint Slide
This is a balanced scorecard leading and lagging indicators powerpoint slide. This is a four stage process. The stages in this process are dashboard, business, marketing, technology, meter.

Balanced Scorecard Strategic Planning Ppt Samples
This is a balanced scorecard strategic planning ppt samples. This is a four stage process. The stages in this process are finance, customer, process, learning and growth.

Balanced Scorecard Success Layout Ppt Slide Show
This is a balanced scorecard success layout ppt slide show. This is a four stage process. The stages in this process are clinical quality, customer loyalty, financial viability, operational effectiveness.
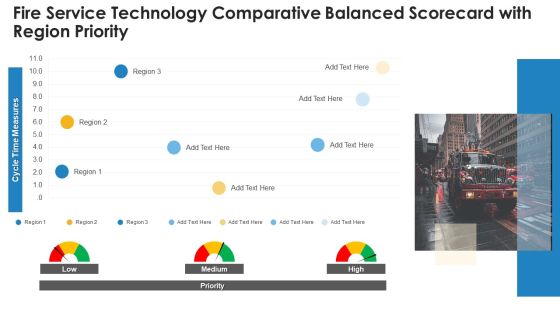
Fire Service Technology Comparative Balanced Scorecard With Region Priority Elements PDF
Deliver and pitch your topic in the best possible manner with this fire service technology comparative balanced scorecard with region priority elements pdf. Use them to share invaluable insights on fire service technology comparative balanced scorecard with region priority and impress your audience. This template can be altered and modified as per your expectations. So, grab it now.
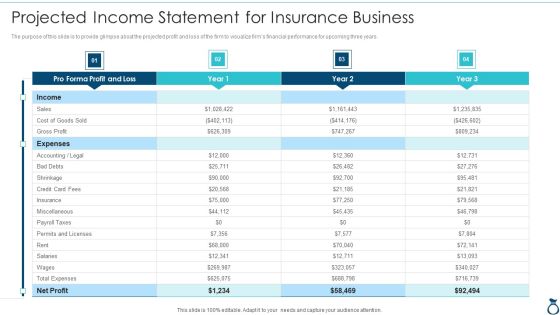
Financial Services Advisory Business Plan Projected Income Statement For Insurance Infographics PDF
The purpose of this slide is to provide glimpse about the projected profit and loss of the firm to visualize firms financial performance for upcoming three years. Deliver an awe inspiring pitch with this creative Financial Services Advisory Business Plan Projected Income Statement For Insurance Infographics PDF bundle. Topics like Profit And Loss, Insurance, Rent, Cost, Gross Profit can be discussed with this completely editable template. It is available for immediate download depending on the needs and requirements of the user.

 Home
Home