Productivity Metrics
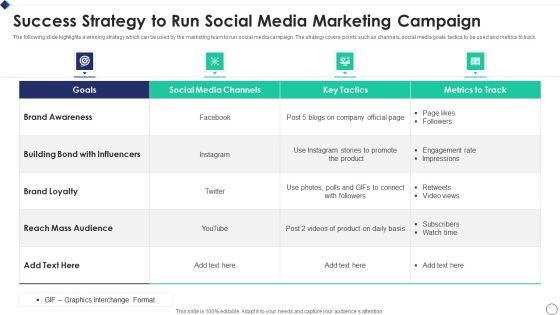
Success Strategy To Run Social Media Marketing Campaign Template PDF
The following slide highlights a winning strategy which can be used by the marketing team to run social media campaign. The strategy covers points such as channels, social media goals, tactics to be used and metrics to track. Showcasing this set of slides titled Success Strategy To Run Social Media Marketing Campaign Template PDF The topics addressed in these templates are Building Bond, Reach Mass, Instagram Stories All the content presented in this PPT design is completely editable. Download it and make adjustments in color, background, font etc. as per your unique business setting.
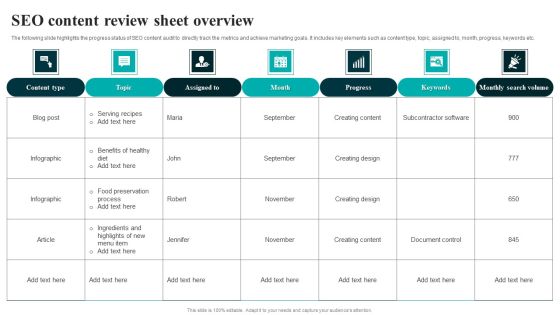
SEO Content Review Sheet Overview Infographics PDF
The following slide highlights the progress status of SEO content audit to directly track the metrics and achieve marketing goals. It includes key elements such as content type, topic, assigned to, month, progress, keywords etc. Pitch your topic with ease and precision using this SEO Content Review Sheet Overview Infographics PDF. This layout presents information on Serving Recipes, Benefits Of Healthy, Food Preservation Process. It is also available for immediate download and adjustment. So, changes can be made in the color, design, graphics or any other component to create a unique layout.

Mobile Search Engine Optimization Plan SEO Reporting Dashboard To Evaluate Website Rank Structure PDF
The purpose of this slide is to outline mobile search engine optimization SEO reporting dashboard. It covers different metrics such as web traffic overview, total views, content overview, goal value and conversion etc. There are so many reasons you need a Mobile Search Engine Optimization Plan SEO Reporting Dashboard To Evaluate Website Rank Structure PDF. The first reason is you can not spend time making everything from scratch, Thus, Slidegeeks has made presentation templates for you too. You can easily download these templates from our website easily.
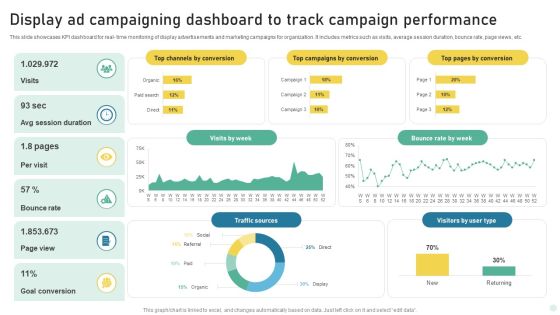
Display Ad Campaigning Dashboard To Track Campaign Performance Background PDF
This slide showcases KPI dashboard for real- time monitoring of display advertisements and marketing campaigns for organization. It includes metrics such as visits, average session duration, bounce rate, page views, etc. Showcasing this set of slides titled Display Ad Campaigning Dashboard To Track Campaign Performance Background PDF. The topics addressed in these templates are Traffic Sources, Bounce Rate, Goal Conversion. All the content presented in this PPT design is completely editable. Download it and make adjustments in color, background, font etc. as per your unique business setting.

Agile Methodologies Team Performance Measurement After Agile Implementation Infographics Ppt Infographic Template Ideas PDF
This slide shows team iteration metrics for the measurement of team performance based on parameters such as actual and planned velocity, planned and accepted stories, number of defects and test cases, percentage of automated tests etc. Deliver an awe inspiring pitch with this creative agile methodologies team performance measurement after agile implementation infographics ppt infographic template ideas pdf bundle. Topics like Team Performance Measurement After Agile Implementation can be discussed with this completely editable template. It is available for immediate download depending on the needs and requirements of the user.
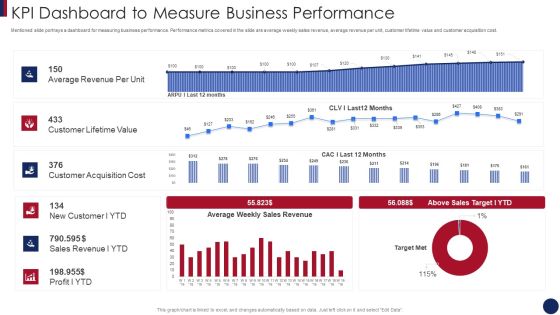
Post Merger Information Technology Service Delivery Amalgamation KPI Dashboard To Measure Business Template PDF
Mentioned slide portrays a dashboard for measuring business performance. Performance metrics covered in the slide are average weekly sales revenue, average revenue per unit, customer lifetime value and customer acquisition cost. Deliver an awe inspiring pitch with this creative post merger information technology service delivery amalgamation kpi dashboard to measure business template pdf bundle. Topics like kpi dashboard to measure business performance can be discussed with this completely editable template. It is available for immediate download depending on the needs and requirements of the user.

Successful Content Promotion Guide Content Marketing Campaign Performance Measuring Scorecard Sample PDF
This slide illustrates the scorecard that is being used by the organization to measure the performance of content marketing campaign. Major metrics covered are related to brand and lead. Deliver and pitch your topic in the best possible manner with this Successful Content Promotion Guide Content Marketing Campaign Performance Measuring Scorecard Sample PDF. Use them to share invaluable insights on Content Marketing Campaign, Performance Measuring Scorecard and impress your audience. This template can be altered and modified as per your expectations. So, grab it now.

Agile Model Improve Task Team Performance Team Performance Measurement After Agile Implementation Slides PDF
This slide shows team iteration metrics for the measurement of team performance based on parameters such as actual and planned velocity, planned and accepted stories, number of defects and test cases, percentage of automated tests etc. Deliver and pitch your topic in the best possible manner with this agile model improve task team performance team performance measurement after agile implementation slides pdf. Use them to share invaluable insights on planned, actual, automated and impress your audience. This template can be altered and modified as per your expectations. So, grab it now.

IT Service Incorporation And Administration Dashboard To Measure Business Performance Portrait PDF
Mentioned slide portrays a dashboard for measuring business performance. Performance metrics covered in the slide are average weekly sales revenue, average revenue per unit, customer lifetime value and customer acquisition cost. Deliver and pitch your topic in the best possible manner with this it service incorporation and administration dashboard to measure business performance portrait pdf. Use them to share invaluable insights on sales, revenue, target, acquisition cost and impress your audience. This template can be altered and modified as per your expectations. So, grab it now.
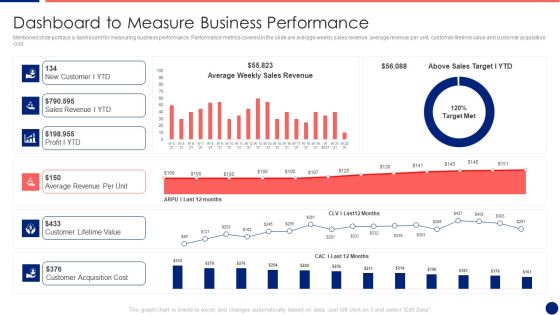
Information Technology Service Integration Post Acquisition Merger Dashboard To Measure Business Pictures PDF
Mentioned slide portrays a dashboard for measuring business performance. Performance metrics covered in the slide are average weekly sales revenue, average revenue per unit, customer lifetime value and customer acquisition cost. Deliver and pitch your topic in the best possible manner with this information technology service integration post acquisition merger dashboard to measure business pictures pdf. Use them to share invaluable insights on sales revenue, average, cost and impress your audience. This template can be altered and modified as per your expectations. So, grab it now.
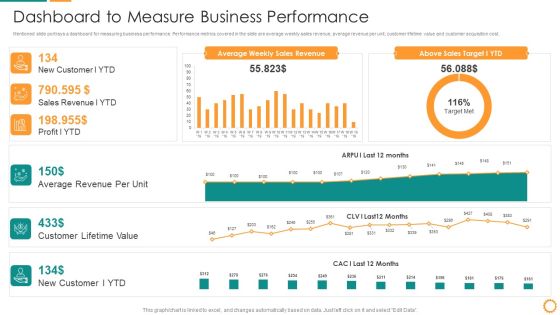
IT Consolidation Post Mergers And Acquisition Dashboard To Measure Business Performance Clipart PDF
Mentioned slide portrays a dashboard for measuring business performance. Performance metrics covered in the slide are average weekly sales revenue, average revenue per unit, customer lifetime value and customer acquisition cost. Deliver and pitch your topic in the best possible manner with this IT Consolidation Post Mergers And Acquisition Dashboard To Measure Business Performance Clipart PDF. Use them to share invaluable insights on Average Revenue, Customer Lifetime Value, Sales Revenue, Sales Target and impress your audience. This template can be altered and modified as per your expectations. So, grab it now.

Promoting Growth Internal Operations Techniques Playbook How To Measure Organic Growth Elements PDF
Purpose of the following slide is to show multiple metrics that the organization can use to track performance of their organic growth strategies, these can be revenues generated, market penetration, increase in referral rate etc. Deliver and pitch your topic in the best possible manner with this Promoting Growth Internal Operations Techniques Playbook How To Measure Organic Growth Elements PDF. Use them to share invaluable insights on Measuring Organic Growth, Market Penetration, Revenues and impress your audience. This template can be altered and modified as per your expectations. So, grab it now.

How To Measure Organic Growth Strategic Playbook For Internal Sales Advancement Slides PDF
Purpose of the following slide is to show multiple metrics that the organization can use to track performance of their organic growth strategies, these can be revenues generated, market penetration, increase in referral rate etc.Deliver and pitch your topic in the best possible manner with this How To Measure Organic Growth Strategic Playbook For Internal Sales Advancement Slides PDF. Use them to share invaluable insights on Expected Increase, Entering Geographies, Increase Percentage and impress your audience. This template can be altered and modified as per your expectations. So, grab it now.

Organic Business Growth Strategies Dashboard For Measuring Success Of Our Marketing Efforts Diagrams PDF
Purpose of the following slide is to display a dashboard to help analyze the marketing efforts through essential metrics such as the revenue generated, average revenue generated per unit etc. Deliver an awe inspiring pitch with this creative Organic Business Growth Strategies Dashboard For Measuring Success Of Our Marketing Efforts Diagrams PDF bundle. Topics like Average Revenue, Customer Lifetime Value, Customer Acquisition Cost can be discussed with this completely editable template. It is available for immediate download depending on the needs and requirements of the user.

Brand Awareness Measuring Kpi Dashboard Brand And Equity Evaluation Techniques Ideas PDF
Mentioned slide showcases KPI dashboard that can be used to check the financial performance of a brand. Metrics covered in the dashboard are return on assets, working capital ratio, return on equity etc.From laying roadmaps to briefing everything in detail, our templates are perfect for you. You can set the stage with your presentation slides. All you have to do is download these easy-to-edit and customizable templates. Brand Awareness Measuring Kpi Dashboard Brand And Equity Evaluation Techniques Ideas PDF will help you deliver an outstanding performance that everyone would remember and praise you for. Do download this presentation today.
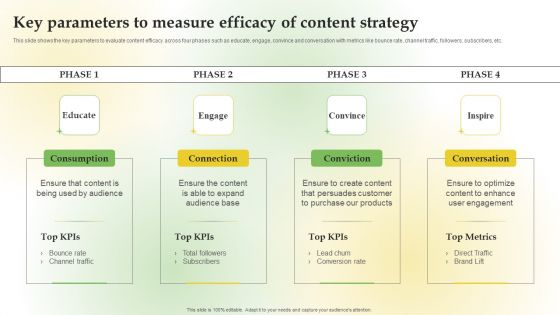
Content Marketing Applications For Nurturing Leads Key Parameters Measure Efficacy Content Strategy Sample PDF
This slide shows the key parameters to evaluate content efficacy across four phases such as educate, engage, convince and conversation with metrics like bounce rate, channel traffic, followers, subscribers, etc. From laying roadmaps to briefing everything in detail, our templates are perfect for you. You can set the stage with your presentation slides. All you have to do is download these easy to edit and customizable templates. Content Marketing Applications For Nurturing Leads Key Parameters Measure Efficacy Content Strategy Sample PDF will help you deliver an outstanding performance that everyone would remember and praise you for. Do download this presentation today.
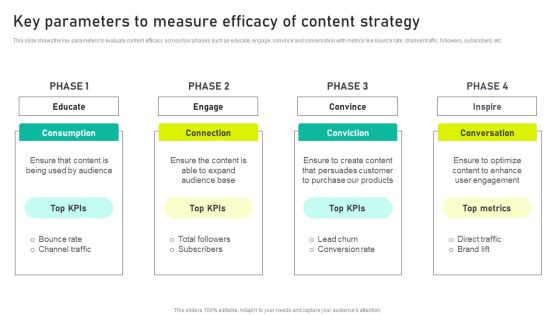
Key Parameters To Measure Efficacy Of Content Strategy Ppt Pictures Graphic Images PDF
This slide shows the key parameters to evaluate content efficacy across four phases such as educate, engage, convince and conversation with metrics like bounce rate, channel traffic, followers, subscribers, etc. From laying roadmaps to briefing everything in detail, our templates are perfect for you. You can set the stage with your presentation slides. All you have to do is download these easy to edit and customizable templates. Key Parameters To Measure Efficacy Of Content Strategy Ppt Pictures Graphic Images PDF will help you deliver an outstanding performance that everyone would remember and praise you for. Do download this presentation today.

Measure Lead Conversion Rate With Its Impact Ppt Portfolio Example PDF
The following slide covers the conversion rate metrics to compare and contrast performance. It includes elements such as description, affecting factors, preference, impact, strategies, formula etc. to get more value from customers. The best PPT templates are a great way to save time, energy, and resources. Slidegeeks have 100 percent editable powerpoint slides making them incredibly versatile. With these quality presentation templates, you can create a captivating and memorable presentation by combining visually appealing slides and effectively communicating your message. Download Measure Lead Conversion Rate With Its Impact Ppt Portfolio Example PDF from Slidegeeks and deliver a wonderful presentation.
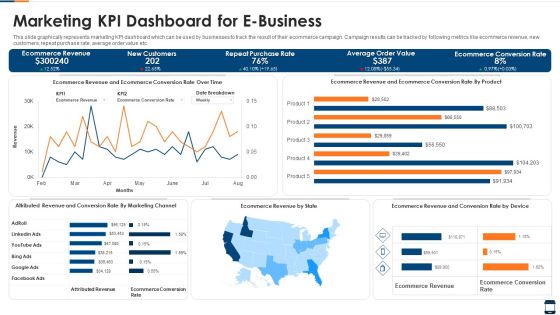
Marketing KPI Dashboard For E Business Brochure PDF
This slide graphically represents marketing KPI dashboard which can be used by businesses to track the result of their ecommerce campaign. Campaign results can be tracked by following metrics like ecommerce revenue, new customers, repeat purchase rate, average order value etc. Showcasing this set of slides titled marketing kpi dashboard for e business brochure pdf. The topics addressed in these templates are marketing kpi dashboard for e business. All the content presented in this PPT design is completely editable. Download it and make adjustments in color, background, font etc. as per your unique business setting.
Retargeting Strategies To Improve Sales Dashboard For Tracking Facebook Retargeting Campaign Background PDF
This slide covers metrics for analysing the results of Facebook retargeting campaign. It includes KPIs such as ad spend, cost per click, click-through rate, ad reach, post engagement, ad clicks, ad impressions, link clicks, etc. Want to ace your presentation in front of a live audience Our Retargeting Strategies To Improve Sales Dashboard For Tracking Facebook Retargeting Campaign Background PDF can help you do that by engaging all the users towards you.. Slidegeeks experts have put their efforts and expertise into creating these impeccable powerpoint presentations so that you can communicate your ideas clearly. Moreover, all the templates are customizable, and easy-to-edit and downloadable. Use these for both personal and commercial use.

Retargeting Strategies To Improve Sales Dashboard For Tracking Instagram Retargeting Campaign Mockup PDF
This slide covers metrics for analyzing the results of the Instagram retargeting campaign. It includes KPIs such as amount spend, total reach, total impressions, website clicks, page likes, ad clicks, post reactions, etc. There are so many reasons you need a Retargeting Strategies To Improve Sales Dashboard For Tracking Instagram Retargeting Campaign Mockup PDF. The first reason is you can not spend time making everything from scratch, Thus, Slidegeeks has made presentation templates for you too. You can easily download these templates from our website easily.
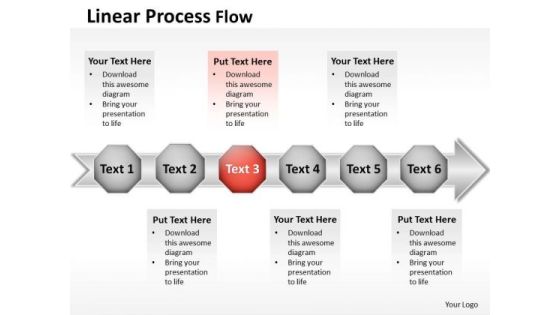
Ppt Horizontal Flow Actions In Diamond Mining Process PowerPoint Presentation Templates
PPT horizontal flow actions in diamond mining process powerpoint presentation Templates-Use this Circular diagram to show activities that are related to the business plan metrics and monitor the results to determine if the business plan is proceeding as planned. Deliver amazing presentations to mesmerize your audience using this Diagram.-PPT horizontal flow actions in diamond mining process powerpoint presentation Templates-3d, Advertisement, Advertising, Arrow, Border, Business, Circles, Collection, Customer, Design, Element, Icon, Idea, Illustration, Info, Information, Isolated, Label, Light, Location, Needle, New, Notification, Notify, Point, Pointer, Promotion, Role, Rounded

Techniques For Enhancing Buyer Acquisition Email Marketing Campaigns Performance Analysis Information PDF
This slide covers an email marketing activity tracking sheet for understanding how subscribers react to the campaign and improve it depending on the results. It includes evaluation metrics such as open rate, click-through rate, click-to-open rate, unsubscribe rate, and spam rate. The best PPT templates are a great way to save time, energy, and resources. Slidegeeks have 100precent editable powerpoint slides making them incredibly versatile. With these quality presentation templates, you can create a captivating and memorable presentation by combining visually appealing slides and effectively communicating your message. Download Techniques For Enhancing Buyer Acquisition Email Marketing Campaigns Performance Analysis Information PDF from Slidegeeks and deliver a wonderful presentation.

Analyzing Present Performance Delivery Gap Information PDF
This slide provides information regarding the present delivery gap that firm is facing in terms of its performance as compared to the industry standards. The firms performance is assessed on metrics such as response rate, forecast accuracy, lead qualification rate, etc. This is a analyzing present performance delivery gap information pdf template with various stages. Focus and dispense information on three stages using this creative set, that comes with editable features. It contains large content boxes to add your information on topics like marketing effectiveness, lead conversion rate, response rate . You can also showcase facts, figures, and other relevant content using this PPT layout. Grab it now.
Implementing Successful Strategic Marketing Plan To Increase ROI Analyzing Present Performance Icons PDF
This slide provides information regarding the present delivery gap that firm is facing in terms of its performance as compared to the industry standards. The firms performance is assessed on metrics such as response rate, forecast accuracy, lead qualification rate, etc. Presenting implementing successful strategic marketing plan to increase roi analyzing present performance icons pdf to provide visual cues and insights. Share and navigate important information on three stages that need your due attention. This template can be used to pitch topics like analyzing present performance delivery gap. In addtion, this PPT design contains high resolution images, graphics, etc, that are easily editable and available for immediate download.

Daily Reports Analysis Of Various Sales Representatives Sales Ppt Portfolio Grid PDF
The daily sales reports provides an overview of the state of sales activities within a firm. It helps in analyzing the performance of different sales executives or representatives. They help in tracking sales metrics that are relevant on daily basis such as number of calls, meetings set up by representatives, number of leads created, etc. Deliver and pitch your topic in the best possible manner with this daily reports analysis of various sales representatives sales ppt portfolio grid pdf. Use them to share invaluable insights on opportunities, cross sell rates, client conversations and impress your audience. This template can be altered and modified as per your expectations. So, grab it now.

Daily Reports Analysis Of Various Sales Representatives Daily Ppt Gallery Graphic Tips PDF
The daily sales reports provides an overview of sales activities within a firm. It helps in analyzing the performance of different sales executives representatives. They help in tracking sales metrics that are relevant on daily basis such as number of sales, total volume of daily sales. Deliver and pitch your topic in the best possible manner with this daily reports analysis of various sales representatives daily ppt gallery graphic tips pdf. Use them to share invaluable insights on opportunities, sales, analysis and impress your audience. This template can be altered and modified as per your expectations. So, grab it now.

Daily Reports Analysis Of Various Sales Representatives Ppt Inspiration Design Inspiration PDF
The daily sales reports provides an overview of the state of sales activities within a firm. It helps in analyzing the performance of different sales executives representatives. They help in tracking sales metrics that are relevant on daily basis such as number of calls, meetings set up by representatives, number of leads created, etc. Deliver an awe-inspiring pitch with this creative daily reports analysis of various sales representatives ppt inspiration design inspiration pdf bundle. Topics like opportunities, client conversations, meetings by sales can be discussed with this completely editable template. It is available for immediate download depending on the needs and requirements of the user.
Professional Scrum Master Training IT Risk Monitoring Dashboard For Software Development Projects Icons PDF
Following slide displays risk monitoring KPI dashboard that can be used by a firm to track multiple risk events. Metrics covered in the dashboard are residual risk by period and category by total risk rating. Deliver an awe inspiring pitch with this creative professional scrum master training it risk monitoring dashboard for software development projects icons pdf bundle. Topics like financial risk, people risk, governance risk, competitive risk, system or technology can be discussed with this completely editable template. It is available for immediate download depending on the needs and requirements of the user.

Retailing Approaches For Excellent End User Engagement And Experiences Analyzing Present Performance Delivery Gap Information PDF
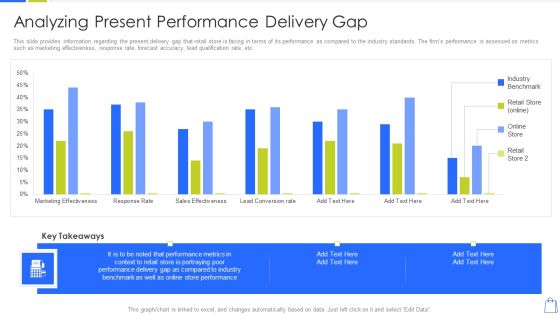
This slide provides information regarding the present delivery gap that retail store is facing in terms of its performance as compared to the industry standards. The firms performance is assessed on metrics such as marketing effectiveness, response rate, forecast accuracy, lead qualification rate, etc. Deliver an awe inspiring pitch with this creative retailing approaches for excellent end user engagement and experiences analyzing present performance delivery gap information pdf bundle. Topics like marketing effectiveness, sales effectiveness, lead conversion rate can be discussed with this completely editable template. It is available for immediate download depending on the needs and requirements of the user.
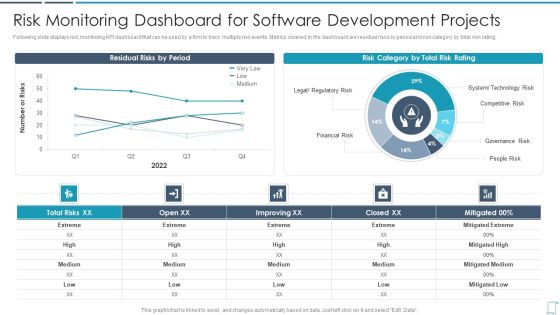
Professional Scrum Master Certification Training Program IT Risk Monitoring Dashboard Background PDF
Following slide displays risk monitoring KPI dashboard that can be used by a firm to track multiple risk events. Metrics covered in the dashboard are residual risks by period and risk category by total risk rating.Deliver an awe inspiring pitch with this creative professional scrum master certification training program it risk monitoring dashboard background pdf bundle. Topics like competitive risk, governance risk, people risk can be discussed with this completely editable template. It is available for immediate download depending on the needs and requirements of the user.
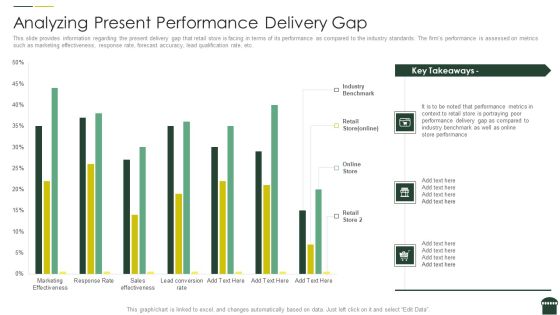
Transforming Physical Retail Outlet Analyzing Present Performance Delivery Gap Introduction PDF
This slide provides information regarding the present delivery gap that retail store is facing in terms of its performance as compared to the industry standards. The firms performance is assessed on metrics such as marketing effectiveness, response rate, forecast accuracy, lead qualification rate, etc. Deliver an awe inspiring pitch with this creative transforming physical retail outlet analyzing present performance delivery gap introduction pdf bundle. Topics like industry, performance, retail can be discussed with this completely editable template. It is available for immediate download depending on the needs and requirements of the user.
Redefining Experiential Retail Marketing Analyzing Present Performance Delivery Gap Microsoft PDF
This slide provides information regarding the present delivery gap that retail store is facing in terms of its performance as compared to the industry standards. The firms performance is assessed on metrics such as marketing effectiveness, response rate, forecast accuracy, lead qualification rate, etc. Deliver and pitch your topic in the best possible manner with this redefining experiential retail marketing analyzing present performance delivery gap microsoft pdf. Use them to share invaluable insights on analyzing present performance delivery gap and impress your audience. This template can be altered and modified as per your expectations. So, grab it now.
Professional Scrum Master Certification Risk Monitoring Dashboard For Software Development Portrait PDF
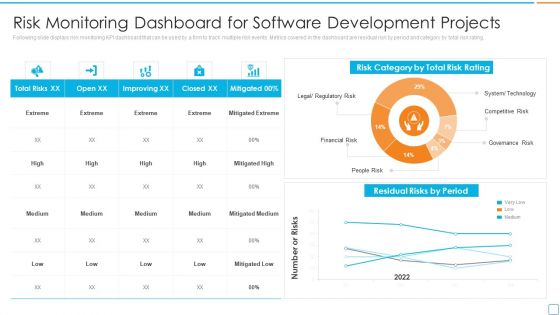
Following slide displays risk monitoring KPI dashboard that can be used by a firm to track multiple risk events. Metrics covered in the dashboard are residual risk by period and category by total risk rating. Deliver an awe inspiring pitch with this creative professional scrum master certification risk monitoring dashboard for software development portrait pdf bundle. Topics like residual risks by period, risk category, total risk rating can be discussed with this completely editable template. It is available for immediate download depending on the needs and requirements of the user.

Professional Scrum Master Risk Monitoring Dashboard For Software Development Projects Designs PDF
Following slide displays risk monitoring KPI dashboard that can be used by a firm to track multiple risk events. Metrics covered in the dashboard are residual risk by period and category by total risk rating. Deliver an awe inspiring pitch with this creative Professional Scrum Master Risk Monitoring Dashboard For Software Development Projects Designs PDF bundle. Topics like Residual Risks By Period, Risk Category By Total Risk Rating, Total Risks can be discussed with this completely editable template. It is available for immediate download depending on the needs and requirements of the user.
Consumer Journey Mapping Techniques Online Ad Campaign Performance Tracking Dashboard Topics PDF
This slide covers the KPI dashboard for measuring digital campaign results. It includes metrics such as Ad cost, clicks, impressions, CTR, cost per click, conversions, conversion rate, cost per click, cost per thousand impressions, etc. Showcasing this set of slides titled Consumer Journey Mapping Techniques Online Ad Campaign Performance Tracking Dashboard Topics PDF. The topics addressed in these templates are Conversation Rate, Cost Per Conversion. All the content presented in this PPT design is completely editable. Download it and make adjustments in color, background, font etc. as per your unique business setting.
Public Relations Guide To Enhance Brand Credibility KPI Dashboard To Track PR Marketing Performance Diagrams PDF
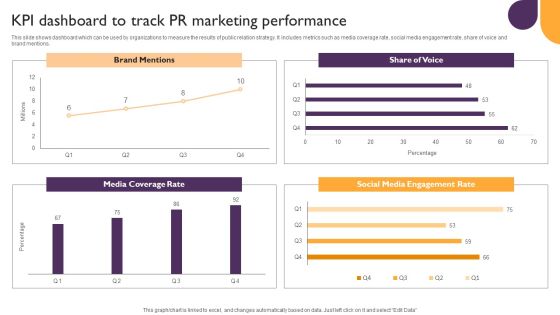
This slide shows dashboard which can be used by organizations to measure the results of public relation strategy. It includes metrics such as media coverage rate, social media engagement rate, share of voice and brand mentions. Make sure to capture your audiences attention in your business displays with our gratis customizable Public Relations Guide To Enhance Brand Credibility KPI Dashboard To Track PR Marketing Performance Diagrams PDF. These are great for business strategies, office conferences, capital raising or task suggestions. If you desire to acquire more customers for your tech business and ensure they stay satisfied, create your own sales presentation with these plain slides.

Online PR Techniques To Boost Brands Online Visibility KPI Dashboard To Track PR Marketing Summary PDF
This slide shows dashboard which can be used by organizations to measure the results of public relation strategy. It includes metrics such as media coverage rate, social media engagement rate, share of voice and brand mentions. Make sure to capture your audiences attention in your business displays with our gratis customizable Online PR Techniques To Boost Brands Online Visibility KPI Dashboard To Track PR Marketing Summary PDF. These are great for business strategies, office conferences, capital raising or task suggestions. If you desire to acquire more customers for your tech business and ensure they stay satisfied, create your own sales presentation with these plain slides.

New Service Launch And Development Strategy To Gain Market Share Marketing Channels For Content Elements PDF
This slide showcases marketing channels that can help organization to distribute the content for new service promotion and acquiring new subscribers. Its key components are channels, content type, target KPIs and metrics to measure.Deliver an awe inspiring pitch with this creative New Service Launch And Development Strategy To Gain Market Share Marketing Channels For Content Elements PDF bundle. Topics like Influencer Outreach, Social Media, Brand Awareness can be discussed with this completely editable template. It is available for immediate download depending on the needs and requirements of the user.
Ppt Go Green PowerPoint Presentation Table Listing Its Factors Components Templates
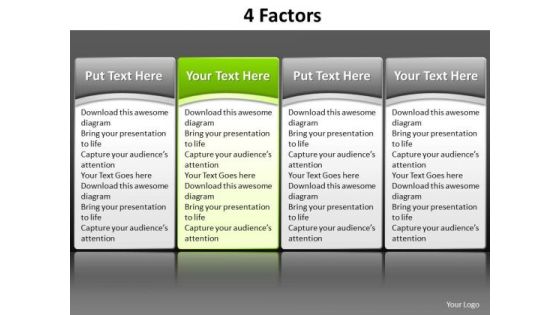
PPT go green powerpoint presentation table listing its factors components Templates-Use this Table diagram to show activities that are related to the business plan metrics and monitor the results to determine if the business plan is proceeding as planned.-Can be used for presentations on abstract, advertising, art, backdrop, background, banner, blue, booklet, breadboard, brochure, business, card, celebrate, circle, colorful, commerce, cover, creative, decor, design, digital, element, empty, finance, form, funky, glowing, graphic, illustration, layout, line, list, model, modern, page, pattern, pink, poster, print, red, shiny, style, template, title, trendy, vector, wallpaper, web, yellow-PPT go green powerpoint presentation table listing its factors components Templates

Ppt Pink PowerPoint Presentation Table Listing Its Factors Components Templates
PPT pink powerpoint presentation table listing its factors components Templates-Use this Table diagram to show activities that are related to the business plan metrics and monitor the results to determine if the business plan is proceeding as planned. This Pink Table illustrates the concept of Tabular Method.-Can be used for presentations on banner, bar, box, bullet, button, clean, cool, creative, design, editable, elements, empty, eps8, glossy, gradient, gray, green, hosting, interface, label, list, menu, metallic, modern, navigation, object, order, plan, price, red, select, shiny, sidebar, simple, site, sticker, style, support, tab, tariff, template, transparent, vector, web, webdesign, webpage, website, www, yellow-PPT pink powerpoint presentation table listing its factors components Templates

Ppt Red Table Listing Its Factors Components PowerPoint Templates
PPT red table listing its factors components PowerPoint Templates-Use this Table diagram to show activities that are related to the business plan metrics and monitor the results to determine if the business plan is proceeding as planned. This Red Table illustrates the concept of Tabular Method.-Can be used for presentations on advertise,amount, badge, banner, bill, blank, business, button, cart, checklist, column, costing, counting, currency, descriptive, design, discount, element, empty, gradient, grid, hosting, illustration, isolated, list, message, nobody, pricing, rectangle, red-PPT red table listing its factors components PowerPoint Templates
Ppt Red White And Blue PowerPoint Theme Table Listing Its Factors Components Templates
PPT red white and blue powerpoint theme table listing its factors components Templates-Use this Table diagram to show activities that are related to the business plan metrics and monitor the results to determine if the business plan is proceeding as planned. This Blue Table illustrates the concept of Tabular Method.-Can be used for presentations on advertise,amount, badge, banner, bill, blank, business, button, cart, checklist, column, costing, counting, currency, descriptive, design, discount, element, empty, gradient, grid, hosting, illustration, isolated, list, message, nobody, pricing, rectangle, red-PPT red white and blue powerpoint theme table listing its factors components Templates
Ppt Purple Men Standing On Free Concept Pie PowerPoint Presentation Chart Templates
PPT purple men standing on free concept pie powerpoint presentation chart Templates-Use this Circular Arrow diagram to show activities that are related to the business plan metrics and monitor the results to determine if the business plan is proceeding as planned.-PPT purple men standing on free concept pie powerpoint presentation chart Templates-3d, arrow, background, blue, chart, circle, circular, clipart, colorful, connection, continuity, cycle, cyclic, diagram, direction, flow, graph, icon, illustration, isolated, loop, motion, process, progress, recycle, ring, round, step, sticker, symbol, teamwork, template, turn, vector
Ppt Go Green Layouts PowerPoint Free And Orange Arrow 9 Stages Templates
PPT go green layouts powerpoint free and orange arrow 9 stages Templates-Use this Curved Arrows diagram to show activities that are related to the business plan metrics and monitor the results to determine if the business plan is proceeding as planned. Our PPT images are so perfectly designed that it reveals the very basis of our PPT diagrams and are an effective tool to make your clients understand.-PPT go green layouts powerpoint free and orange arrow 9 stages Templates-Arrow, Background, Process, Business, Chart, Diagram, Financial, Graphic, Gray, Icon, Illustration, Management, Orange, Perspective, Process, Reflection, 9 Stages, Steps, Text, Transparency

Ppt Team Effort Person Standing Yellow Piece Of Chart PowerPoint Ks2 Templates
PPT team effort person standing yellow piece of chart PowerPoint ks2 Templates-Use this Circular Arrow diagram to show activities that are related to the business plan metrics and monitor the results to determine if the business plan is proceeding as planned. You can apply other 3D Styles and shapes to the slide to enhance your presentations.-PPT team effort person standing yellow piece of chart PowerPoint ks2 Templates-arrow, bar, business, businessman, candidate, cartoon, character, chart, circle, circular, client, communication, company, concept, diagram, finance, financial, flow, growth, human, illustration, increase, information, iteration, man, market, marketing, process, processing, profit, sales, statistics, stats, success, target

KPI Dashboard Highlighting Off Page Seo Performance Rules PDF
The purpose of this template is to outline KPI reporting dashboard showing results of off page SEO. The dashboard covers key metrics such as website ranking on search engine, traffic, sessions, backlinks and site audit. Showcasing this set of slides titled kpi dashboard highlighting off page seo performance rules pdf. The topics addressed in these templates are kpi dashboard highlighting off page seo performance. All the content presented in this PPT design is completely editable. Download it and make adjustments in color, background, font etc. as per your unique business setting.
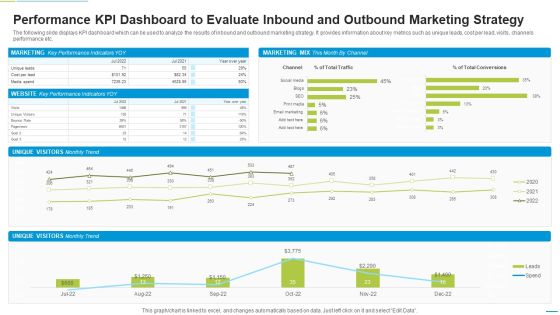
Performance KPI Dashboard To Evaluate Inbound And Outbound Marketing Strategy Mockup PDF
The following slide displays KPI dashboard which can be used to analyze the results of inbound and outbound marketing strategy. It provides information about key metrics such as unique leads, cost per lead, visits, channels performance etc. Showcasing this set of slides titled Performance KPI Dashboard To Evaluate Inbound And Outbound Marketing Strategy Mockup PDF. The topics addressed in these templates are Marketing, Unique Visitors, Cost Per Lead. All the content presented in this PPT design is completely editable. Download it and make adjustments in color, background, font etc. as per your unique business setting.

Supply Chain Approaches Why Do We Needsupply Chain Modelling Diagrams PDF
This slide shows the need of supply chain modelling which includes greater stock control, greater efficiency and reduces costs, greater accuracy in supply chain logistics, etc.Presenting Supply Chain Approaches Why Do We Needsupply Chain Modelling Diagrams PDF to provide visual cues and insights. Share and navigate important information on three stages that need your due attention. This template can be used to pitch topics like Determining Require, Inventory Level According, Metrics Resulting. In addtion, this PPT design contains high resolution images, graphics, etc, that are easily editable and available for immediate download.

Consumer Journey Mapping Techniques Loyalty Program Performance Tracking Dashboard Portrait PDF
This slide covers the KPI dashboard for analyzing customer loyalty campaign results. It includes metrics such as revenue, liability, NQP accrued, transaction count, members, redemption ratio, etc. Pitch your topic with ease and precision using this Consumer Journey Mapping Techniques Loyalty Program Performance Tracking Dashboard Portrait PDF. This layout presents information on Transaction Count, Revenue, Redemption Ratio. It is also available for immediate download and adjustment. So, changes can be made in the color, design, graphics or any other component to create a unique layout.
Consumer Journey Mapping Techniques Referral Program Performance Tracking Dashboard Formats PDF
This slide covers the KPI dashboard for analyzing referral campaign results. It includes metrics such as total revenue generated, monthly recurring revenue, new customers, clicks, cancelled customers, paying customers, etc. Showcasing this set of slides titled Consumer Journey Mapping Techniques Referral Program Performance Tracking Dashboard Formats PDF. The topics addressed in these templates are Revenue, New Customers, Paying Customers. All the content presented in this PPT design is completely editable. Download it and make adjustments in color, background, font etc. as per your unique business setting.

Customer Demand Creation Maturity Model Stages Ppt Layouts Graphic Tips PDF
This slide covers the maturity model stages of demand generation on various basis orientation, leadership, tools, budget and metrics for building reliable brand awareness and interest which result in high-quality leads. The stages involved are undefined, progressive, mature and world class. Pitch your topic with ease and precision using this Customer Demand Creation Maturity Model Stages Ppt Layouts Graphic Tips PDF. This layout presents information on Demand Generation, Orientation, Leadership. It is also available for immediate download and adjustment. So, changes can be made in the color, design, graphics or any other component to create a unique layout.
Loyalty Program Performance Tracking Dashboard Consumer Contact Point Guide Demonstration PDF
This slide covers the KPI dashboard for analyzing customer loyalty campaign results. It includes metrics such as revenue, liability, NQP accrued, transaction count, members, redemption ratio, etc. Find a pre-designed and impeccable Loyalty Program Performance Tracking Dashboard Consumer Contact Point Guide Demonstration PDF. The templates can ace your presentation without additional effort. You can download these easy-to-edit presentation templates to make your presentation stand out from others. So, what are you waiting for Download the template from Slidegeeks today and give a unique touch to your presentation.

Comprehensive Guide To Acquire Customers Email Marketing Campaigns Performance Analysis Themes PDF
This slide covers an email marketing activity tracking sheet for understanding how subscribers react to the campaign and improve it depending on the results. It includes evaluation metrics such as open rate, click-through rate, click-to-open rate, unsubscribe rate, and spam rate. If your project calls for a presentation, then Slidegeeks is your go-to partner because we have professionally designed, easy-to-edit templates that are perfect for any presentation. After downloading, you can easily edit Comprehensive Guide To Acquire Customers Email Marketing Campaigns Performance Analysis Themes PDF and make the changes accordingly. You can rearrange slides or fill them with different images. Check out all the handy templates.

Change Readiness Analysis Of Various Departments Portrait PDF
The following slide outlines a heatmap to assess each department multiple times over a time period for conforming whether there is deterioration or improvement in readiness to change. It covers departments and metrics to calculate overall results. Persuade your audience using this Change Readiness Analysis Of Various Departments Portrait PDF. This PPT design covers one stage, thus making it a great tool to use. It also caters to a variety of topics including Change Awareness, Change Acceptance, Overall Preparation. Download this PPT design now to present a convincing pitch that not only emphasizes the topic but also showcases your presentation skills.
Tracking Social Media Digital Promotional Campaign Plan Rules PDF
The slide showcases an outline of social media campaign to increase brand advocacy and awareness and help track and analyze the outcomes of the campaigns success. It covers aspects such as buyer journey stage, objectives, social strategy, initiatives, metrics and results. Pitch your topic with ease and precision using this Tracking Social Media Digital Promotional Campaign Plan Rules PDF. This layout presents information on Awareness, Consideration, Adoption. It is also available for immediate download and adjustment. So, changes can be made in the color, design, graphics or any other component to create a unique layout.
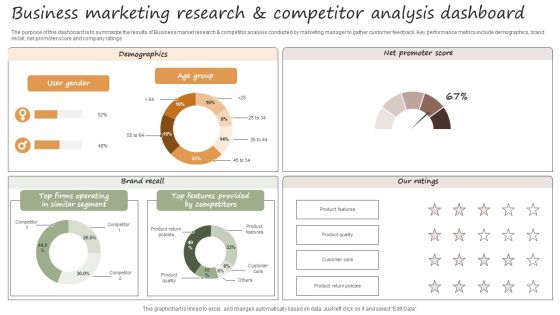
Usiness Marketing Research And Competitor Analysis Dashboard Sample PDF
The purpose of this dashboard is to summarize the results of Business market research and competitor analysis conducted by marketing manager to gather customer feedback. Key performance metrics include demographics, brand recall, net promoter score and company ratings. Showcasing this set of slides titled Usiness Marketing Research And Competitor Analysis Dashboard Sample PDF. The topics addressed in these templates are Brand Recall, Demographics, Net Promoter Score. All the content presented in this PPT design is completely editable. Download it and make adjustments in color, background, font etc. as per your unique business setting.

Key Parameters For Customer Behavior Analytics Ppt Infographics Summary PDF
The following slide showcases key metrics to analyze customer buying pattern to help firm understand behavior of consumer and expand their target audience. Main indicators covered are place, items, time and frequency of purchase. Pitch your topic with ease and precision using this Key Parameters For Customer Behavior Analytics Ppt Infographics Summary PDF. This layout presents information on Demographics, Engagement, Purchase. It is also available for immediate download and adjustment. So, changes can be made in the color, design, graphics or any other component to create a unique layout.
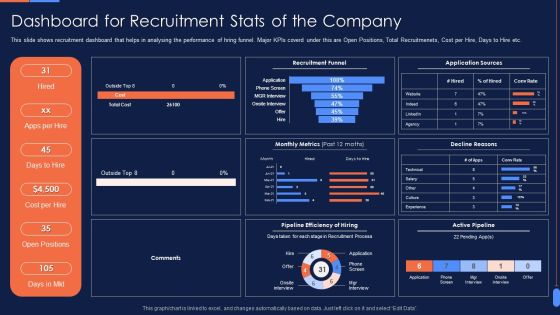
Recruitment Training To Optimize Dashboard For Recruitment Stats Of The Company Structure PDF
This slide shows recruitment dashboard that helps in analysing the performance of hring funnel. Major KPIs coverd under this are Open Positions, Total Recruitmenets, Cost per Hire, Days to Hire etc. Deliver an awe inspiring pitch with this creative Recruitment Training To Optimize Dashboard For Recruitment Stats Of The Company Structure PDF bundle. Topics like Cost Per Hire, Open Positions, Apps Per Hire, Pipeline Efficiency Of Hiring, Monthly Metrics can be discussed with this completely editable template. It is available for immediate download depending on the needs and requirements of the user.

Effective Company Event Communication Plan Email Marketing Action Steps And Best Practices Information PDF
This slide covers metrics for analyzing the event revenue and registrations. It includes KPIs such as gross revenue, gross revenue from promos, total refund, total registration, visits to purchase conversion, check-in- status, etc. Deliver and pitch your topic in the best possible manner with this Effective Company Event Communication Plan Email Marketing Action Steps And Best Practices Information PDF Use them to share invaluable insights on Registration Analysis, Revenue Analysis, Gross Revenue and impress your audience. This template can be altered and modified as per your expectations. So, grab it now.
 Home
Home