Productivity Improvement

Column Chart Ppt PowerPoint Presentation Infographic Template Graphic Images
This is a column chart ppt powerpoint presentation infographic template graphic images. This is a nine stage process. The stages in this process are business, marketing, growth, product, management.
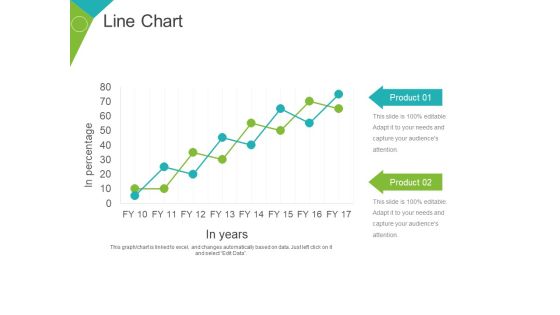
Line Chart Ppt PowerPoint Presentation Gallery Objects
This is a line chart ppt powerpoint presentation gallery objects. This is a two stage process. The stages in this process are product, business, marketing, growth, in years, in percentage.

Area Chart Ppt PowerPoint Presentation Inspiration Slide Download
This is a area chart ppt powerpoint presentation inspiration slide download. This is a two stage process. The stages in this process are product, in percentage, business, growth, strategy, finance.

Area Chart Ppt PowerPoint Presentation File Graphic Tips
This is a area chart ppt powerpoint presentation file graphic tips. This is a two stage process. The stages in this process are product, in percentage, financial year, business, growth.
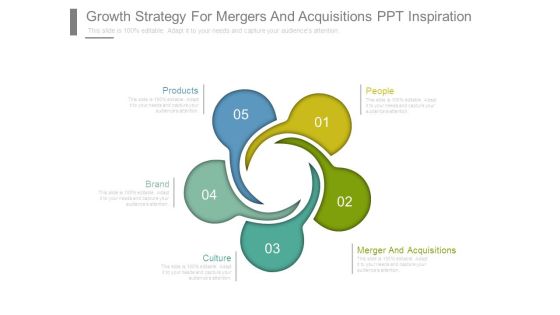
Growth Strategy For Mergers And Acquisitions Ppt Inspiration
This is a growth strategy for mergers and acquisitions ppt inspiration. This is a five stage process. The stages in this process are products, people, brand, culture, merger and acquisitions.
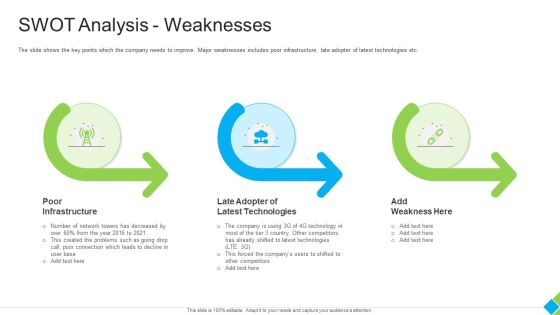
Diminishing Market Share Of A Telecommunication Firm Case Competition Swot Analysis Weaknesses Graphics PDF
The slide shows the key points which the company needs to improve. Major weaknesses includes poor infrastructure, late adopter of latest technologies etc. Presenting diminishing market share of a telecommunication firm case competition swot analysis weaknesses graphics pdf to provide visual cues and insights. Share and navigate important information on three stages that need your due attention. This template can be used to pitch topics like poor infrastructure, late adopter of latest technologies, weakness. In addtion, this PPT design contains high resolution images, graphics, etc, that are easily editable and available for immediate download.

Lowering Sales Revenue A Telecommunication Firm Case Competition SWOT Analysis Weaknesses Ideas PDF
The slide shows the key points which the company needs to improve. Major weaknesses includes poor infrastructure, late adopter of latest technologies etc. This is a lowering sales revenue a telecommunication firm case competition SWOt analysis weaknesses ideas pdf template with various stages. Focus and dispense information on three stages using this creative set, that comes with editable features. It contains large content boxes to add your information on topics like SWOT analysis weaknesses. You can also showcase facts, figures, and other relevant content using this PPT layout. Grab it now.
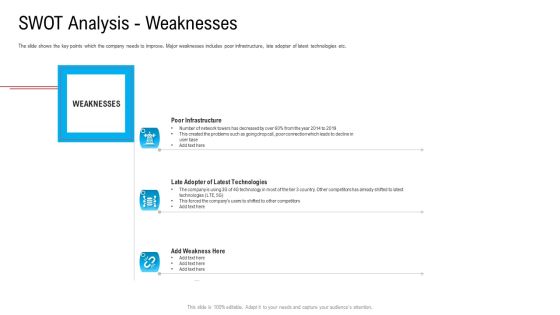
Substandard Network Infrastructure A Telecommunication Firm Case Competition SWOT Analysis Weaknesses Portrait PDF
The slide shows the key points which the company needs to improve. Major weaknesses includes poor infrastructure, late adopter of latest technologies etc. This is a substandard network infrastructure a telecommunication firm case competition SWOT analysis weaknesses portrait pdf template with various stages. Focus and dispense information on three stages using this creative set, that comes with editable features. It contains large content boxes to add your information on topics like SWOT analysis weaknesses, technologies, weaknesses. You can also showcase facts, figures, and other relevant content using this PPT layout. Grab it now.

Vehicle Sales Plunge In An Automobile Firm Swot Analysis Weaknesses Information PDF
The slide shows the key points which the company needs to improve. Major weaknesses includes vehicles recalls, decline in cash and cash equivalent etc. Presenting vehicle sales plunge in an automobile firm swot analysis weaknesses information pdf to provide visual cues and insights. Share and navigate important information on three stages that need your due attention. This template can be used to pitch topics like vehicle recalls, decline in cash and cash equivalent, weaknes. In addtion, this PPT design contains high resolution images, graphics, etc, that are easily editable and available for immediate download.

SBU Management Planning Process Ppt PowerPoint Presentation Styles Icons PDF
The following slide showcases the complete planning process for a business unit to adapt according to the needs of the market conditions. It includes business mission, SWOT analysis, goal, strategy, program formulation and implementation along with feedback and control. Presenting SBU Management Planning Process Ppt PowerPoint Presentation Styles Icons PDF to dispense important information. This template comprises one stage. It also presents valuable insights into the topics including Economic Environment, Technological Improvements, Political Instability. This is a completely customizable PowerPoint theme that can be put to use immediately. So, download it and address the topic impactfully.

Taking Steps For Achieving Career Goals Powerpoint Presentation
This is a taking steps for achieving career goals powerpoint presentation. This is a three stage process. The stages in this process are success, portfolio, management, stair, business.

Standards Development Process Template Powerpoint Presentation
This is a standards development process template powerpoint presentation. This is a five stage process. The stages in this process are specific requirement, framework document, function, preliminary analysis, product.

Key Business Partners Guide To Enhance Organic Growth By Advancing Business Procedures Guidelines PDF
Purpose of the following slide is to show key business partners of the organization as it highlights the various partners, the description of their partnership level, the Industry in which they work and the cost of doing business with them.Presenting Key Business Partners Guide To Enhance Organic Growth By Advancing Business Procedures Guidelines PDF to provide visual cues and insights. Share and navigate important information on one stage that need your due attention. This template can be used to pitch topics like Maintenances Partnership, Vendor Partnership, Electronic Products. In addtion, this PPT design contains high resolution images, graphics, etc, that are easily editable and available for immediate download.

Client Specific Progress Assessment Customer Feedback Ppt Infographics Graphics Example PDF
Presenting this set of slides with name client specific progress assessment customer feedback ppt infographics graphics example pdf. The topics discussed in these slides are management, accurately, punctuality. This is a completely editable PowerPoint presentation and is available for immediate download. Download now and impress your audience.

Business Procedure Proficiency Diagram Powerpoint Slide Themes
This is a business procedure proficiency diagram powerpoint slide themes. This is a five stage process. The stages in this process are resources, leadership, operations, shared vision, shared goals.
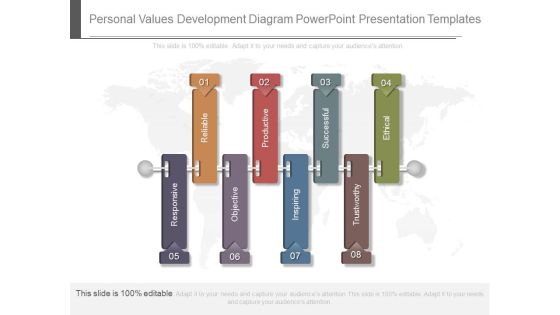
Personal Values Development Diagram Powerpoint Presentation Templates
This is a personal values development diagram powerpoint presentation templates. This is a eight stage process. The stages in this process are reliable, productive, successful, ethical, responsive, objective, inspiring, trustworthy.
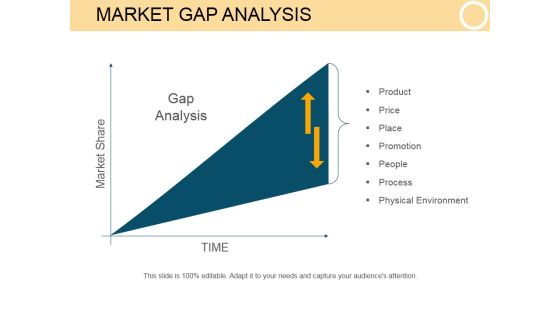
Market Gap Analysis Template 1 Ppt PowerPoint Presentation Information
This is a market gap analysis template 1 ppt powerpoint presentation information. This is a one stage process. The stages in this process are product, price, place, promotion, people, process, physical environment.

PowerPoint Theme Growth Circular Process Ppt Slide
PowerPoint Theme Growth Circular Process PPT Slide-Highlight the key components of your entire manufacturing/ business process. Illustrate how each element flows seamlessly onto the next stage. Emphasise on any critical or key factors within them. Demonstrate how they all combine to form the final product.-PowerPoint Theme Growth Circular Process PPT Slide

Internet Marketing Playbook Our Key Strengths And Opportunities Demonstration PDF
This is a Internet Marketing Playbook Our Key Strengths And Opportunities Demonstration PDF template with various stages. Focus and dispense information on four stages using this creative set, that comes with editable features. It contains large content boxes to add your information on topics like Good Reputation Customers, Service Responsiveness Product, Emergence Substitute Products. You can also showcase facts, figures, and other relevant content using this PPT layout. Grab it now.

Fiscal Procedure Developments Diagram Powerpoint Slides
This is a fiscal procedure developments diagram powerpoint slides. This is a eight stage process. The stages in this process are nature, customers, workers, prices, bank rate, moral suasion, lending rates, products.

Area Chart Ppt PowerPoint Presentation Topics
This is a area chart ppt powerpoint presentation topics. This is a two stage process. The stages in this process are product, in percentage, jan, feb, mar, apr, may.

Column Chart Ppt PowerPoint Presentation Show
This is a column chart ppt powerpoint presentation show. This is a six stage process. The stages in this process are product, in percentage, jan, feb, mar, apr, may.
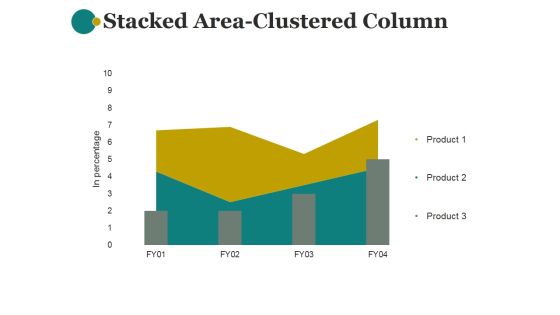
Stacked Area Clustered Column Ppt PowerPoint Presentation Layout
This is a stacked area clustered column ppt powerpoint presentation layout. This is a two stage process. The stages in this process are in percentage, product, business, marketing, management.

Volume Open High Low Close Chart Ppt PowerPoint Presentation Show
This is a volume open high low close chart ppt powerpoint presentation show. This is a five stage process. The stages in this process are product, marketing, business, management, strategy.

Clustered Column Ppt PowerPoint Presentation File Designs Download
This is a clustered column ppt powerpoint presentation file designs download. This is a six stage process. The stages in this process are dollars in thousands, financial year, product.
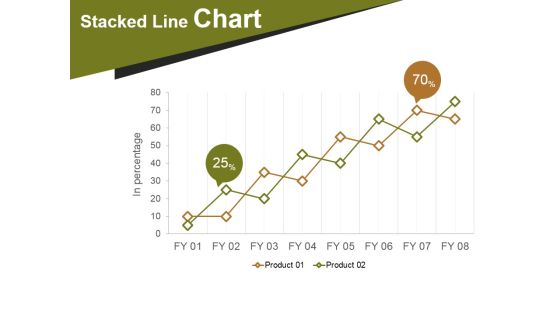
Stacked Line Chart Template 2 Ppt PowerPoint Presentation Rules
This is a stacked line chart template 2 ppt powerpoint presentation rules. This is a two stage process. The stages in this process are stacked line chart, in percentage, product.

Targeting Strategy Ppt PowerPoint Presentation Layouts Files
This is a targeting strategy ppt powerpoint presentation layouts files. This is a four stage process. The stages in this process are target market, product, undifferentiated, differentiated, concentrated, micro marketing.

Line Chart Ppt PowerPoint Presentation Model Design Templates
This is a line chart ppt powerpoint presentation model design templates. This is a two stage process. The stages in this process are sales in percentage, financial years, product.

Area Chart Ppt PowerPoint Presentation Professional Designs
This is a area chart ppt powerpoint presentation professional designs. This is a two stage process. The stages in this process are in percentage, product, in years, strategy, business, marketing.

Combo Chart Ppt PowerPoint Presentation Infographic Template Brochure
This is a combo chart ppt powerpoint presentation infographic template brochure. This is a eight stage process. The stages in this process are product, market size, strategy, business, marketing.

Line Chart Ppt PowerPoint Presentation Layouts Professional
This is a line chart ppt powerpoint presentation layouts professional. This is a two stage process. The stages in this process are in percentage, product, in years, strategy, marketing, business.

Stacked Line Ppt PowerPoint Presentation Summary File Formats
This is a stacked line ppt powerpoint presentation summary file formats. This is a three stage process. The stages in this process are product, revenue in percentage, strategy, business, marketing.
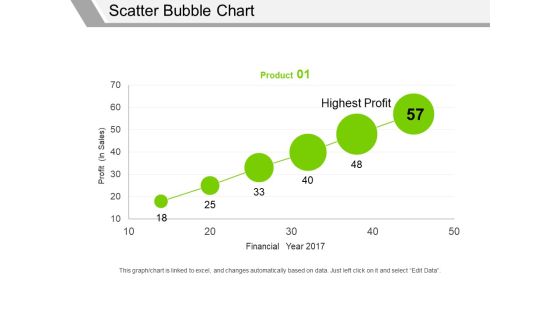
Scatter Bubble Chart Ppt PowerPoint Presentation Professional Graphics Pictures
This is a scatter bubble chart ppt powerpoint presentation professional graphics pictures. This is a one stage process. The stages in this process are profit in sales, financial year, highest profit, product.

Bar Graph Template 1 Ppt PowerPoint Presentation Slides Format Ideas
This is a bar graph template 1 ppt powerpoint presentation slides format ideas. This is a three stage process. The stages in this process are product, years, bar graph, business, marketing.

Column Chart Ppt PowerPoint Presentation Layouts Ideas
This is a column chart ppt powerpoint presentation layouts ideas. This is a two stage process. The stages in this process are dollars in thousands, strategy, business, graph, product.

Combo Chart Ppt PowerPoint Presentation Infographics Introduction
This is a combo chart ppt powerpoint presentation infographics introduction. This is a three stage process. The stages in this process are profit in percentage, business, graph, strategy, product.

Column Chart Ppt PowerPoint Presentation Summary Graphics
This is a column chart ppt powerpoint presentation summary graphics. This is a nine stage process. The stages in this process are product, years, expenditure in billions, graph, business.

Combo Chart Ppt PowerPoint Presentation Summary Layouts
This is a combo chart ppt powerpoint presentation summary layouts. This is a eight stage process. The stages in this process are product, sales in percentage, in years, in price, graph.

Line Chart Ppt PowerPoint Presentation Show Background Designs
This is a line chart ppt powerpoint presentation show background designs. This is a two stage process. The stages in this process are product, in months, in percentage, business.

Scatter Chart Ppt PowerPoint Presentation Ideas Templates
This is a scatter chart ppt powerpoint presentation ideas templates. This is a nine stage process. The stages in this process are y values, x values, product, graph, business.

Clustered Column Line Ppt PowerPoint Presentation Inspiration Layouts
This is a clustered column line ppt powerpoint presentation inspiration layouts. This is a four stage process. The stages in this process are in percentage, product, business, strategy, graph.

Scatter Chart Ppt PowerPoint Presentation Summary Smartart
This is a scatter chart ppt powerpoint presentation summary smartart. This is a nine stage process. The stages in this process are y values, x values, product, business, graph.

Stacked Column Ppt PowerPoint Presentation Professional Template
This is a stacked column ppt powerpoint presentation professional template. This is a nine stage process. The stages in this process are product, profit million dollars, business, marketing, graph.

Stacked Line With Marker Ppt PowerPoint Presentation Professional Pictures
This is a stacked line with marker ppt powerpoint presentation professional pictures. This is a twelve stage process. The stages in this process are product, profit in thousands, business, graph, marketing.
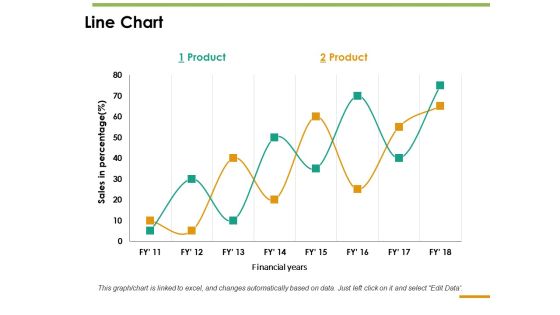
Line Chart Ppt PowerPoint Presentation Inspiration Guide
This is a line chart ppt powerpoint presentation inspiration guide. This is a two stage process. The stages in this process are line chart, sales in percentage, product, financial years.
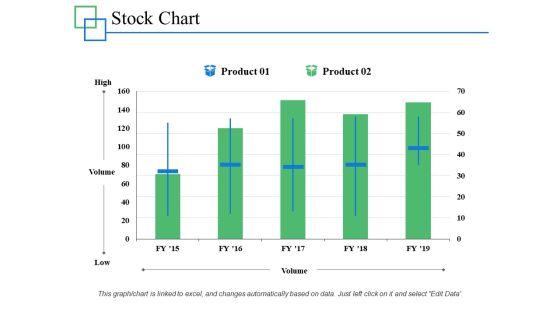
Stock Chart Management Investment Ppt PowerPoint Presentation Infographics Professional
This is a stock chart management investment ppt powerpoint presentation infographics professional. This is a two stage process. The stages in this process are marketing, business, management, percentage, product.

Column Chart Finance Marketing Ppt PowerPoint Presentation Model Example Introduction
This is a column chart finance marketing ppt powerpoint presentation model example introduction. This is a two stage process. The stages in this process are business, management, marketing, percentage, product.
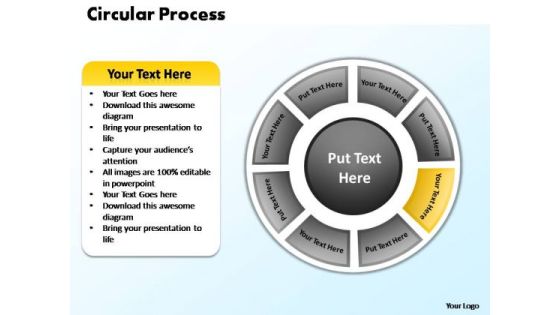
PowerPoint Slides Growth Circular Process Ppt Presentation
PowerPoint Slides Growth Circular Process PPT Presentation-Highlight the key components of your entire manufacturing/ business process. Illustrate how each element flows seamlessly onto the next stage. Emphasise on any critical or key factors within them. Demonstrate how they all combine to form the final product.-PowerPoint Slides Growth Circular Process PPT Presentation
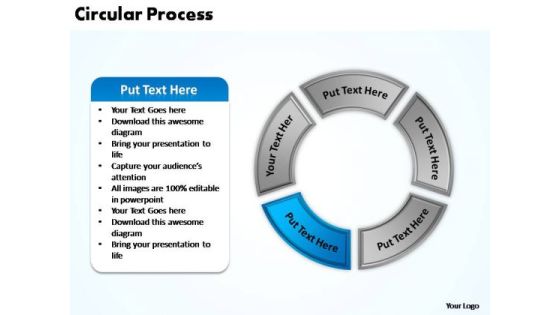
PowerPoint Slide Growth Circular Process Ppt Template
PowerPoint_Slide_Growth_Circular_Process_PPT_Template Business Power Points-Highlight the key components of your entire manufacturing/ business process. Illustrate how each element flows seamlessly onto the next stage. Emphasise on any critical or key factors within them. Demonstrate how they all combine to form the final product.-PowerPoint_Slide_Growth_Circular_Process_PPT_Template Business Power Points

New Service Launch Plan Marketing Assessment Ppt Gallery Background PDF
Deliver and pitch your topic in the best possible manner with this new service launch plan marketing assessment ppt gallery background pdf. Use them to share invaluable insights on product, positioning, target market, product, development and impress your audience. This template can be altered and modified as per your expectations. So, grab it now.

Integrated Supply Support With Order Processing Ppt Infographic Template Ideas PDF
Showcasing this set of slides titled integrated supply support with order processing ppt infographic template ideas pdf. The topics addressed in these templates are production, transport, product, marketing, advertisement. All the content presented in this PPT design is completely editable. Download it and make adjustments in color, background, font etc. as per your unique business setting.

5 Arrow Goals And Objectives For Work Management Ppt PowerPoint Presentation Example File
This is a 5 arrow goals and objectives for work management ppt powerpoint presentation example file. This is a five stage process. The stages in this process are programmer for strategic objectives, systems and solutions, operation of solution, business plan, business marketing.

Quality Management Ethics Ppt PowerPoint Presentation Graphics
This is a quality management ethics ppt powerpoint presentation graphics. This is a four stage process. The stages in this process are defective products, substandard service, poor designs, substandard, substandard parts and materials in the boxes.

3 Year Roadmap For Organizational Growth Strategy Elements PDF
This slide showcases three year timeline for organizational growth strategies that Can help company to achieve coordination among departments and avoiding future uncertainties. Its key components are sales, marketing and product. Persuade your audience using this 3 Year Roadmap For Organizational Growth Strategy Elements PDF. This PPT design covers Four stages, thus making it a great tool to use. It also caters to a variety of topics including Sales, Marketing, Product. Download this PPT design now to present a convincing pitch that not only emphasizes the topic but also showcases your presentation skills.

Clustered Column Line Ppt PowerPoint Presentation Gallery Graphics Example
This is a clustered column line ppt powerpoint presentation gallery graphics example. This is a four stage process. The stages in this process are product, growth, success, business, marketing.

Clustered Column Line Ppt PowerPoint Presentation Show Influencers
This is a clustered column line ppt powerpoint presentation show influencers. This is a four stage process. The stages in this process are financial year, sales in percentage, product, growth, success.

Stacked Area Clustered Column Ppt PowerPoint Presentation Show Guidelines
This is a stacked area clustered column ppt powerpoint presentation show guidelines. This is a four stage process. The stages in this process are in percentage, product, bar graph, growth, success.

Stacked Area Clustered Column Ppt PowerPoint Presentation Inspiration Shapes
This is a stacked area clustered column ppt powerpoint presentation inspiration shapes. This is a four stage process. The stages in this process are in percentage, product, growth, success, graph.
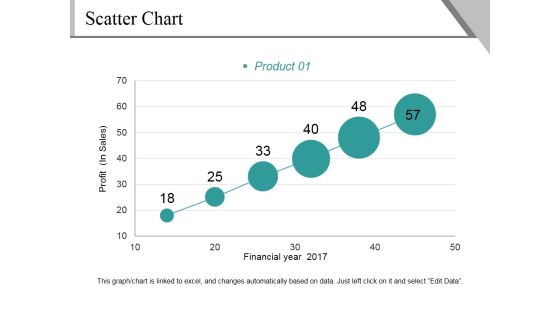
Scatter Chart Ppt PowerPoint Presentation File Background Image
This is a scatter chart ppt powerpoint presentation file background image. This is a six stage process. The stages in this process are profit, financial year, product, growth, success.

Area Chart Ppt PowerPoint Presentation Infographics Visual Aids
This is a area chart ppt powerpoint presentation infographics visual aids. This is a two stage process. The stages in this process are product, area chart, in percentage, growth, success.
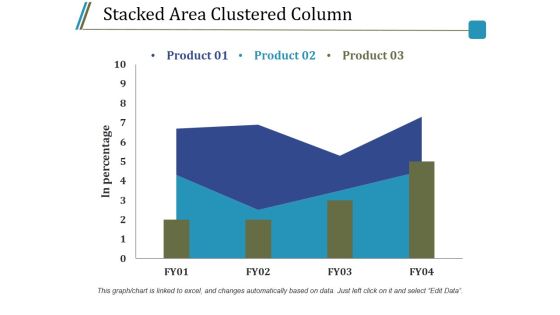
Stacked Area Clustered Column Ppt PowerPoint Presentation Model Guidelines
This is a stacked area clustered column ppt powerpoint presentation model guidelines. This is a three stage process. The stages in this process are product, in percentage, bar graph, growth, success.

Area Chart Ppt PowerPoint Presentation Infographic Template Layout
This is a area chart ppt powerpoint presentation infographic template layout. This is a two stage process. The stages in this process are product, profit, area chart, growth, success.
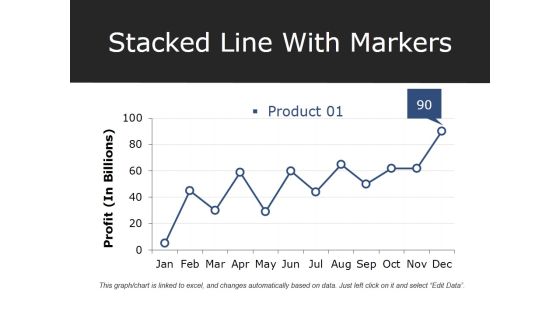
Stacked Line With Markers Ppt PowerPoint Presentation Professional Deck
This is a stacked line with markers ppt powerpoint presentation professional deck. This is a one stage process. The stages in this process are product, profit, growth, success, graph.

Line Chart Ppt PowerPoint Presentation Professional Graphics Design
This is a line chart ppt powerpoint presentation professional graphics design. This is a two stage process. The stages in this process are financial years, sales in percentage, product, growth, success.
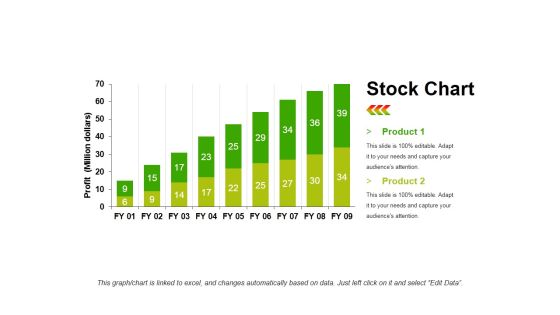
Stock Chart Template 1 Ppt PowerPoint Presentation Infographic Template Objects
This is a stock chart template 1 ppt powerpoint presentation infographic template objects. This is a two stage process. The stages in this process are product, profit, bar graph, growth, success.

Stacked Area Clustered Column Ppt PowerPoint Presentation File Background Designs
This is a stacked area clustered column ppt powerpoint presentation file background designs. This is a three stage process. The stages in this process are product, in percentage, growth, success, bar graph.

Stacked Area Clustered Column Ppt PowerPoint Presentation Summary Professional
This is a stacked area clustered column ppt powerpoint presentation summary professional. This is a three stage process. The stages in this process are product, bar graph, growth, success, in percentage.
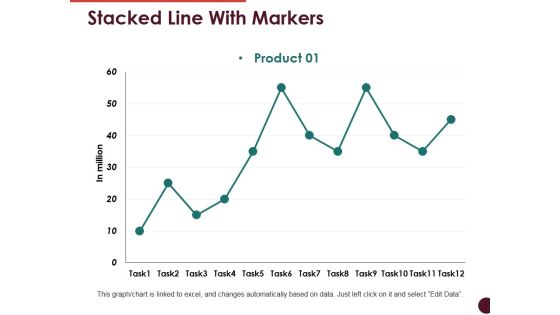
Stacked Line With Markers Ppt PowerPoint Presentation Show Templates
This is a stacked line with markers ppt powerpoint presentation show templates. This is a one stage process. The stages in this process are product, bar graph, growth, success, business.

Line Chart Ppt PowerPoint Presentation Layouts Example
This is a line chart ppt powerpoint presentation layouts example. This is a two stage process. The stages in this process are sales in percentage, product, financial years, growth, success.
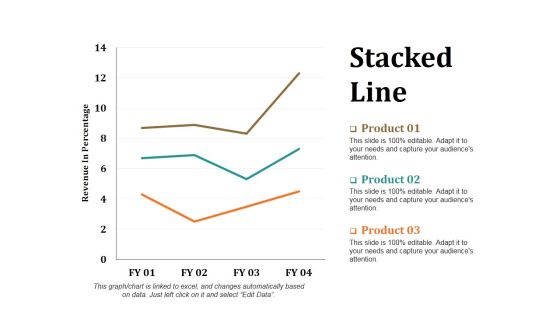
Stacked Line Ppt PowerPoint Presentation Layouts Portrait
This is a stacked line ppt powerpoint presentation layouts portrait. This is a three stage process. The stages in this process are revenue in percentage, stacked line, product, growth, success.

Clustered Column Line Ppt PowerPoint Presentation Summary Background Image
This is a clustered column line ppt powerpoint presentation summary background image. This is a four stage process. The stages in this process are in percentage, product, graph, growth, success.

Column Chart Ppt PowerPoint Presentation Model Clipart Images
This is a column chart ppt powerpoint presentation model clipart images. This is a two stage process. The stages in this process are product, bar graph, growth, success, business.

Line Chart Ppt PowerPoint Presentation File Example File
This is a line chart ppt powerpoint presentation file example file. This is a two stage process. The stages in this process are product, in percentage, in years, growth, success.

Scatter Chart Ppt PowerPoint Presentation Ideas Designs Download
This is a scatter chart ppt powerpoint presentation ideas designs download. This is a one stage process. The stages in this process are product, dollar, in percentage, growth, success.
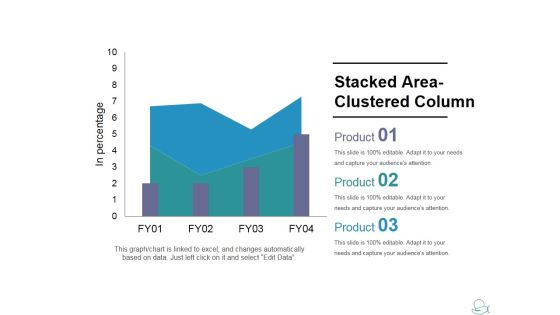
Stacked Area Clustered Column Ppt PowerPoint Presentation Slides Shapes
This is a stacked area clustered column ppt powerpoint presentation slides shapes. This is a three stage process. The stages in this process are product, growth, success graph, business.

Column Chart Ppt PowerPoint Presentation Layouts Background Images
This is a column chart ppt powerpoint presentation layouts background images. This is a two stage process. The stages in this process are product, in months, graph, growth, success.
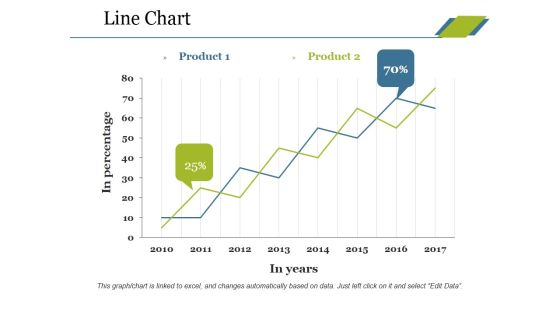
Line Chart Ppt PowerPoint Presentation Professional Tips
This is a line chart ppt powerpoint presentation professional tips. This is a two stage process. The stages in this process are product, in percentage, in years, growth, success.

Bubble Chart Ppt PowerPoint Presentation Inspiration Graphics Download
This is a bubble chart ppt powerpoint presentation inspiration graphics download. This is a three stage process. The stages in this process are product, growth, success, bubble chart, business.

Combo Chart Ppt PowerPoint Presentation Inspiration Slide Portrait
This is a combo chart ppt powerpoint presentation inspiration slide portrait. This is a three stage process. The stages in this process are product, market size, bar chart, growth, success.

Line Chart Ppt PowerPoint Presentation Slides Ideas
This is a line chart ppt powerpoint presentation slides ideas. This is a two stage process. The stages in this process are product, in percentage, in years, growth, success.

Clustered Column Line Ppt PowerPoint Presentation Pictures Example
This is a clustered column line ppt powerpoint presentation pictures example. This is a three stage process. The stages in this process are product, in percentage, bar graph, growth, success.

Column Chart Ppt PowerPoint Presentation Styles Graphics Design
This is a column chart ppt powerpoint presentation styles graphics design. This is a two stage process. The stages in this process are expenditure in, product, years, growth, success.
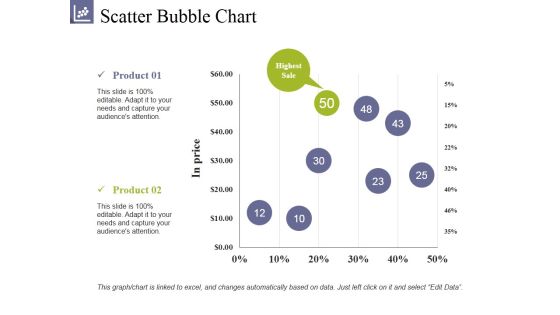
Scatter Bubble Chart Ppt PowerPoint Presentation Summary Clipart
This is a scatter bubble chart ppt powerpoint presentation summary clipart. This is a two stage process. The stages in this process are product, highest sale, in prices, growth, success.

Area Chart Ppt PowerPoint Presentation Infographic Template Model
This is a area chart ppt powerpoint presentation infographic template model. This is a two stage process. The stages in this process are product, area chart, growth, percentage, success.

Ppt Linear Abstraction Arrow Animated Graph PowerPoint 2007 Templates
PPT linear abstraction arrow animated graph powerpoint 2007 Templates-Use this diagram to show a progression or sequential steps in a task, process, or workflow. They help to lay the base of your trend of thought and enhance the essence of your viable ideas. Create captivating presentations to deliver comparative and weighted arguments.-PPT linear abstraction arrow animated graph powerpoint 2007 Templates-analysis, arrow, background, business, chart, communication, concept, construction, delivery, design, development, engineering, fabrication, feasibiliti, generated, growth, idea, industry, making, production, products, science, sequence, shape

Ansoff Matrix For Growth Strategy Ppt PowerPoint Presentation Slides Gallery
This is a ansoff matrix for growth strategy ppt powerpoint presentation slides gallery. This is a four stage process. The stages in this process are current, new, products, growth strategies, markets.
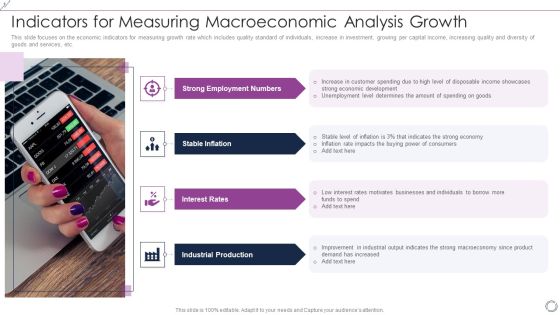
Indicators For Measuring Macroeconomic Analysis Growth Slides PDF
This slide focuses on the economic indicators for measuring growth rate which includes quality standard of individuals, increase in investment, growing per capital income, increasing quality and diversity of goods and services, etc. PresentingIndicators For Measuring Macroeconomic Analysis Growth Slides PDF to dispense important information. This template comprises four stages. It also presents valuable insights into the topics including Strong Employment Numbers, Stable Inflation, Interest Rates, Industrial Production. This is a completely customizable PowerPoint theme that can be put to use immediately. So, download it and address the topic impactfully.

combo chart template 2 ppt powerpoint presentation background images
This is a combo chart template 2 ppt powerpoint presentation background images. This is a four stage process. The stages in this process are business, marketing, finance, timeline, product.
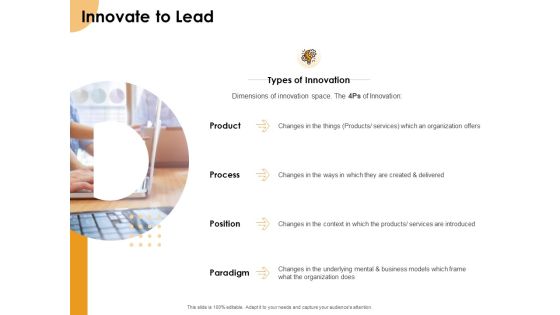
Growth Strategy And Growth Management Implementation Innovate To Lead Ppt Portfolio Gallery PDF
Presenting this set of slides with name growth strategy and growth management implementation innovate to lead ppt portfolio gallery pdf. This is a one stage process. The stages in this process are product, process, position, paradigm, innovation. This is a completely editable PowerPoint presentation and is available for immediate download. Download now and impress your audience.

Effective Brand Positioning Template Powerpoint Ideas
This is a effective brand positioning template powerpoint ideas. This is a four stage process. The stages in this process are positioning, product, promotion, price, distribution, premium, prestige, intensive, selective, low price, fun, basic, durable, powerful, value, exclusive.

Area Chart Ppt PowerPoint Presentation Show Layout Ideas
This is a area chart ppt powerpoint presentation show layout ideas. This is a two stage process. The stages in this process are product, in percentage, financial year, growth.

Bar Graph Ppt PowerPoint Presentation Ideas Graphic Tips
This is a bar graph ppt powerpoint presentation ideas graphic tips. This is a three stage process. The stages in this process are financial year, sales in percentage, product, bar graph, growth.

Area Chart Ppt PowerPoint Presentation Infographic Template Samples
This is a area chart ppt powerpoint presentation infographic template samples. This is a two stage process. The stages in this process are in percentage product, business, marketing, growth.
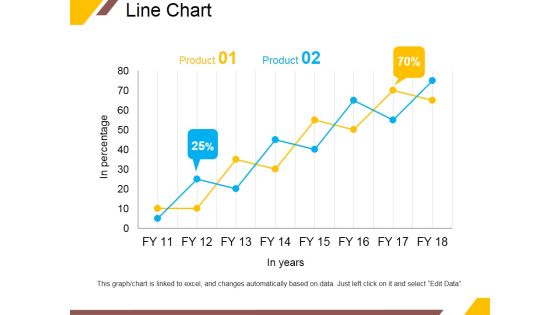
Line Chart Ppt PowerPoint Presentation Portfolio Infographic Template
This is a line chart ppt powerpoint presentation portfolio infographic template. This is a two stage process. The stages in this process are product, in years, business, percentage, growth.
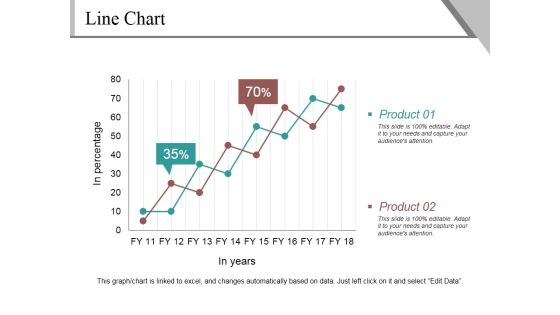
Line Chart Ppt PowerPoint Presentation Infographics Example
This is a line chart ppt powerpoint presentation infographics example. This is a two stage process. The stages in this process are product, in percentage, in years, finance, growth.
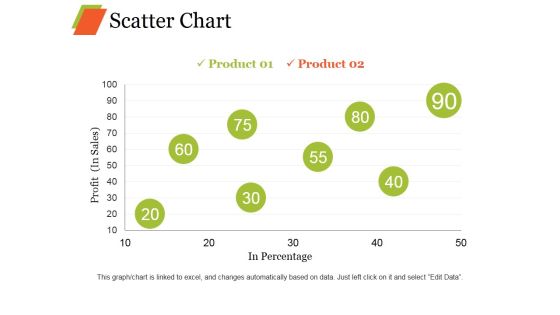
Scatter Chart Ppt PowerPoint Presentation Professional Graphic Images
This is a scatter chart ppt powerpoint presentation professional graphic images. This is a eight stage process. The stages in this process are product, profit, in percentage growth, business.
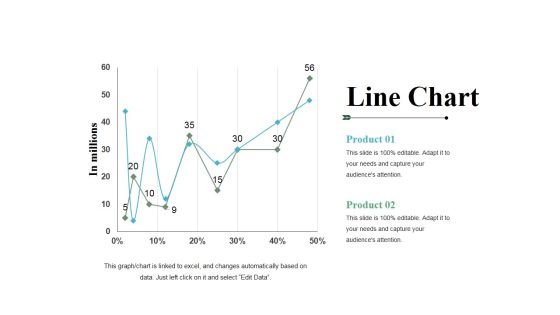
Line Chart Ppt PowerPoint Presentation File Templates
This is a line chart ppt powerpoint presentation file templates. This is a two stage process. The stages in this process are product, line chart, growth, percentage, in millions.

Clustered Column Template 2 Ppt PowerPoint Presentation Summary Smartart
This is a clustered column template 2 ppt powerpoint presentation summary smartart. This is a two stage process. The stages in this process are product, bar graph, in percentage, clustered column, growth.
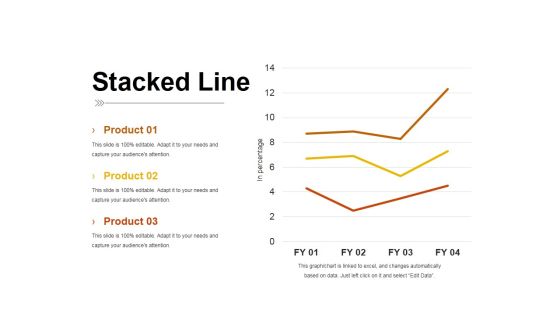
Stacked Line Ppt PowerPoint Presentation Inspiration Pictures
This is a stacked line ppt powerpoint presentation inspiration pictures. This is a three stage process. The stages in this process are product, stacked line, in percentage, business, growth.

Combo Chart Ppt PowerPoint Presentation Slides Show
This is a combo chart ppt powerpoint presentation slides show. This is a three stage process. The stages in this process are combo chart, market size, product, bar graph, growth.
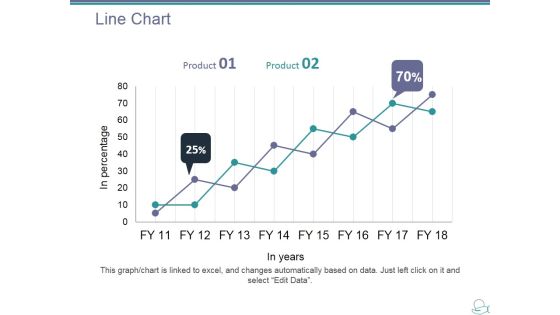
Line Chart Ppt PowerPoint Presentation Layouts Show
This is a line chart ppt powerpoint presentation layouts show. This is a two stage process. The stages in this process are product, in years, in percentage, line chart, growth.

Column Chart Ppt PowerPoint Presentation Gallery Slide Portrait
This is a column chart ppt powerpoint presentation gallery slide portrait. This is a two stage process. The stages in this process are sales in percentage, financial year, product, bar graph, growth.

Column Chart Ppt PowerPoint Presentation Ideas Vector
This is a column chart ppt powerpoint presentation ideas vector. This is a two stage process. The stages in this process are column chart, product, financial years, sales in percentage, growth.

Scatter With Smooth Lines And Markers Ppt PowerPoint Presentation Pictures Deck
This is a scatter with smooth lines and markers ppt powerpoint presentation pictures deck. This is a three stage process. The stages in this process are product, finance, management, business, growth.

Bubble Chart Ppt PowerPoint Presentation Infographic Template Layouts
This is a bubble chart ppt powerpoint presentation infographic template layouts. This is a two stage process. The stages in this process are bubble chart, product, sales in percentage, growth.

Column Chart Ppt PowerPoint Presentation Gallery Background Images
This is a column chart ppt powerpoint presentation gallery background images. This is a two stage process. The stages in this process are column chart, product, year, growth, expenditure.

Column Chart Ppt PowerPoint Presentation Slides Show
This is a column chart ppt powerpoint presentation slides show. This is a two stage process. The stages in this process are column chart, product, sales in percentage, financial year, growth.
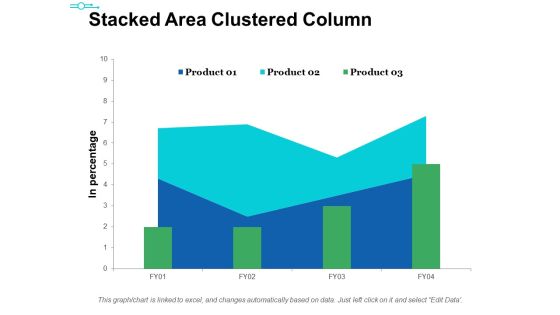
Stacked Area Clustered Column Ppt PowerPoint Presentation Ideas Themes
This is a stacked area clustered column ppt powerpoint presentation ideas themes. This is a three stage process. The stages in this process are product, in percentage, bar graph, area chart, growth.
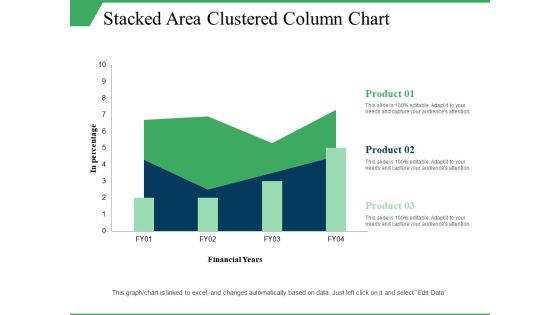
Stacked Area Clustered Column Chart Ppt PowerPoint Presentation Visual Aids Model
This is a stacked area clustered column chart ppt powerpoint presentation visual aids model. This is a three stage process. The stages in this process are in percentage, product, financial years, growth, column chart.

Combo Chart Ppt PowerPoint Presentation Summary Graphic Images
This is a combo chart ppt powerpoint presentation summary graphic images. This is a three stage process. The stages in this process are combo chart, product, growth, marketing, business.

Stacked Column Chart Ppt PowerPoint Presentation Summary Gallery
This is a stacked column chart ppt powerpoint presentation summary gallery. This is a two stage process. The stages in this process are stacked column chart, product, in years, growth, percentage.
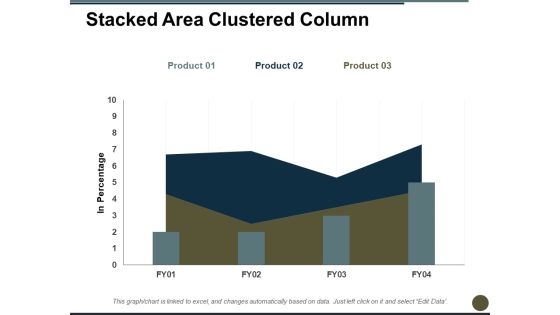
Stacked Area Clustered Column Ppt PowerPoint Presentation Professional Graphics
This is a stacked area clustered column ppt powerpoint presentation professional graphics. This is a three stage process. The stages in this process are in percentage, bar chart, product, growth, year.

Our Positioning Ppt PowerPoint Presentation Gallery
This is a our positioning ppt powerpoint presentation gallery. This is a three stage process. The stages in this process are new markets, existing markets, possible dimension, best product, best price, service, quality, choice.

Market Competition Ppt PowerPoint Presentation Styles Gallery
This is a market competition ppt powerpoint presentation styles gallery. This is a four stage process. The stages in this process are parameters, quality, bolt on products, likely competitors, possible competitors.
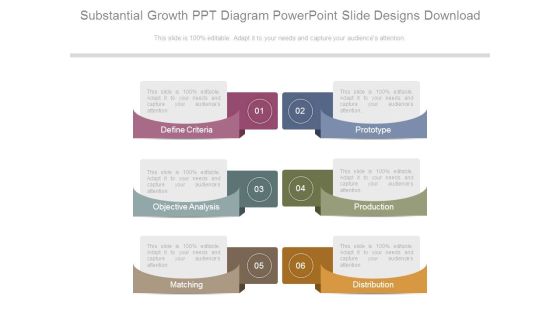
Substantial Growth Ppt Diagram Powerpoint Slide Designs Download
This is a substantial growth ppt diagram powerpoint slide designs download. This is a six stage process. The stages in this process are define criteria, prototype, objective analysis, production, matching, distribution.

Core Competencies Value Chain Strategy Ppt Example
This is a core competencies value chain strategy ppt example. This is a four stage process. The stages in this process are gear wheels, business, and marketing.
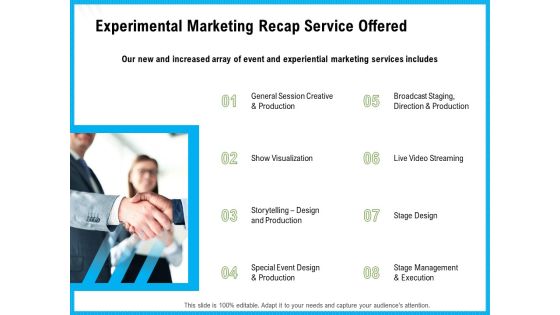
Experimental Marketing Recap Service Offered Ppt Infographic Template Influencers PDF
This is a experimental marketing recap service offered ppt infographic template influencers pdf template with various stages. Focus and dispense information on eight stages using this creative set, that comes with editable features. It contains large content boxes to add your information on topics like special event design and production, general session creative and production, stage design, stage management and execution. You can also showcase facts, figures, and other relevant content using this PPT layout. Grab it now.
Turning Customer Feedback Into Results Icon Ppt PowerPoint Presentation Styles Layouts PDF
Presenting this set of slides with name turning customer feedback into results icon ppt powerpoint presentation styles layouts pdf. The topics discussed in these slides are turning customer feedback into results icon. This is a completely editable PowerPoint presentation and is available for immediate download. Download now and impress your audience.
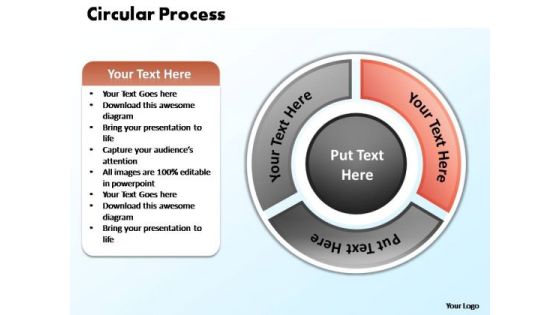
PowerPoint Template Success Circular Process Ppt Slide
Highlight the key components of your entire manufacturing/ business process. Illustrate how each element flows seamlessly onto the next stage. Emphasise on any critical or key factors within them. Demonstrate how they all combine to form the final product.

PowerPoint Templates Success Circular Process Ppt Layouts
Highlight the key components of your entire manufacturing/ business process. Illustrate how each element flows seamlessly onto the next stage. Emphasise on any critical or key factors within them. Demonstrate how they all combine to form the final product.


 Continue with Email

 Home
Home


