Product Solution
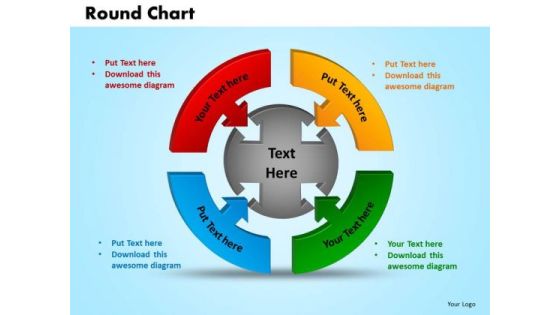
PowerPoint Presentation Round Chart Sales Ppt Themes
PowerPoint Presentation Round Chart Sales PPT Themes-This PowerPoint Diagram represents the Round Sales Chart in which four different approaches which results in one common Outcome. It Imitates the concept of Teamwork as they are inter-related to each other.-PowerPoint Presentation Round Chart Sales PPT Themes
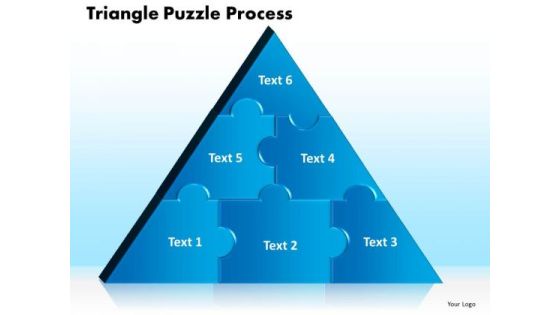
PowerPoint Slides Triangle Puzzle Process Ppt Slides
PowerPoint Slides Triangle Puzzle Process PPT Slides-This PowerPoint Diagram shows you the Triangle formed by the Jigsaw puzzles. This Diagram can be used to describe six different methods which are used to give one result. This PowerPoint Diagram will fit for Business presentations.-PowerPoint Slides Triangle Puzzle Process PPT Slides

PowerPoint Theme Ring Chart Diagram Business Ppt Slides
PowerPoint Theme Ring Chart Diagram Business PPT Slides-Use this Ring diagram to show activities that are related to the business plan metrics and monitor the results to determine if the business plan is proceeding as planned.-PowerPoint Theme Ring Chart Diagram Business PPT Slides

PowerPoint Theme Round Chart Marketing Ppt Slides
PowerPoint Theme Round Chart Marketing PPT Slides-This Diagram shows you the eight factors responsible for economic growth in Business .It can be used for creating Business presentations where four factors combined to result in one factor.-PowerPoint Theme Round Chart Marketing PPT Slides
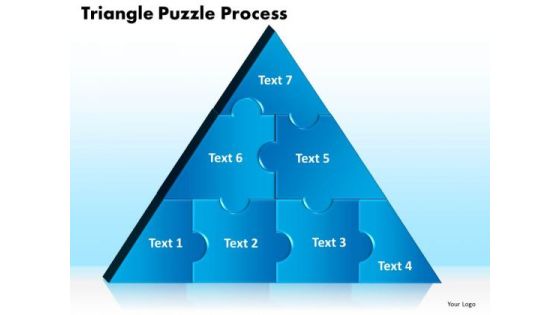
PowerPoint Template Triangle Puzzle Marketing Ppt Theme
PowerPoint Template Triangle Puzzle Marketing PPT Theme-This PowerPoint Diagram shows you the Triangle formed by placing together Jigsaw puzzles. This Diagram can be used to describe seven different methods which are combined to give one result. It portrays obscure, perplex, pose, profundicate, psych out, put off, rattle, snow, stir, stumble, stump, and throw.-PowerPoint Template Triangle Puzzle Marketing PPT Theme

PowerPoint Theme Triangle Puzzle Business Ppt Theme
PowerPoint Theme Triangle Puzzle Business PPT Theme-This PowerPoint Diagram shows you the Triangle formed by combining puzzle pieces. This Diagram can be used to describe five different methods which are combined to give one result. It portrays obscure, perplex, pose, profundicate, psych out, put off, rattle, snow, stir, stumble, stump, and throw.-PowerPoint Theme Triangle Puzzle Business PPT Theme

Business Charts PowerPoint Templates Process Missing Puzzle Piece 4 Stages
Business Charts PowerPoint templates process missing Puzzle piece 4 stages-Use this Business PowerPoint Diagram to explain the missing concept in a process. It signifies that if one out of the four stages is missing then it cannot result in completion and hence Success. This signifies Teamwork, Unity etc.-Business Charts PowerPoint templates process missing Puzzle piece 4 stages
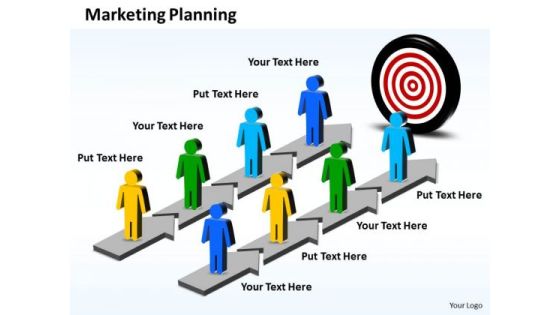
Ppt Parallel PowerPoint Slide Numbers Showing Marketing Planning Business Templates
PPT parallel powerpoint slide numbers showing marketing planning Business Templates-Use this PowerPoint Diagram to explain the parallel Processes for achieving results. It signifies alongside, coextending, coextensive, coordinate, and equidistant, extending equally, in the same direction, lateral, laterally, never meeting, running alongside. This PowerPoint Diagram will fit for Business Presentations.-PPT parallel powerpoint slide numbers showing marketing planning Business Templates
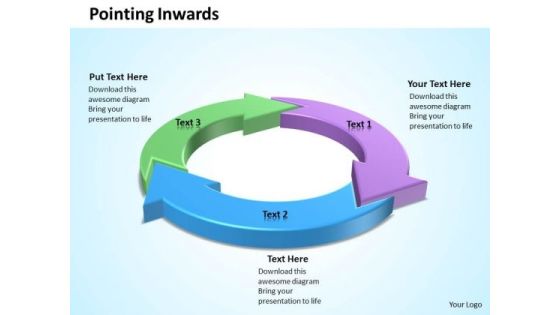
Ppt Interconnected Systems Arrows Pointing Inwards Circle PowerPoint Templates
PPT interconnected systems arrows pointing inwards circle PowerPoint Templates--PowerPoint presentations on Arrow, Background, Blue, Chart, Circle, Circular, Circulation, Clipart, Colorful, Connection, Continuity, Cycle, Cyclic, Diagram, Direction, Empty, Flow, Graph, Green, Icon, Illustration, Isolated, Loop, Motion, Pink, Presentation, Process, Progress, Reason, Recycle, Recycling, Repetition, Report, Result, Ring, Rotation, Round, Scheme, Section, Step, Sticker, Symbol-PPT interconnected systems arrows pointing inwards circle PowerPoint Templates

Business Editable PowerPoint Templates Business Beveled Column Chart Ppt Slides
Business Editable PowerPoint Templates Business beveled column chart PPT Slides-This PowerPoint slide is a data driven Columns Chart. The number of columns depend on the data.-Business Editable PowerPoint Templates Business beveled column chart PPT Slides-This ppt can be used for concepts relating to-chart,, graph, growth, investment, , market, percentage, , presentation report, results, statistics, stock, success and business.

Business Education PowerPoint Templates Business Bar Graph Data Driven Ppt Slides
Business Education PowerPoint Templates Business bar graph data driven PPT Slides-This PowerPoint slide is a data driven Columns Chart. The number of columns depend on the data.-Business Editable PowerPoint Templates Business beveled column chart PPT Slides-This ppt can be used for concepts relating to-chart,, graph, growth, investment, , market, percentage, , presentation report, results, statistics, stock, success and business.
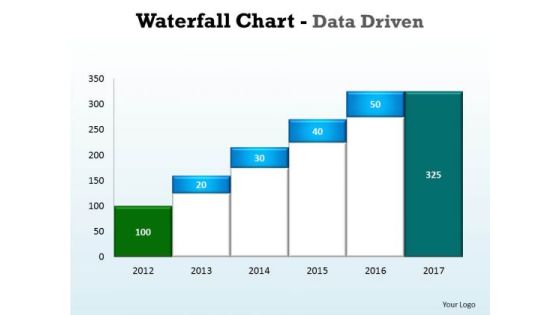
Business Graphic PowerPoint Templates Business Waterfall Chart Data Driven Ppt Slides
Business Graphic PowerPoint Templates Business waterfall chart data driven PPT Slides- This Water Fall chart can display continuous data over time, set against a common scale, and are therefore ideal for showing trends in data at equal intervals-This ppt can be used for concepts relating to-chart,, graph, growth, investment, , market, percentage, , presentation report, results, statistics, stock, success and business.
Mba Models And Frameworks Post It Notes Style 3 Consulting Diagram
Light The Fuse With Our MBA Models And Frameworks post it notes style 3 Consulting Diagram Powerpoint Templates. Blast The Audience With The Force Of Your Ideas. In Depth Analysis Of Situations Is Your Forte. Use Our MBA Models And Frameworks post it notes style 3 Consulting Diagram Powerpoint Templates To Acquaint Your Listeners With Your Results.

Business Diagram Pie Chart Showing Percentages Presentation Slide Template
This power point diagram template has been designed with graphic of pie chart with percentage values. Use this pie chart for result analysis display in any business presentation. Build an exclusive presentation for your viewers by using this professional diagram template.

Business Framework Kaiser Ideo Analysis Synthesis Bridge Model PowerPoint Presentation
This diagram displays Kaiser IDEO analysis synthesis bridge model. It contains circular diagram in four segments. The bridge model illustrates storytelling and analysis, brainstorming and concept generation, design research and data gathering, prototyping and concept generation. Use this model to frame research results to act as a basis for framing future possibilities.
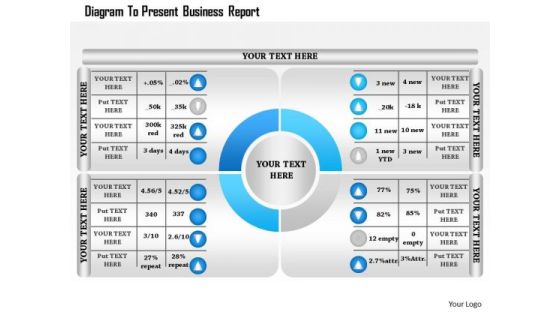
Business Diagram To Present Business Report Presentation Template
Four staged percentage personalized chart has been used to craft this power point template. This PPT contains the concept of data analysis and financial result analysis. This PPT can be used for your data and finance related topics in any business and marketing presentation.
Business Diagram Icons For Good Marketing Strategy Presentation Template
This power point template has been designed with graphic of bar graph, suitcase and meeting business icons. These business icons are used to display the concept of business result analysis and meeting. Use this diagram for business related topics in any presentations.

Identification Of The Purpose Of The Decision Ppt Sample
This is a identification of the purpose of the decision ppt sample. This is a five stage process. The stages in this process are information gathering, select the best alternative, principles for judging the alternatives, identification of the purpose of the decision, evaluate the result.
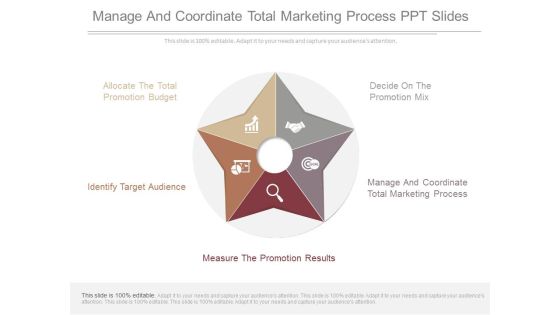
Manage And Coordinate Total Marketing Process Ppt Slides
This is a manage and coordinate total marketing process ppt slides. This is a five stage process. The stages in this process are allocate the total promotion budget, decide on the promotion mix, identify target audience, manage and coordinate total marketing process, measure the promotion results.
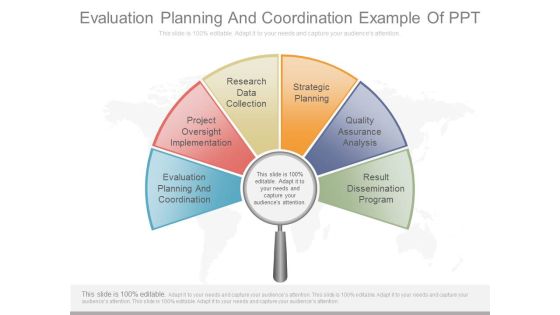
Evaluation Planning And Coordination Example Of Ppt
This is an evaluation planning and coordination example of ppt. This is a six stage process. The stages in this process are evaluation planning and coordination, project oversight implementation, project oversight implementation, strategic planning, quality assurance analysis, result dissemination program. \n \n
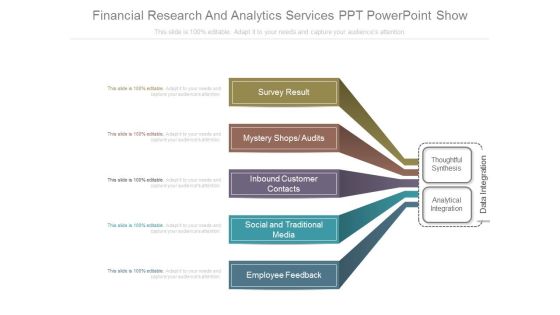
Financial Research And Analytics Services Ppt Powerpoint Show
This is a financial research and analytics services ppt powerpoint show. This is a five stage process. The stages in this process are survey result, mystery shops audits, inbound customer contacts, social and traditional media, employee feedback, thoughtful synthesis, analytical integration, data integration.

Sales Effectiveness Framework Good Ppt Example
This is a sales effectiveness framework good ppt example. This is a four stage process. The stages in this process are business and sales strategy, business results and sales force roi, right people with the right skills, focused on the right opportunities, sales effectiveness, highly engaged and motivated.

Monitors Development Of The Education System Ppt Design
This is a monitors development of the education system ppt design. This is a eleven stage process. The stages in this process are sector assessment, specific and measurable targets, comprehensive core values, prioritize and coordinate strategies, methods and tools to measure results, situational diagnosis, identify strategic issues, including values and principles.

Net Promoter Score Telecommunications Industry Ppt Powerpoint Show
This is a net promoter score telecommunications industry ppt powerpoint show. This is a seven stage process. The stages in this process are mobile data sets, voice sms data sets, nsp survey result, crm data, call data, device data, other data like care.
Anti Spam Law Diagram Ppt Powerpoint Ideas
This is a anti spam law diagram ppt powerpoint ideas. This is a one stage process. The stages in this process are sorting categorization, complaints, integration acetous, honeypot data, industry filings, cb, spam reporting center, opc, crtc, triage, joint action, warnings, results, tool choice, alerts.
B2b Go To Market Strategy Presentation Diagrams
This is a b2b go to market strategy presentation diagrams. This is a six stage process. The stages in this process are business objectives, research business and marketing environment, marketing objectives, marketing strategy, month by month marketing plan, measurement and analysis of results.

Customer Experience Success Ppt Presentation
This is a customer experience success ppt presentation. This is a four stage process. The stages in this process are voice of the customer, customer intelligence and clv, cx improvement and innovation, internal branding, branding, retention loyalty, business results, customer centricity.

Anatomy Af A Search Engine Optimization Ppt Presentation
This is a anatomy af a search engine optimization ppt presentation. This is a four stage process. The stages in this process are anatomy of a search engine, hide seek, noise from, location social time history trends, query, search result are unique for each user, score, index, crawl, found, signal is, predictive stable core principled usable.
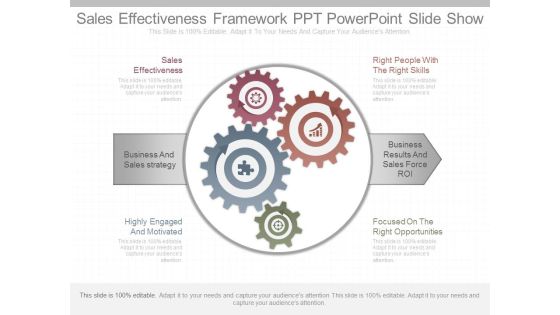
Sales Effectiveness Framework Ppt Powerpoint Slide Show
This is a sales effectiveness framework ppt powerpoint slide show. This is a four stage process. The stages in this process are sales effectiveness, right people with the right skills, business and sales strategy, business results and sales force roi, highly engaged and motivated, focused on the right opportunities.
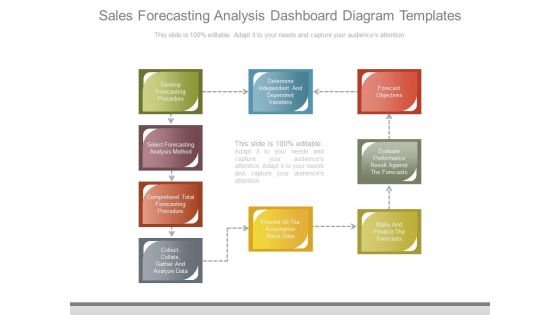
Sales Forecasting Analysis Dashboard Diagram Templates
This is a sales forecasting analysis dashboard diagram templates. This is a nine stage process. The stages in this process are develop forecasting procedure, select forecasting analysis method, comprehend total forecasting procedure, collect collate gather and analyze data, determine independent and dependent variables, present all the assumption about data, forecast objectives, evaluate performance result against the forecasts, make and finalize the forecasts.
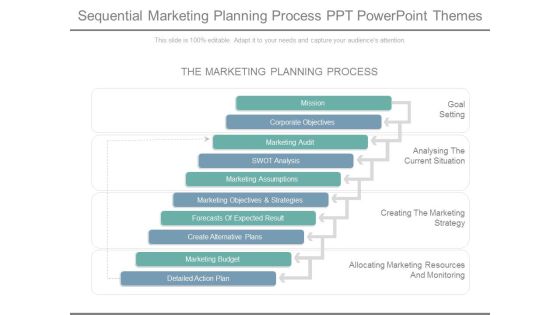
Sequential Marketing Planning Process Ppt Powerpoint Themes
This is a sequential marketing planning process ppt powerpoint themes. This is a ten stage process. The stages in this process are the marketing planning process, mission , corporate objectives , marketing audit, marketing assumptions , marketing objectives and strategies , forecasts of expected result.
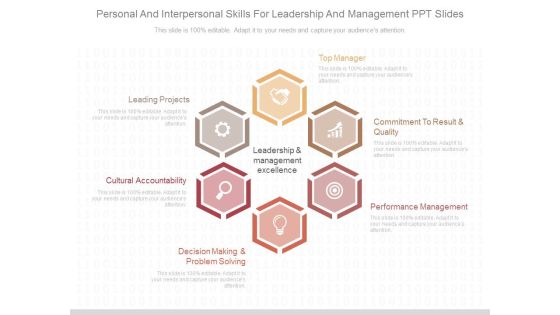
Personal And Interpersonal Skills For Leadership And Management Ppt Slides
This is a personal and interpersonal skills for leadership and management ppt slides. This is a six stage process. The stages in this process are leadership and management excellence, top manager, commitment to result and quality, performance management, decision making and problem solving, cultural accountability, leading projects.
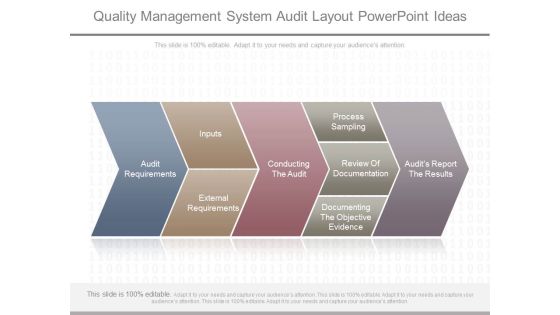
Quality Management System Audit Layout Powerpoint Ideas
This is a quality management system audit layout powerpoint ideas. This is a five stage process. The stages in this process are audit requirements, inputs, external requirements, conducting the audit, process sampling, review of documentation, documenting the objective evidence, audit report the results.
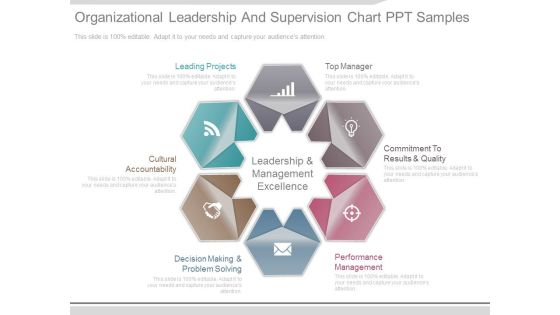
Organizational Leadership And Supervision Chart Ppt Samples
This is a organizational leadership and supervision chart ppt samples. This is a six stage process. The stages in this process are leading projects, top manager, commitment to results and quality, performance management, decision making and problem solving, cultural accountability, leadership and management excellence.

Skills Building For Effective Teams Example Powerpoint Graphics
This is a skills building for effective teams example powerpoint graphics. This is a three stage process. The stages in this process are operational domain, strategic domain, interpersonal domain, setting strategic direction, delivering results, building and sustainability relationships, creating alignment, team working, planning and organization, leading.

Data Visualization And Predictive Analysis Chart Ppt Slides
This is a data visualization and predictive analysis chart ppt slides. This is a nine stage process. The stages in this process are business requirement, data exploration, data selection, data preparation, design model, validate model, deploy model, analyze results, update model, revalidate.
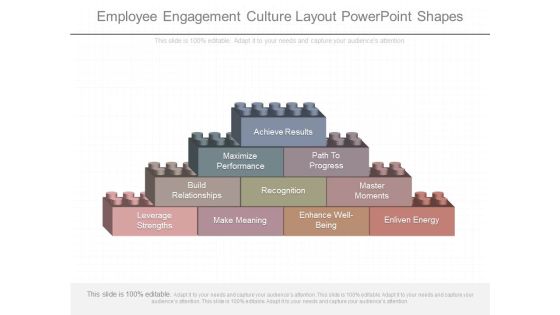
Employee Engagement Culture Layout Powerpoint Shapes
This is a employee engagement culture layout powerpoint shapes. This is a four stage process. The stages in this process are achieve results, maximize performance, path to progress, build relationships, recognition, master moments, leverage strengths, make meaning, enhance well being, enliven energy.

Business Excellence Framework Slide Information
This is a business excellence framework slide information. This is a four stage process. The stages in this process are mission and purpose, results, strategic systems, talent systems, conditions and external systems, talent systems, planning, governance, structure, people, culture, customers, stakeholders, external influences, work process, infrastructure.
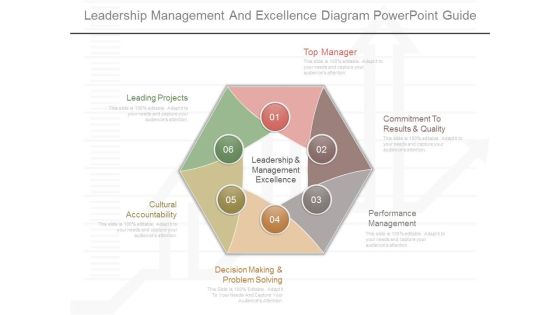
Leadership Management And Excellence Diagram Powerpoint Guide
This is a leadership management and excellence diagram powerpoint guide. This is a six stage process. The stages in this process are leading projects, cultural accountability, decision making and problem solving, performance management, commitment to results and quality, top manager, leadership and management excellence.
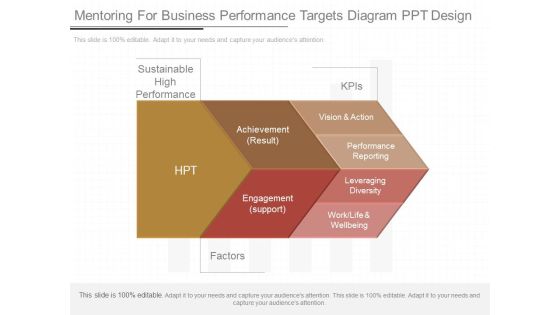
Mentoring For Business Performance Targets Diagram Ppt Design
This is a mentoring for business performance targets diagram ppt design. This is a three stage process. The stages in this process are sustainable high performance, kpis, hpt, achievement result, engagement support, factors, vision and action, performance reporting, leveraging diversity, work life and wellbeing.

Systematic Process Of Problem Solving Diagram Powerpoint Slides
This is a systematic process of problem solving diagram powerpoint slides. This is a nine stage process. The stages in this process are define problem measure, gather problem facts data, search for possible causes, plan temporary and permanent improvement, confirm root cause, analyze for cause, check results, install permanent improvement, control.

Value Chain For Business Intelligence Ppt Powerpoint Layout
This is a value chain for business intelligence ppt powerpoint layout. This is a three stage process. The stages in this process are operational system, erp, flat files, crm, sql, data sources, data clearing, data lording, data transforming, data aggregating, data validation, data flow, alerts, reports, olap analysts, dashboards, data mining, bi result.

Kaizen Method Of Conversion Optimization Ppt Powerpoint Guide
This is a kaizen method of conversion optimization ppt powerpoint guide. This is a six stage process. The stages in this process are understanding the business, left analysis, knowing the competition, keyword opportunities, results analysis, on page optimization, technical install, of page optimization.

Marketing Insight In Planning Process Sample Powerpoint Ideas
This is a marketing insight in planning process sample powerpoint ideas. This is a nine stage process. The stages in this process are implementing strategies and measures, forecast equipment, design network, marketing, defining your project, using results to adapt and improve, developing strategies and measures, select technologies, finance business strategy.
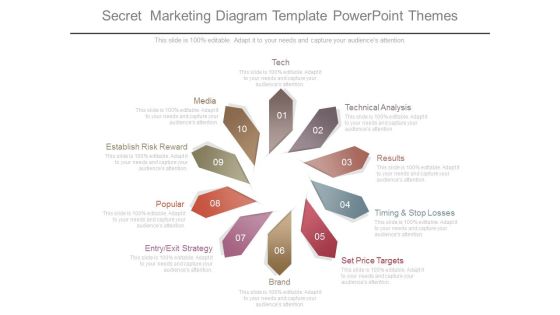
Secret Marketing Diagram Template Powerpoint Themes
This is a secret marketing diagram template powerpoint themes. This is a ten stage process. The stages in this process are tech, media, establish risk reward, popular, entry exit strategy, brand, set price targets, timing and stop losses, results, technical analysis.

Agile Information Governance Process Ppt Powerpoint Layout
This is a agile information governance process ppt powerpoint layout. This is a six stage process. The stages in this process are define business problem, obtain executive sponsors, align teams, understand data risk and value, implement project, measure results, plan, act, assess.
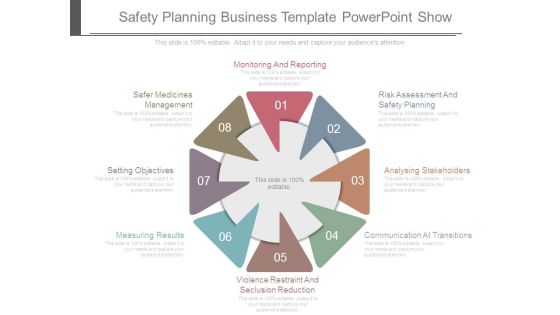
Safety Planning Business Template Powerpoint Show
This is a safety planning business template powerpoint show. This is a eight stage process. The stages in this process are monitoring and reporting, risk assessment and safety planning, analysing stakeholders, communication at transitions, violence restraint and seclusion reduction, measuring results, setting objectives, safer medicines management.

Sales Performance Wheel Chart Ppt Examples Professional
This is a sales performance wheel chart ppt examples professional. This is a ten stage process. The stages in this process are performance management, system and governance, supplier relationship management, result tracking and reporting, information technology, category plan development, trading partners relationship, organizational capabilities, business alignment, strategy and business process.
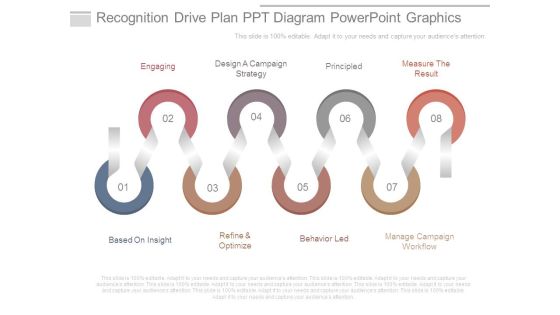
Recognition Drive Plan Ppt Diagram Powerpoint Graphics
This is a recognition drive plan ppt diagram powerpoint graphics. This is a eight stage process. The stages in this process are engaging, design a campaign strategy, principled, measure the result, based on insight, refine and optimize, behavior led, manage campaign workflow.

Improve Social Networking Skills Diagram Ppt Sample Presentations
This is a improve social networking skills diagram ppt sample presentations. This is a eight stage process. The stages in this process are optimize content, define strategy, strategy and reporting, content creation, social media research, measure results, create content, build presence.
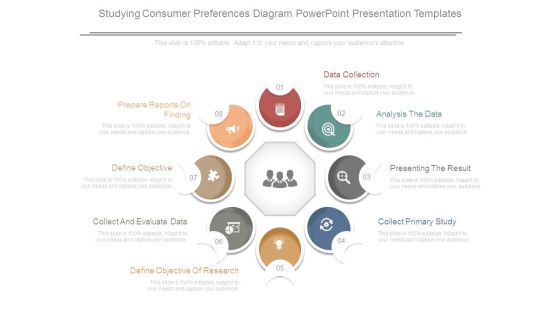
Studying Consumer Preferences Diagram Powerpoint Presentation Templates
This is a studying consumer preferences diagram powerpoint presentation templates. This is a eight stage process. The stages in this process are prepare reports on finding, define objective, collect and evaluate data, define objective of research, collect primary study, presenting the result, analysis the data, data collection.
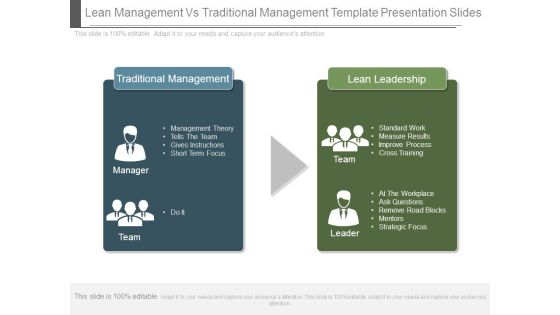
Lean Management Vs Traditional Management Template Presentation Slides
This is a lean management vs traditional management template presentation slides. This is a two stage process. The stages in this process are traditional management, management theory tells the team gives instructions short term focus, manager, do it, team, lean leadership, standard work measure results improve process cross training, at the workplace ask questions remove road blocks mentors strategic focus, team, leader.

Year Based Company Finance Growth Ppt PowerPoint Presentation Layouts
This is a year based company finance growth ppt powerpoint presentation layouts. This is a ten stage process. The stages in this process are financial result, net sales, other income, ebita, ebita margins, profit before tax, taxes, tax rate, profit after tax, pat margins.

Cause And Effect Relationship In Behavior With Pointers Ppt PowerPoint Presentation Shapes
This is a cause and effect relationship in behavior with pointers ppt powerpoint presentation shapes. This is a six stage process. The stages in this process are root cause materials, root cause methods, effects resultant problem, root cause people, root cause equipment.
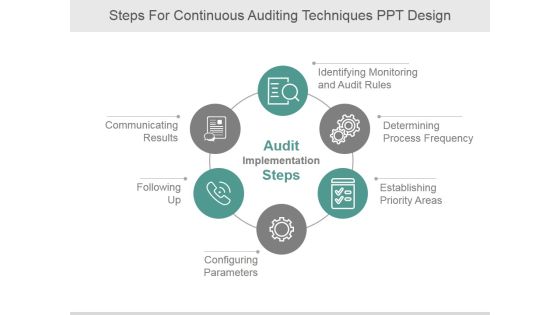
Steps For Continuous Auditing Techniques Ppt PowerPoint Presentation Background Image
This is a steps for continuous auditing techniques ppt powerpoint presentation background image. This is a six stage process. The stages in this process are identifying monitoring and audit rules, determining process frequency, establishing priority areas, configuring parameters, following up, communicating results.

Six Steps For Continuous Audit Development Process Ppt PowerPoint Presentation Summary
This is a six steps for continuous audit development process ppt powerpoint presentation summary. This is a six stage process. The stages in this process are communicating results, following up, configuring parameters, establishing priority areas, determining process frequency, identifying monitoring and audit rules.

How Do We Do That Ppt PowerPoint Presentation Outline
This is a how do we do that ppt powerpoint presentation outline. This is a four stage process. The stages in this act, plan, do, check, select action, cause investigation, gap identification, standardize and plan continuous improvement, study the result, action implementation.

Auditing Cause Effect Flow Ppt PowerPoint Presentation Diagrams
This is a auditing cause effect flow ppt powerpoint presentation diagrams. This is a six stage process. The stages in this process are root cause people, root cause equipment, root cause environment, root cause materials, root cause methods, effects resultant problem.

Continuous Audit Implementation Steps Ppt PowerPoint Presentation Background Images
This is a continuous audit implementation steps ppt powerpoint presentation background images. This is a six stage process. The stages in this process are communicating results, identifying monitoring and audit rules, determining process frequency, establishing priority areas, following up, configuring parameters.

Auditing Cause Effect Flow Ppt PowerPoint Presentation Sample
This is a auditing cause effect flow ppt powerpoint presentation sample. This is a three stage process. The stages in this process are root cause people, root cause equipment, root cause environment, root cause materials, root cause methods, effects resultant problem.
 Home
Home