Product Solution

Total Risk Events Encountered And Loss Amount Involved Brochure PDF
Mentioned slide portrays year over year stats of number of risk events occurred within the firm. It also includes the total amount of loss caused from risk events annually.Deliver an awe inspiring pitch with this creative Total Risk Events Encountered And Loss Amount Involved Brochure PDF bundle. Topics like Company Recorded, Highest Occurrence, Resulting A Monetary can be discussed with this completely editable template. It is available for immediate download depending on the needs and requirements of the user.

Digital Marketing Guide For B2B Firms Linkedin Strategies For Creating Awareness Among B2B Consumers Graphics PDF
This slide showcases strategies that can help organization to generate leads through LinkedIn platform. Key strategies include optimize page, run LinkedIn ads, use LinkedIn groups and repurpose existing content.Deliver an awe inspiring pitch with this creative Digital Marketing Guide For B2B Firms Linkedin Strategies For Creating Awareness Among B2B Consumers Graphics PDF bundle. Topics like Personalized Messenger, Business Description, Repurpose In Messenger can be discussed with this completely editable template. It is available for immediate download depending on the needs and requirements of the user.

Ppt Interconnected Seven Stages Of Writing Process PowerPoint Presentation Templates
PPT interconnected seven stages of writing process powerpoint presentation Templates-This diagram is a graphical illustration of the relationships between and among sets of data, groups of objects that share something in common. This diagram is made up of overlapping circles that show all possible logical relations. Deliver amazing presentations to mesmerize your audience.-PPT interconnected seven stages of writing process powerpoint presentation Templates-3, Advice, Analysis, Analyze, Answer, Area, Career, Chart, Choice, Circles, Concept, Determination, Diagram, Graph, Idea, Illustration, Intersect, Measurement, Opportunities, Options, Overlap, Overlapped, Overlapping, Passion, Passionate, Prioritize, Priority, Profession

Ppt Complementary Seven Power Point Stage Business PowerPoint Templates
PPT complementary seven power point stage Business PowerPoint Templates-Our Awesome Diagram consists of a design of seven circular boxes placed In the Horizontal Manner. Adjust the above image into your Presentations to visually support your contents in your Business PPT Slideshows. This image represents the Abstraction of seven steps involved in the process. Deliver amazing presentations to mesmerize your audience using this Diagram.-PPT complementary seven power point stage Business PowerPoint Templates-3, Advice, Analysis, Analyze, Answer, Area, Career, Chart, Choice, Circles, Concept, Determination, Diagram, Graph, Idea, Illustration, Intersect, Measurement, Opportunities, Options, Overlap, Overlapped, Overlapping, Passion, Passionate, Prioritize, Priority, Profession

AI And ML Driving Monetary Value For Organization Customer Service Management Kpi Dashboard Formats PDF
Following slide illustrates customer service dashboard. It includes KPIs such as request answered, customer satisfaction, average time to solve an issue, costs per support and customer retention. Deliver and pitch your topic in the best possible manner with this ai and ml driving monetary value for organization customer service management kpi dashboard formats pdf. Use them to share invaluable insights on customer retention, cost per support, customer satisfaction, cost to revenue and impress your audience. This template can be altered and modified as per your expectations. So, grab it now.

Sustainability Calculation With KPI Customer Service Dashboard Revenue Ideas PDF Graphics PDF
Following slide illustrates customer service dashboard covering details such as request answered, total requests, total revenue and support cost revenue. It also includes customer satisfaction score, customer retention in a 12 months format. Deliver and pitch your topic in the best possible manner with this sustainability calculation with kpi customer service dashboard microsoft pdf. Use them to share invaluable insights on customer satisfaction, revenue, customer retention and impress your audience. This template can be altered and modified as per your expectations. So, grab it now.

Advance IT Service Organize Employee Interactions By Functional Infographics PDF
This template depicts that use of Knowledge management system will ensure that the live agents have answers at their fingertips in order to deliver accurate, fast, and consistent assistance. This is a advance it service organize employee interactions by functional infographics pdf template with various stages. Focus and dispense information on seven stages using this creative set, that comes with editable features. It contains large content boxes to add your information on topics like hr employee relations, hr lifecycle events, hr payroll, hr total rewards. You can also showcase facts, figures, and other relevant content using this PPT layout. Grab it now.

Optimize Service Delivery With Enhanced Organize Employee Interactions By Functional Discipline Mockup PDF
This template depicts that use of Knowledge management system will ensure that the live agents have answers at their fingertips in order to deliver accurate, fast, and consistent assistance.This is a Optimize Service Delivery With Enhanced Organize Employee Interactions By Functional Discipline Mockup PDF template with various stages. Focus and dispense information on seven stages using this creative set, that comes with editable features. It contains large content boxes to add your information on topics like Workforce Administration, Talent Management, Lifecycle Events. You can also showcase facts, figures, and other relevant content using this PPT layout. Grab it now.
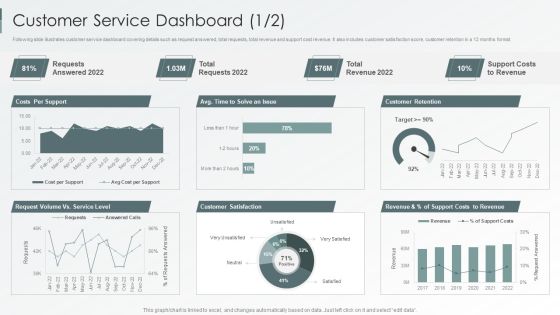
Enterprise Sustainability Performance Metrics Customer Service Dashboard Professional PDF
Following slide illustrates customer service dashboard covering details such as request answered, total requests, total revenue and support cost revenue. It also includes customer satisfaction score, customer retention in a 12 months format.Deliver and pitch your topic in the best possible manner with this Enterprise Sustainability Performance Metrics Customer Service Dashboard Professional PDF. Use them to share invaluable insights on Customer Satisfaction, Customer Retention, Support Revenue and impress your audience. This template can be altered and modified as per your expectations. So, grab it now.
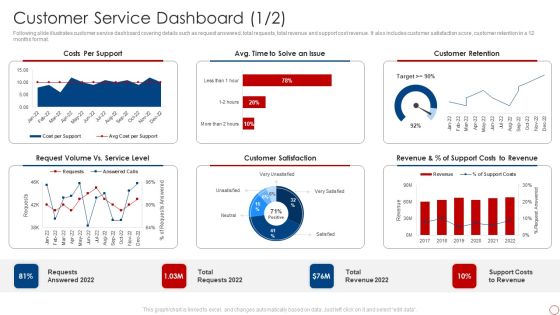
Kpis For Evaluating Business Sustainability Customer Service Dashboard Designs PDF
Following slide illustrates customer service dashboard covering details such as request answered, total requests, total revenue and support cost revenue. It also includes customer satisfaction score, customer retention in a 12 months format. Deliver and pitch your topic in the best possible manner with this Kpis For Evaluating Business Sustainability Customer Service Dashboard Designs PDF. Use them to share invaluable insights on Costs Per Support, Customer Retention, Customer Satisfaction and impress your audience. This template can be altered and modified as per your expectations. So, grab it now.
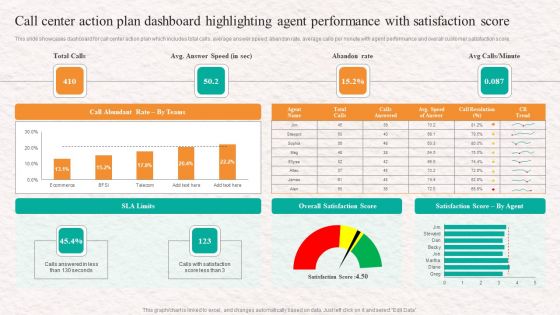
Call Center Action Plan Dashboard Highlighting Customer Service Agent Performance Elements PDF
This slide showcases dashboard for call center action plan which includes total calls, average answer speed, abandon rate, average calls per minute with agent performance and overall customer satisfaction score. Boost your pitch with our creative Call Center Action Plan Dashboard Highlighting Customer Service Agent Performance Elements PDF. Deliver an awe-inspiring pitch that will mesmerize everyone. Using these presentation templates you will surely catch everyones attention. You can browse the ppts collection on our website. We have researchers who are experts at creating the right content for the templates. So you dont have to invest time in any additional work. Just grab the template now and use them.

Strategies To Enhance Call Center Management Expected Outcome From Call Center Sample PDF
This slide highlights the projected outcome from the call center improvement action plan which includes call answered within 40 sec, average call time, average call time, total call abandonment. Boost your pitch with our creative Strategies To Enhance Call Center Management Expected Outcome From Call Center Sample PDF. Deliver an awe-inspiring pitch that will mesmerize everyone. Using these presentation templates you will surely catch everyones attention. You can browse the ppts collection on our website. We have researchers who are experts at creating the right content for the templates. So you dont have to invest time in any additional work. Just grab the template now and use them.
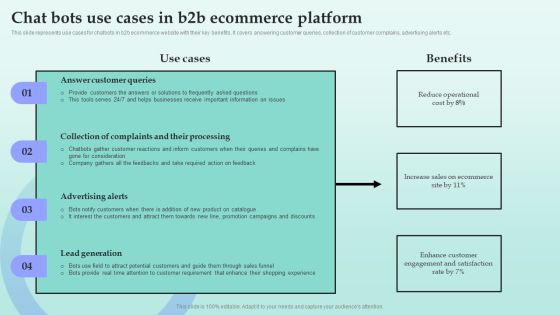
Strategies For Successful Customer Base Development In B2b M Commerce Chat Bots Use Cases In B2b Ecommerce Platform Designs PDF
This slide represents use cases for chatbots in b2b ecommerce website with their key benefits. It covers answering customer queries, collection of customer complains, advertising alerts etc. From laying roadmaps to briefing everything in detail, our templates are perfect for you. You can set the stage with your presentation slides. All you have to do is download these easy to edit and customizable templates. Strategies For Successful Customer Base Development In B2b M Commerce Chat Bots Use Cases In B2b Ecommerce Platform Designs PDF will help you deliver an outstanding performance that everyone would remember and praise you for. Do download this presentation today.

E Commerce Operations In B2b Chat Bots Use Cases In B2b Ecommerce Platform Download PDF
This slide represents use cases for chatbots in b2b ecommerce website with their key benefits. It covers answering customer queries, collection of customer complains, advertising alerts etc. Boost your pitch with our creative E Commerce Operations In B2b Chat Bots Use Cases In B2b Ecommerce Platform Download PDF. Deliver an awe-inspiring pitch that will mesmerize everyone. Using these presentation templates you will surely catch everyones attention. You can browse the ppts collection on our website. We have researchers who are experts at creating the right content for the templates. So you do not have to invest time in any additional work. Just grab the template now and use them.

Leveraging Openai API For Business Speech To Text Tool In Openai API Pictures PDF
This slide showcases speech to text AI model which developers can use to make transcriptions and translations based on audios. It provides details about file uploads, supported formats, prompting, etc. Whether you have daily or monthly meetings, a brilliant presentation is necessary. Leveraging Openai API For Business Speech To Text Tool In Openai API Pictures PDF can be your best option for delivering a presentation. Represent everything in detail using Leveraging Openai API For Business Speech To Text Tool In Openai API Pictures PDF and make yourself stand out in meetings. The template is versatile and follows a structure that will cater to your requirements. All the templates prepared by Slidegeeks are easy to download and edit. Our research experts have taken care of the corporate themes as well. So, give it a try and see the results.
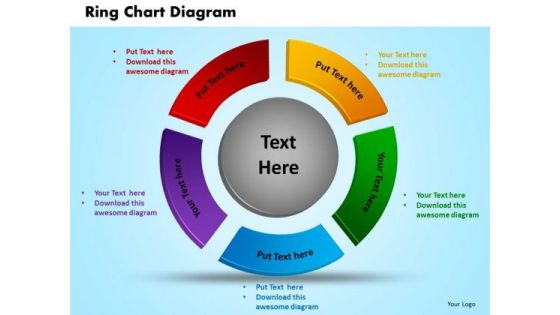
PowerPoint Presentation Ring Chart Diagram Business Ppt Slides
PowerPoint Presentation Ring Chart Diagram Business PPT Slides-This Business Oriented PowerPoint Diagram signifies the five approaches inter-related to each other and result in one issue. This Diagram will fit for Business Presentations.-PowerPoint Presentation Ring Chart Diagram Business PPT Slides

Show Your Skills For Success PowerPoint Templates Ppt Backgrounds For Slides 0613
Light The Fuse With Our Gear wheels Powerpoint Templates. Blast The Audience With The Force Of Your Ideas. In Depth Analysis Of Situations Is Your Forte. Use Our People Powerpoint Templates To Acquaint Your Listeners With Your Results.

Take The Right Pills For Disease PowerPoint Templates Ppt Backgrounds For Slides 0613
Light The Fuse With Our Medical Powerpoint Templates. Blast The Audience With The Force Of Your Ideas. In Depth Analysis Of Situations Is Your Forte. Use Our Business Powerpoint Templates To Acquaint Your Listeners With Your Results.

Stock Photo Arrow Try To Jump Over A Wall PowerPoint Slide
This innovative image has design of progressive arrow trying to jump over a wall. Use this image in business presentations to display concepts like success and growth. Highlight the results of you thought process using this image.
Stock Photo Copper Laurel Trophy For Winner PowerPoint Slide
The above image has been designed with laurel trophy for winner. This professional image of laurel trophy is well designed to display concept of win, success and victory. Highlight the results of you thought process using this image.

Stock Photo Blue Arrow Breaking Wall Leadership PowerPoint Slide
This innovative image has design of progressive arrow crossing the wall and leading other arrows. Use this image in business presentations to display concepts like leadership, success etc. Highlight the results of you thought process using this image.
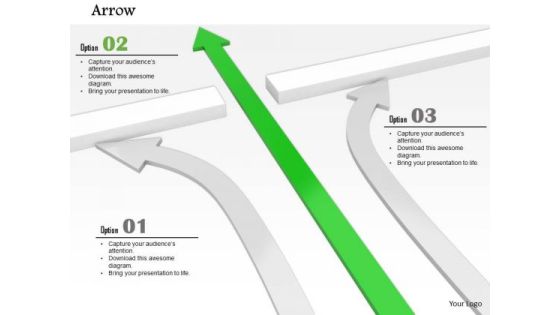
Stock Photo Green Arrow Leading And Breaking Wall Leadership Concept PowerPoint Slide
This innovative image has design of progressive arrow crossing the wall and leading other arrows. Use this image in business presentations to display concepts like leadership, success etc. Highlight the results of you thought process using this image.

Stock Photo Red And White Arrows With Leadership PowerPoint Slide
This innovative image has design of progressive arrow crossing the wall and leading other arrows. Use this image in business presentations to display concepts like leadership, success etc. Highlight the results of you thought process using this image.

Business Framework Balanced Scorecard PowerPoint Presentation
This power point diagram slide has been crafted with graphic of four staged balance card. This diagram is professionally designed for explaining various scores for business results. Use this diagram slide for business and marketing presentations.

Business Diagram Venn Diagram With Three Steps Presentation Template
This slide displays Venn diagram with three steps presentation template. This power point template has been designed with graphic of Venn diagram. Use this Venn diagram for business result analysis. Build business presentations with analysis practices with this Venn diagram.
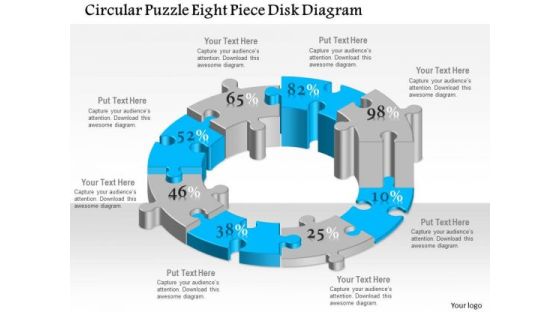
Business Diagram Circular Puzzle Eight Piece Disk Diagram Presentation Template
This business plan power point template has been designed with six staged circular puzzle diagram. This diagram template contains the concept of business process flow and result analysis representation. Use this diagram in your presentation and show these concepts.

Business Diagram Pie Chart Octagon Shape Presentation Template
This business plan power point template has been designed with pie chart in octagon shape. This PPT contains the concept of result analysis for any business process. Use this PPT for business and sales related presentations.
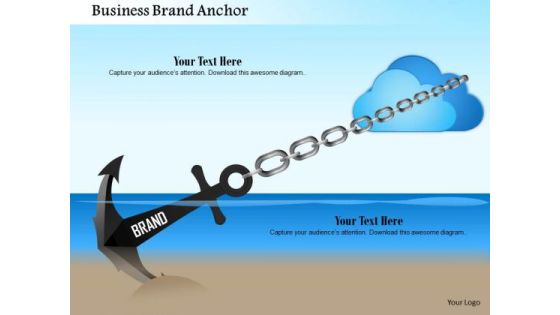
Business Framework Business Brand Anchor PowerPoint Presentation
Explain the concept of new idea generation with this exclusive PPT slide. This PPT contain the graphic of two bulbs making a Venn diagram. This PPT can be used for any business presentation to representation result analysis.
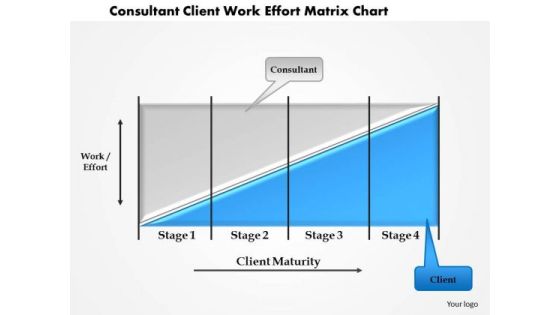
Business Framework Consultant Client Work Effort Matrix Chart PowerPoint Presentation
This business power point template slide has been crafted with graphic of bar graph. This bar graph is called as coase theorem. Use this professional diagram for your result analysis related presentation.

Business Framework Merger And Acquisition Synergy PowerPoint Presentation
This Power Point template slide has been designed with graphic of semicircular design for result display on graph. This design can be used for merger and acquisition for synergy. Use this PPT slide for your business presentation.
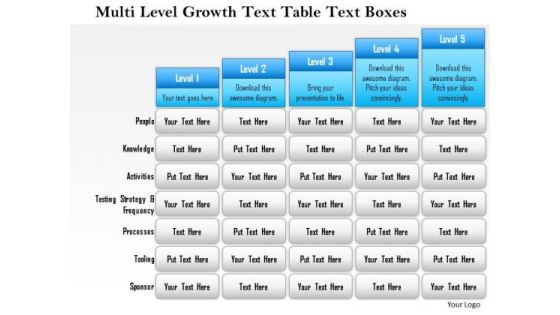
Business Framework Multi Level Growth Text Table Text Boxes 2 PowerPoint Presentation
Five staged text box style chart in bar graph design has been used to decorate this power point template slide. This diagram slide contains the multilevel growth concept. Use this PPT slide for financial growth and result analysis related topics.
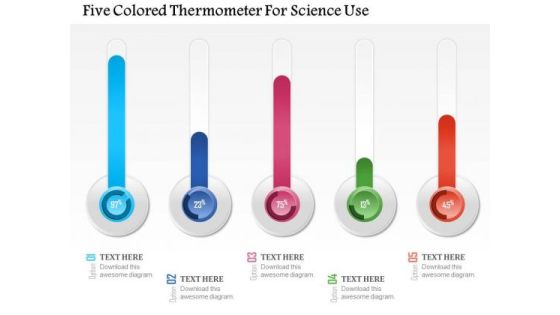
Business Diagram Five Colored Thermometer For Science Use Presentation Template
This PPT slide is dedicated for science related presentations. This PPT slide has been crafted with graphic of five colored thermometer. Explain any temperature related ratings and results in your presentation by using this PPT slide.

Business Diagram Eight Staged Circular Puzzle Bar Graph Presentation Template
This Power Point template has been crafted with graphic of eight staged circular puzzle and bar graph. This PPT contains the financial result analysis related concept. Use this PPT for your business and success related presentations.
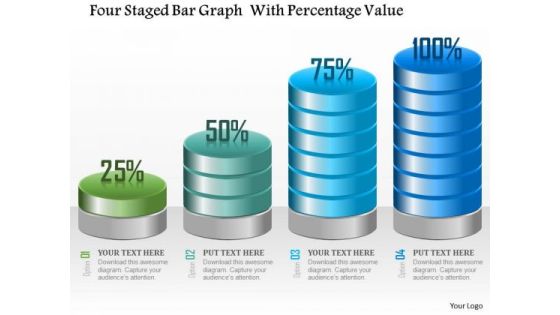
Business Diagram Four Staged Bar Graph With Percentage Value Presentation Template
Four staged bar graph with percentage value has been used to craft this power point template. This PPT contains the concept of making financial timeline and result analysis. This PPT can be used for business and finance related presentations.

Business Framework 10 Percent To 90 Percent PowerPoint Presentation
This business diagram has been designed with graphic of multiple pie graphs. This diagram slide contains the concept of result analysis with percentage values. Use this diagram to present and compare data in an impressive manner
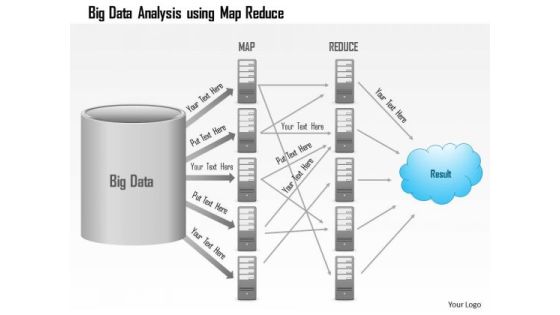
Business Diagram Big Data Analysis Using Map Reduce Batch Processing Ppt Slide
This PowerPoint template has been designed with graphic of server and data transfer network. This slide contains the steps of big data, map, reduce and result. Use this editable diagram for data technology related presentations.

3d Man On The Top Of Puzzle Bar Graph
This PPT has been designed with graphic of 3d man and puzzle are graph. This PPT displays the concept of result analysis and financial growth. Use this PPT for your business and finance related presentations.
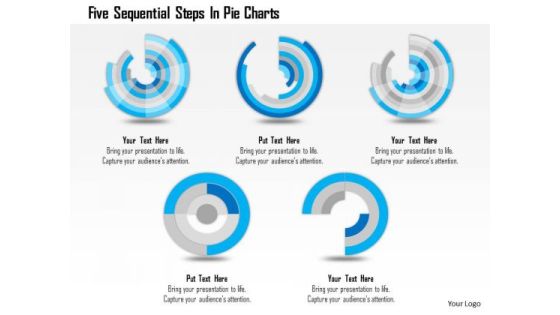
Business Diagram Five Sequential Steps In Pie Charts Presentation Template
Five sequential pie charts are used to craft this power point template. This PPT contains the concept of process flow and result analysis. Use this PPT for your business and sales related presentations and build quality presentation for your viewers.
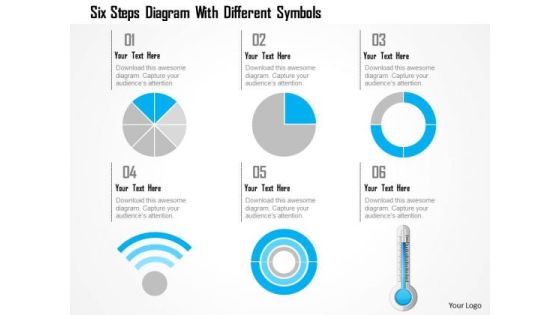
Business Diagram Six Steps Diagram With Different Symbols Presentation Template
This power point template has been crafted with graphic of 3d pie charts with Wi-Fi symbol and thermometer. This PPT contains the concept of calculation and result analysis. Use this PPT for your business and science related presentations.
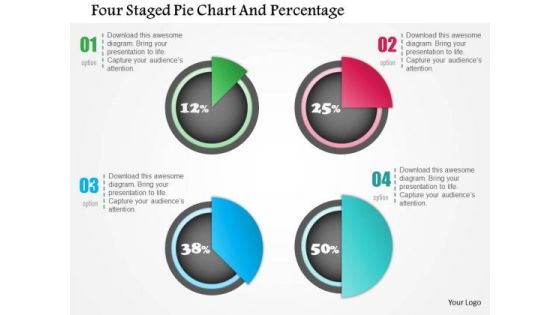
Business Diagram Four Staged Pie Chart And Percentage Presentation Template
Four staged pie chart and percentage values has been used to design this power point template. This PPT contains the concept of financial result analysis. Use this PPT for business and marketing related presentations.
Business Diagram Human Icon Bar Graph For Business Presentation Template
Graphic of human icons and bar graph has been used to decorate this power point template. This PPT contains the concept of business communication and result analysis. Use this PPT for business and marketing related presentations.

Business Diagram Linear Bar Graph With Apps Made With Pencils Presentation Template
This power point template has been crafted with graphic of linear bar graph and apps made with pencils. This PPT diagram can be used for business growth analysis and result analysis. Use this PPT for business and marketing related presentations.

Business Diagram Business People Over Bar Chart PowerPoint Template
This Power Point template has been designed with graphic of business people and bar chart. This PPT contains the concept of result analysis and business data display. Use this PPT slide for your business and marketing related presentations.

Timeline For Entrepreneurial Marketing Presentation Template
This PowerPoint template has been designed with text boxes and timeline graphics. Use this image in business presentations to display planning and timeline. Highlight the results of you thought process using this template.

Business Diagram Line Graph For Dollar Growth Presentation Template
Graphic of dollar symbol and growth arrow has been used to design this power point template. This diagram contains the concept of financial result analysis. Use this business diagram for finance related presentations

Business Diagram Paper Clips Circular Chart Presentation Template
This power point template has been designed with graphic of circular chart made with paper clips. These business icons are used to display the concept of business result analysis and meeting. Use this diagram for business and marketing presentations.

Business Diagram Charts To Present Business Data PowerPoint Templates
Table of pie graphs has been used in this power point diagram. This business diagram contains the concept of result analysis. The template offers an excellent background to build up the various stages of your business process.

3d People On Pie Chart PowerPoint Templates
This power point diagram has been crafted with graphic of 3d team members on pie chart. This 3d diagram contains the concept of team management and result analysis. Use this diagram to create an impact on your viewers.

Magnifying Glass On 3d Red Leader PowerPoint Templates
Graphic of persons with magnifier has been used to design this power point template. This 3d diagram contains the concept of right people selection. You have identified the key result areas. Focus on each through this slide.

Magnifying Glass On Blue Person PowerPoint Templates
Graphic of persons with magnifier has been used to design this power point template. This 3d diagram contains the concept of right people selection. You have identified the key result areas. Focus on each through this slide.
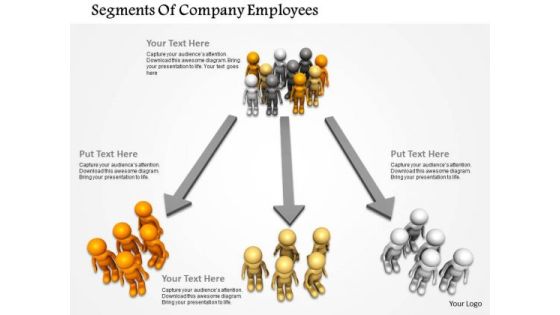
Segments Of Company Employees PowerPoint Templates
Concept of three way customer segmentation has been defined in this power point template. This 3d diagram contains the graphic of customers group and way. You have identified the key result areas. Focus on each through this slide.
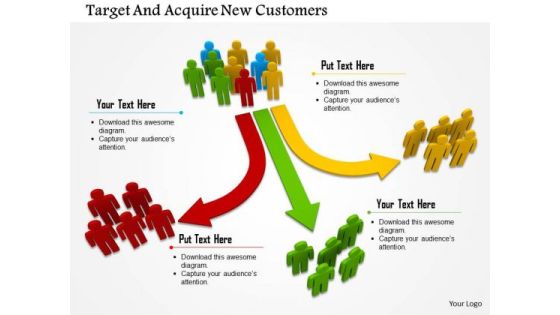
Target And Acquire New Customers PowerPoint Templates
Concept of three way customer segmentation has been defined in this power point template. This 3d diagram contains the graphic of customers group and way. You have identified the key result areas. Focus on each through this slide.
Three Steps Venn Diagram With Icons Powerpoint Slides
This power point template has been designed with graphic of Venn diagram. Use this Venn diagram for business result analysis. Illustrate your ideas and imprint them in the minds of your team with this template.
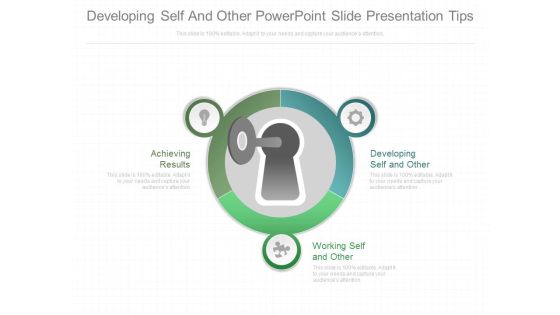
Developing Self And Other Powerpoint Slide Presentation Tips
This is a developing self and other powerpoint slide presentation tips. This is a one stage process. The stages in this process are achieving results, developing self and other, working self and other.

Create Alternative Plans Detailed Action Plan Ppt Slides
This is a create alternative plans detailed action plan ppt slides. This is a four stage process. The stages in this process are forecasts of expected results, marketing budget, create alternative plans, detailed action plan.

Pretending Innovation Ppt Background Images
This is a pretending innovation ppt background images. This is a five stage process. The stages in this process are innovation energy, pretending innovation, cosmetics results, conscious innovation, discrete eureka moment.
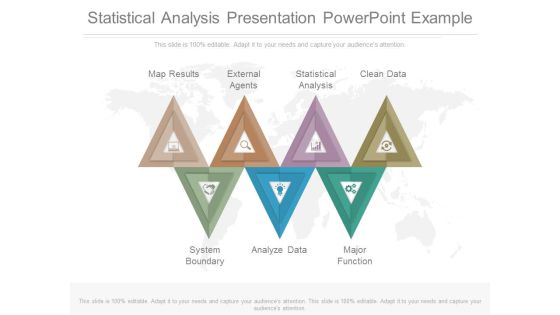
Statistical Analysis Presentation Powerpoint Example
This is a statistical analysis presentation powerpoint example. This is a seven stage process. The stages in this process are map results, external agents, statistical analysis, clean data, system boundary, analyze data, major function.

Facilitates Communication Example Of Ppt Presentation
This is a facilitates communication example of ppt presentation. This is a four stage process. The stages in this process are results in higher quality, prevent work slippage, helps prevent changes, facilitates communication.
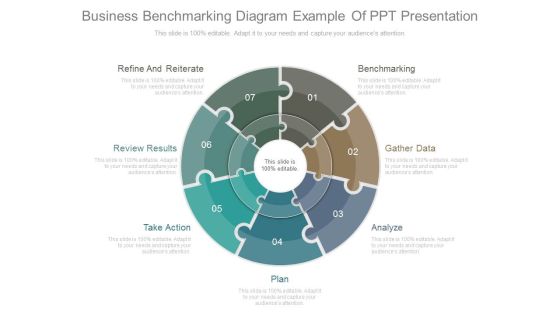
Business Benchmarking Diagram Example Of Ppt Presentation
This is a business benchmarking diagram example of ppt presentation. This is a seven stage process. The stages in this process are refine and reiterate, review results, take action, plan, analyze, gather data, benchmarking.
Change Methodology Strategies Ppt Example
This is a change methodology strategies ppt example. This is a four stage process. The stages in this process are locally relevant, results oriented, aligned with local sales plan, solves local issues, best of decentralized approach, collaboration.
 Home
Home