Product Sales

Bar Graph Ppt PowerPoint Presentation Slides Deck
This is a bar graph ppt powerpoint presentation slides deck. This is a three stage process. The stages in this process are financial in years, product, sales in percentage.

Clustered Column Line Ppt Powerpoint Presentation Slides Demonstration
This is a clustered column line ppt powerpoint presentation slides demonstration. This is a four stage process. The stages in this process are product, sales in percentage, finance, marketing.

Bar Chart Ppt PowerPoint Presentation Professional Files
This is a bar chart ppt powerpoint presentation professional files. This is a seven stage process. The stages in this process are bar chart, product, sales in percentage, financial years.
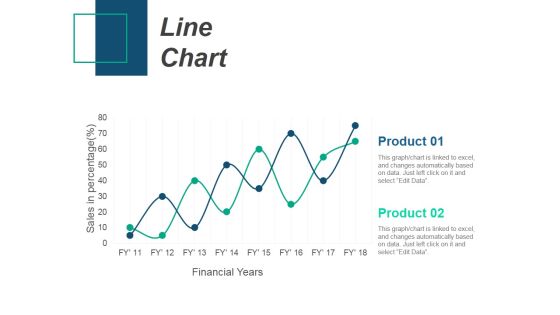
Line Chart Ppt PowerPoint Presentation Infographic Template Introduction
This is a line chart ppt powerpoint presentation infographic template introduction. This is a two stage process. The stages in this process are product, sales in percentage, financial years, line chart.

Stacked Column Ppt PowerPoint Presentation Infographics Samples
This is a stacked column ppt powerpoint presentation infographics samples. This is a two stage process. The stages in this process are product, sales in percentage, business, marketing, graph.

Area Chart Ppt PowerPoint Presentation Summary Objects
This is a area chart ppt powerpoint presentation summary objects. This is a two stage process. The stages in this process are product, sales in percentage, finance, business, marketing.
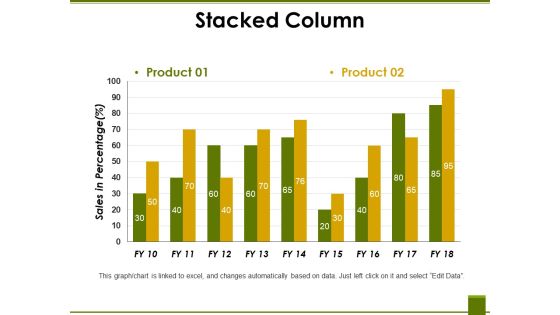
Stacked Column Ppt PowerPoint Presentation Professional Vector
This is a stacked column ppt powerpoint presentation professional vector. This is a two stage process. The stages in this process are product, sales in percentage, business, marketing, graph.

Bar Chart Ppt PowerPoint Presentation Layouts Pictures
This is a bar chart ppt powerpoint presentation layouts pictures. This is a three stage process. The stages in this process are bar graph, product, sales in percentage, business, marketing.

Area Chart Ppt PowerPoint Presentation Layouts Vector
This is a area chart ppt powerpoint presentation layouts vector. This is a two stage process. The stages in this process are area chart, product, sales in percentage, financial year.
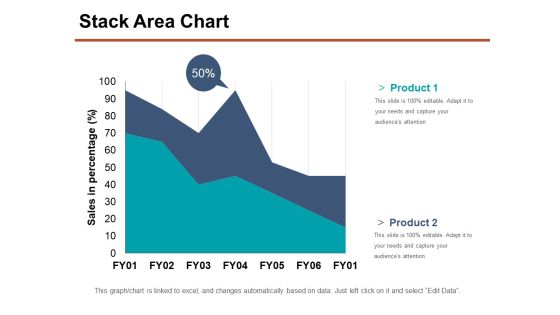
Stack Area Chart Ppt PowerPoint Presentation Show Samples
This is a stack area chart ppt powerpoint presentation show samples. This is a two stage process. The stages in this process are product, sales in percentage, business, marketing, percentage.

Clustered Column Ppt PowerPoint Presentation Portfolio Smartart
This is a clustered column ppt powerpoint presentation portfolio smartart. This is a two stage process. The stages in this process are financial year, product, sales in percentage, finance, business, graph.

Clustered Column Ppt PowerPoint Presentation Pictures Mockup
This is a clustered column ppt powerpoint presentation pictures mockup. This is a two stage process. The stages in this process are product, sales in percentage, financial year, graph, business.

Bar Chart Ppt PowerPoint Presentation Icon Demonstration
This is a bar chart ppt powerpoint presentation icon demonstration. This is a seven stage process. The stages in this process are product, sales in percentage, financial year, graph.

Stack Area Chart Ppt PowerPoint Presentation Example File
This is a stack area chart ppt powerpoint presentation example file. This is a two stage process. The stages in this process are product, sales in percentage, percentage, finance.

Clustered Column Line Ppt PowerPoint Presentation Slide
This is a clustered column line ppt powerpoint presentation slide. This is a three stage process. The stages in this process are bar graph, growth, finance, product, sales in percentage.

Clustered Column Ppt PowerPoint Presentation Slides Smartart
This is a clustered column ppt powerpoint presentation slides smartart. This is a two stage process. The stages in this process are product, sales in percentage, financial year, bar graph.

Clustered Column Line Ppt PowerPoint Presentation Inspiration Guidelines
This is a clustered column line ppt powerpoint presentation inspiration guidelines. This is a three stage process. The stages in this process are product, sales in percentage, graph, line, finance, business.

Area Chart Ppt PowerPoint Presentation Infographics File Formats
This is a area chart ppt powerpoint presentation infographics file formats. This is a two stage process. The stages in this process are area chart, product, sales in percentage, growth, success.

Column Chart Ppt PowerPoint Presentation Gallery Background
This is a column chart ppt powerpoint presentation gallery background. This is a two stage process. The stages in this process are product, sales in percentage, financial year, graph, success.

Line Chart Ppt PowerPoint Presentation Infographics Infographics
This is a line chart ppt powerpoint presentation infographics infographics. This is a two stage process. The stages in this process are product, sales in percentage, financial year, line chart, finance.

Area Chart Ppt PowerPoint Presentation Summary Example Introduction
This is a area chart ppt powerpoint presentation summary example introduction. This is a two stage process. The stages in this process are product, sales in percentage, percentage, area chart, business.

Bar Chart Ppt PowerPoint Presentation Icon Information
This is a bar chart ppt powerpoint presentation icon information. This is a one stage process. The stages in this process are product, sales in percentage, financial years, bar graph, growth.

Bar Graph Ppt PowerPoint Presentation File Slides
This is a bar graph ppt powerpoint presentation file slides. This is a three stage process. The stages in this process are product, sales in percentage, bar graph, growth, success.

Area Chart Ppt PowerPoint Presentation Layouts Images
This is a area chart ppt powerpoint presentation layouts images. This is a two stage process. The stages in this process are product, sales in percentage, area chart, percentage, finance.

Line Chart Ppt PowerPoint Presentation Show Guide
This is a line chart ppt powerpoint presentation show guide. This is a two stage process. The stages in this process are product, sales in percentage, financial years, growth, success.

Line Chart Ppt PowerPoint Presentation Gallery Rules
This is a line chart ppt powerpoint presentation gallery rules. This is a two stage process. The stages in this process are financial years, product, sales in percentage, line chart, growth.
Scatter Line Chart Ppt PowerPoint Presentation Icon Files
This is a scatter line chart ppt powerpoint presentation icon files. This is a one stage process. The stages in this process are dollar in millions, product, sales in percentage.

Clustered Column Ppt PowerPoint Presentation Gallery Structure
This is a clustered column ppt powerpoint presentation gallery structure. This is a two stage process. The stages in this process are product, sales in percentage, financial year, bar graph, finance.

Scatter Line Ppt PowerPoint Presentation Professional Design Inspiration
This is a scatter line ppt powerpoint presentation professional design inspiration. This is a one stage process. The stages in this process are product, sales in percentage, dollar in millions.

Bar Chart Ppt PowerPoint Presentation Model Picture
This is a bar chart ppt powerpoint presentation model picture. This is a two stage process. The stages in this process are product, sales in percentage, financial years, bar chart.
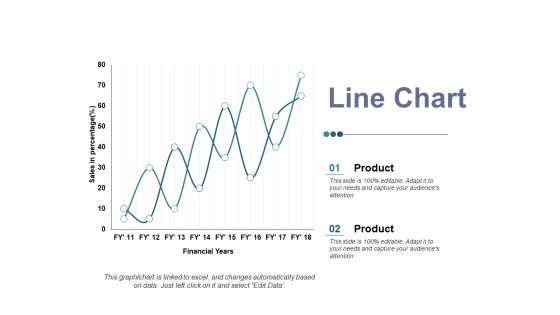
Line Chart Ppt PowerPoint Presentation Ideas Elements
This is a line chart ppt powerpoint presentation ideas elements. This is a two stage process. The stages in this process are product, sales in percentage, financial year, business, line chart.

Bar Graph Ppt PowerPoint Presentation Portfolio Slide Portrait
This is a bar graph ppt powerpoint presentation portfolio slide portrait. This is a three stage process. The stages in this process are product, sales in percentage, bar graph, growth, success.

Scatter Line Ppt PowerPoint Presentation Infographics Background Images
This is a scatter line ppt powerpoint presentation infographics background images. This is a one stage process. The stages in this process are dollar in millions, product, sales in percentage.
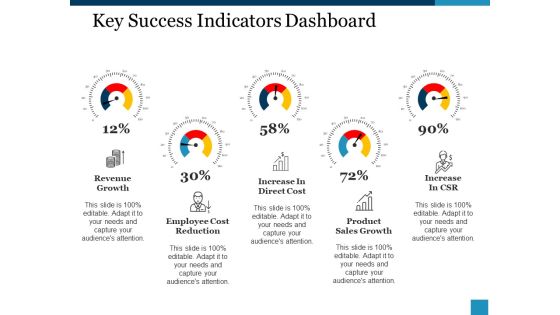
Key Success Indicators Dashboard Ppt PowerPoint Presentation Inspiration Guide
This is a key success indicators dashboard ppt powerpoint presentation inspiration guide. This is a five stage process. The stages in this process are revenue growth, increase in direct cost, increase in csr, employee cost reduction, product, sales growth.

Bubble Chart Ppt PowerPoint Presentation Infographic Template Layouts
This is a bubble chart ppt powerpoint presentation infographic template layouts. This is a two stage process. The stages in this process are bubble chart, product, sales in percentage, growth.

Area Chart Ppt PowerPoint Presentation Infographics Guide
This is a area chart ppt powerpoint presentation infographics guide. This is a two stage process. The stages in this process are area chart, product, sales in percentage, finance, business.

Column Chart Ppt PowerPoint Presentation Slides Show
This is a column chart ppt powerpoint presentation slides show. This is a two stage process. The stages in this process are column chart, product, sales in percentage, financial year, growth.

Bubble Chart Ppt PowerPoint Presentation Summary Graphics Tutorials
This is a bubble chart ppt powerpoint presentation summary graphics tutorials. This is a three stage process. The stages in this process are product, sales in percentage, bubble chart.

Clustered Column Chart Ppt PowerPoint Presentation Professional Ideas
This is a clustered column chart ppt powerpoint presentation professional ideas. This is a three stage process. The stages in this process are product, sales in percentage, column, years.
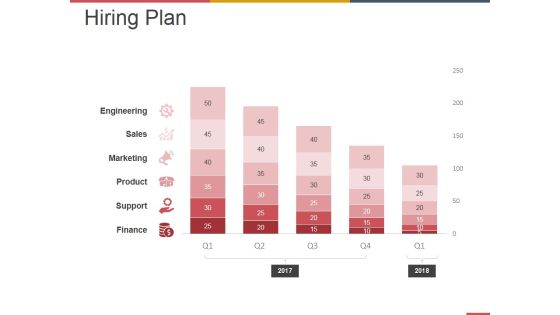
Hiring Plan Ppt PowerPoint Presentation Styles Inspiration
This is a hiring plan ppt powerpoint presentation styles inspiration. This is a five stage process. The stages in this process are engineering, sales, marketing, product, support, finance.
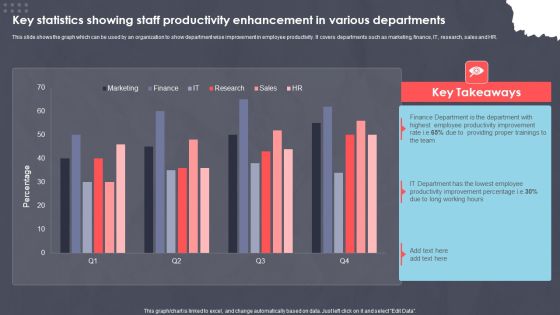
Key Statistics Showing Staff Productivity Enhancement In Various Departments Ppt PowerPoint Presentation Slides Portrait PDF
This slide shows the graph which can be used by an organization to show department wise improvement in employee productivity. It covers departments such as marketing, finance, IT, research, sales and HR. Pitch your topic with ease and precision using this Key Statistics Showing Staff Productivity Enhancement In Various Departments Ppt PowerPoint Presentation Slides Portrait PDF. This layout presents information on XXXXXXXXXXXXXXXXXXXXXXXXX. It is also available for immediate download and adjustment. So, changes can be made in the color, design, graphics or any other component to create a unique layout.

Overview Intelligent Products By Google Cloud AI Download PDF
This slide showcases introduction to Intelligent Products suite provided by Google AI which manufacturers can refer to generate basic idea of this technology. It provides details about engaging experience, AI insights, point of sale POS, etc. If your project calls for a presentation, then Slidegeeks is your go-to partner because we have professionally designed, easy-to-edit templates that are perfect for any presentation. After downloading, you can easily edit Overview Intelligent Products By Google Cloud AI Download PDF and make the changes accordingly. You can rearrange slides or fill them with different images. Check out all the handy templates

Critical Initiatives To Deploy Revise Existing Products Price To Attain Cost Leadership Icons PDF
This slide provides information regarding an initiative by firm to alter the price of existing products which are considered as overpriced by customer. The initiative will help firm in boosting the sale of such products and attain cost leadership. Whether you have daily or monthly meetings, a brilliant presentation is necessary. Critical Initiatives To Deploy Revise Existing Products Price To Attain Cost Leadership Icons PDF can be your best option for delivering a presentation. Represent everything in detail using Critical Initiatives To Deploy Revise Existing Products Price To Attain Cost Leadership Icons PDF and make yourself stand out in meetings. The template is versatile and follows a structure that will cater to your requirements. All the templates prepared by Slidegeeks are easy to download and edit. Our research experts have taken care of the corporate themes as well. So, give it a try and see the results.

Strategic Corporate Planning To Attain Revamping Present Products Price For Cost Leadership Guidelines PDF
This slide provides information regarding an initiative by firm to alter the price of existing products which are considered as overpriced by customer. The initiative will help firm in boosting the sale of such products and attain cost leadership. Create an editable Strategic Corporate Planning To Attain Revamping Present Products Price For Cost Leadership Guidelines PDF that communicates your idea and engages your audience. Whether you are presenting a business or an educational presentation, pre-designed presentation templates help save time. Strategic Corporate Planning To Attain Revamping Present Products Price For Cost Leadership Guidelines PDF is highly customizable and very easy to edit, covering many different styles from creative to business presentations. Slidegeeks has creative team members who have crafted amazing templates. So, go and get them without any delay.

Cost Revenue Management As Crucial Business Technique Revise Existing Products Price To Attain Formats PDF
This slide provides information regarding an initiative by firm to alter the price of existing products which are considered as overpriced by customer. The initiative will help firm in boosting the sale of such products and attain cost leadership. Get a simple yet stunning designed Cost Revenue Management As Crucial Business Technique Revise Existing Products Price To Attain Formats PDF. It is the best one to establish the tone in your meetings. It is an excellent way to make your presentations highly effective. So, download this PPT today from Slidegeeks and see the positive impacts. Our easy-to-edit Cost Revenue Management As Crucial Business Technique Revise Existing Products Price To Attain Formats PDF can be your go-to option for all upcoming conferences and meetings. So, what are you waiting for Grab this template today.

Implementing Effective Strategy Revise Existing Products Price To Attain Cost Guidelines PDF
This slide provides information regarding an initiative by firm to alter the price of existing products which are considered as overpriced by customer. The initiative will help firm in boosting the sale of such products and attain cost leadership. Present like a pro with Implementing Effective Strategy Revise Existing Products Price To Attain Cost Guidelines PDF Create beautiful presentations together with your team, using our easy-to-use presentation slides. Share your ideas in real-time and make changes on the fly by downloading our templates. So whether youre in the office, on the go, or in a remote location, you can stay in sync with your team and present your ideas with confidence. With Slidegeeks presentation got a whole lot easier. Grab these presentations today.

Revamping Present Products Price For Cost Leadership Ppt PowerPoint Presentation File Pictures PDF
This slide provides information regarding an initiative by firm to alter the price of existing products which are considered as overpriced by customer. The initiative will help firm in boosting the sale of such products and attain cost leadership. This modern and well arranged Revamping Present Products Price For Cost Leadership Ppt PowerPoint Presentation File Pictures PDF provides lots of creative possibilities. It is very simple to customize and edit with the Powerpoint Software. Just drag and drop your pictures into the shapes. All facets of this template can be edited with Powerpoint no extra software is necessary. Add your own material, put your images in the places assigned for them, adjust the colors, and then you can show your slides to the world, with an animated slide included.

Revise Existing Products Price To Attain Cost Leadership Techniques For Crafting Killer Template PDF
This slide provides information regarding an initiative by firm to alter the price of existing products which are considered as overpriced by customer. The initiative will help firm in boosting the sale of such products and attain cost leadership. Welcome to our selection of the Revise Existing Products Price To Attain Cost Leadership Techniques For Crafting Killer Template PDF. These are designed to help you showcase your creativity and bring your sphere to life. Planning and Innovation are essential for any business that is just starting out. This collection contains the designs that you need for your everyday presentations. All of our PowerPoints are 100 percent editable, so you can customize them to suit your needs. This multi-purpose template can be used in various situations. Grab these presentation templates today.

Asset Inventory Management System Sample Diagram Powerpoint Show
This is a asset inventory management system sample diagram powerpoint show. This is a seven stage process. The stages in this process are customers manager, employee sales, products sale, product inventory, suppliers manager, rma and rtv, products purchase.

Smart Manufacturing Deployment Improve Production Procedures Smart Manufacturing Dashboard Summary PDF
This slide represents smart manufacturing dashboard for inventory management. It includes inventory carrying cost, inventory turnover, inventory to sales ratio etc.Slidegeeks has constructed Smart Manufacturing Deployment Improve Production Procedures Smart Manufacturing Dashboard Summary PDF after conducting extensive research and examination. These presentation templates are constantly being generated and modified based on user preferences and critiques from editors. Here, you will find the most attractive templates for a range of purposes while taking into account ratings and remarks from users regarding the content. This is an excellent jumping-off point to explore our content and will give new users an insight into our top-notch PowerPoint Templates.

Channel Practices And Research Diagram Ppt Diagrams
This is a channel practices and research diagram ppt diagrams. This is a six stage process. The stages in this process are marketing, sales operations, channel management, new product introduction, performance center, sales productivity.

Elevator Pitch For Marketing Powerpoint Slide Designs
This is a elevator pitch for marketing powerpoint slide designs. This is a two stage process. The stages in this process are write your elevator pitch here.

Quarterly Revenue Analysis Generated By Various E Commerce Products Diagrams PDF
This slide shows comparison which can be used to present quarterly comparison between revenue of various products. It covers information about total annual and quarterly sales. Showcasing this set of slides titled Quarterly Revenue Analysis Generated By Various E Commerce Products Diagrams PDF. The topics addressed in these templates are Products Increased, Email Marketing. All the content presented in this PPT design is completely editable. Download it and make adjustments in color, background, font etc. as per your unique business setting.

Implementing Lean Production Tool And Techniques Reporting Structure For Lean Manufacturing Team Demonstration PDF
This slide represents production team report chart. It includes production department, quality control, engineering support, logistics and sales and support staff. Do you have an important presentation coming up Are you looking for something that will make your presentation stand out from the rest Look no further than Implementing Lean Production Tool And Techniques Reporting Structure For Lean Manufacturing Team Demonstration PDF. With our professional designs, you can trust that your presentation will pop and make delivering it a smooth process. And with Slidegeeks, you can trust that your presentation will be unique and memorable. So why wait Grab Implementing Lean Production Tool And Techniques Reporting Structure For Lean Manufacturing Team Demonstration PDF today and make your presentation stand out from the rest.

Elements Of Production Cost Cost Sheet With Detailed Cost Element Stock Topics PDF
The sheet gives a detail description on cost of good sold at the end of period, including cost of sales, raw material, overheads and production. This is a elements of production cost cost sheet with detailed cost element stock topics pdf. template with various stages. Focus and dispense information on two stages using this creative set, that comes with editable features. It contains large content boxes to add your information on topics like gross works cost, quality control cost, packing cost, cost of sales, material consumed. You can also showcase facts, figures, and other relevant content using this PPT layout. Grab it now.

Supply Chain Optimization Resources Diagram Powerpoint Slide Presentation Tips
This is a supply chain optimization resources diagram powerpoint slide presentation tips. This is a ten stage process. The stages in this process are supplier, product development, innovation, planning, customer, material suppliers, logistics, production, sales, customer.

Inventory Management Access Diagram Powerpoint Themes
This is a inventory management access diagram powerpoint themes. This is a eight stage process. The stages in this process are product inventory, product sales, physical inventory, store manager, engage, measure, accounting manager, supplier manager.
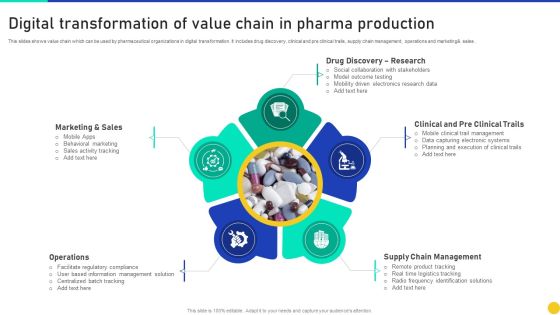
Digital Transformation Of Value Chain In Pharma Production Summary PDF
This slides shows value chain which can be used by pharmaceutical organizations in digital transformation. It includes drug discovery, clinical and pre clinical trails, supply chain management, operations and marketing and sales. Showcasing this set of slides titled Digital Transformation Of Value Chain In Pharma Production Summary PDF. The topics addressed in these templates are Marketing And Sales, Operations, Supply Chain Management. All the content presented in this PPT design is completely editable. Download it and make adjustments in color, background, font etc. as per your unique business setting.
Storage Facility Productivity Tracking And Management System Dashboard Diagrams PDF
This slide showcases a dashboard for managing and tracking warehouse productivity to optimize operational process. It includes key components such as user registered, subscribers request, orders, sales, transaction summary and top profiles. Showcasing this set of slides titled Storage Facility Productivity Tracking And Management System Dashboard Diagrams PDF. The topics addressed in these templates are Transaction Summary, Registered Users, Tracking Management. All the content presented in this PPT design is completely editable. Download it and make adjustments in color, background, font etc. as per your unique business setting.
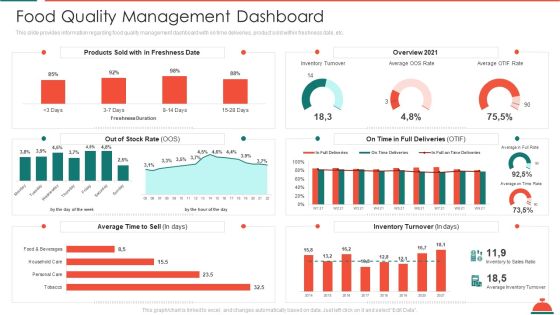
Food Quality Management Dashboard Increased Superiority For Food Products Graphics PDF
This slide provides information regarding food quality management dashboard with on time deliveries, product sold within freshness date, etc. Deliver and pitch your topic in the best possible manner with this food quality management dashboard increased superiority for food products graphics pdf. Use them to share invaluable insights on inventory, sales, time to sell and impress your audience. This template can be altered and modified as per your expectations. So, grab it now.
 Home
Home