Product Performance
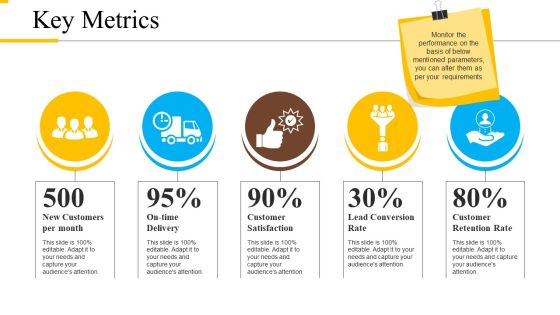
Key Metrics Ppt PowerPoint Presentation Professional Slideshow
This is a key metrics ppt powerpoint presentation professional slideshow. This is a five stage process. The stages in this process are new customers per month, on time delivery, customer satisfaction, lead conversion rate, customer retention rate.
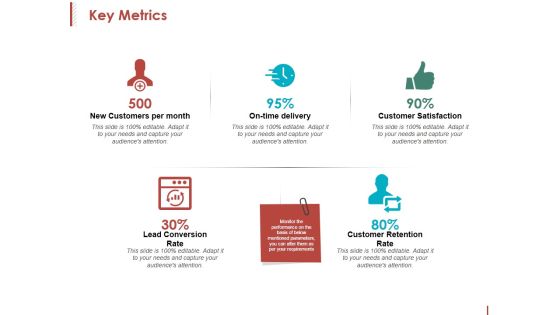
Key Metrics Ppt PowerPoint Presentation Inspiration Format
This is a key metrics ppt powerpoint presentation inspiration format. This is a five stage process. The stages in this process are new customers per month, on time delivery, customer satisfaction, customer retention rate.
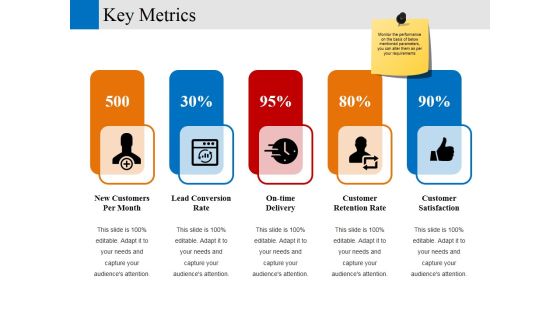
Key Metrics Ppt PowerPoint Presentation Layouts Ideas
This is a key metrics ppt powerpoint presentation layouts ideas. This is a five stage process. The stages in this process are new customers per month, lead conversion rate, on time delivery, customer retention rate, customer satisfaction.
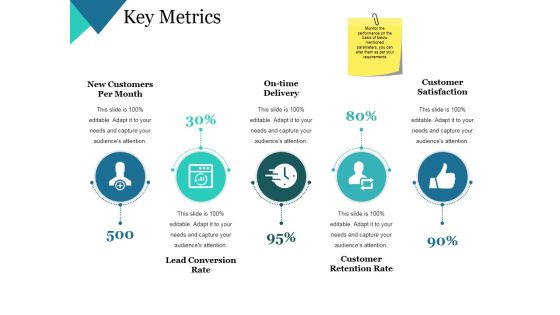
Key Metrics Ppt PowerPoint Presentation Themes
This is a key metrics ppt powerpoint presentation themes. This is a five stage process. The stages in this process are new customers per month, on time delivery, customer satisfaction, customer retention rate, lead conversion rate.

Brand Awareness Metrics Ppt PowerPoint Presentation Styles
This is a brand awareness metrics ppt powerpoint presentation styles. This is a four stage process. The stages in this process are twitter followers, facebook posts, facebook fans, brand mentions, new links.

Risk Metrics Dashboard Showing Priorities Infographics PDF
This slide illustrates graphical representation of corporate risk data. It includes monthly risks with their priorities, and risk summary quarter wise. Showcasing this set of slides titled Risk Metrics Dashboard Showing Priorities Infographics PDF. The topics addressed in these templates are Risk Metrics Dashboard Showing Priorities. All the content presented in this PPT design is completely editable. Download it and make adjustments in color, background, font etc. as per your unique business setting.
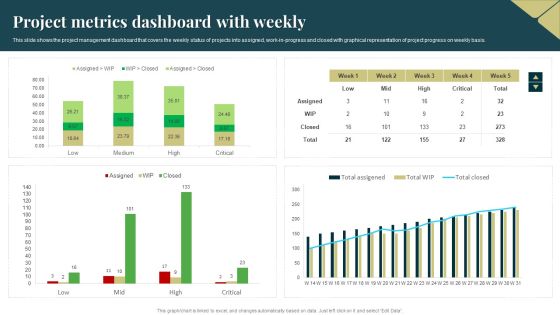
Project Metrics Dashboard With Weekly Formats PDF
This slide shows the project management dashboard that covers the weekly status of projects into assigned, work in progress and closed with graphical representation of project progress on weekly basis. Showcasing this set of slides titled Project Metrics Dashboard With Weekly Formats PDF. The topics addressed in these templates are Project Metrics, Dashboard With Weekly. All the content presented in this PPT design is completely editable. Download it and make adjustments in color, background, font etc. as per your unique business setting.
Metrics Showcasing Project Management Operations Icons PDF
This slide exhibits project management operations dashboard. It covers task status, budget status, pending tasks, activity progress status etc to track project progress. Showcasing this set of slides titled Metrics Showcasing Project Management Operations Icons PDF. The topics addressed in these templates are Metrics Showcasing, Project Management Operations. All the content presented in this PPT design is completely editable. Download it and make adjustments in color, background, font etc. as per your unique business setting.

Various CRM Program Success Metrics Designs PDF
This slide covers information regarding the metrics associated customer relationship to analyze CRM program success. Make sure to capture your audiences attention in your business displays with our gratis customizable Various CRM Program Success Metrics Designs PDF. These are great for business strategies, office conferences, capital raising or task suggestions. If you desire to acquire more customers for your tech business and ensure they stay satisfied, create your own sales presentation with these plain slides.
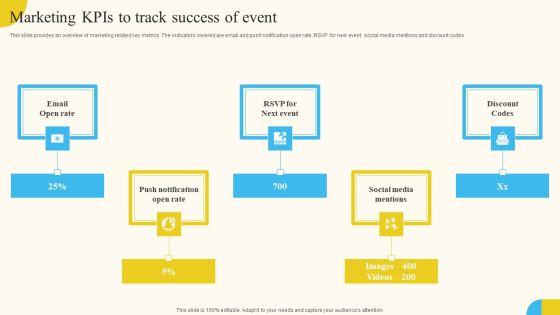
Marketing KPIS To Track Success Of Event Activities For Successful Launch Event Template PDF
This slide provides an overview of marketing related key metrics. The indicators covered are email and push notification open rate, RSVP for next event, social media mentions and discount codes. Slidegeeks is here to make your presentations a breeze with Marketing KPIS To Track Success Of Event Activities For Successful Launch Event Template PDF With our easy-to-use and customizable templates, you can focus on delivering your ideas rather than worrying about formatting. With a variety of designs to choose from, you are sure to find one that suits your needs. And with animations and unique photos, illustrations, and fonts, you can make your presentation pop. So whether you are giving a sales pitch or presenting to the board, make sure to check out Slidegeeks first.
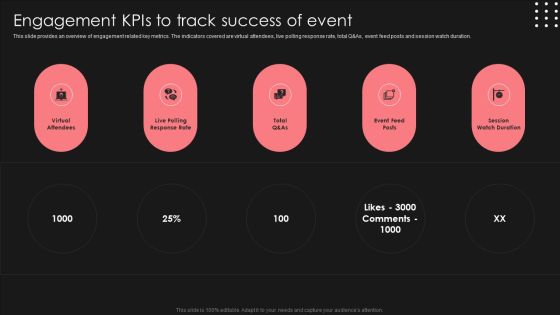
Positive Impact Of Effective Engagement Kpis To Track Success Of Event Professional PDF
This slide provides an overview of engagement related key metrics. The indicators covered are virtual attendees, live polling response rate, total Q And As, event feed posts and session watch duration. Coming up with a presentation necessitates that the majority of the effort goes into the content and the message you intend to convey. The visuals of a PowerPoint presentation can only be effective if it supplements and supports the story that is being told. Keeping this in mind our experts created Positive Impact Of Effective Engagement Kpis To Track Success Of Event Professional PDF to reduce the time that goes into designing the presentation. This way, you can concentrate on the message while our designers take care of providing you with the right template for the situation.

Smart Phone Launch Event Management Tasks Marketing Kpis To Track Success Of Event Information PDF
This slide provides an overview of marketing related key metrics. The indicators covered are email and push notification open rate, RSVP for next event, social media mentions and discount codes. This modern and well arranged Smart Phone Launch Event Management Tasks Marketing Kpis To Track Success Of Event Information PDF provides lots of creative possibilities. It is very simple to customize and edit with the Powerpoint Software. Just drag and drop your pictures into the shapes. All facets of this template can be edited with Powerpoint no extra software is necessary. Add your own material, put your images in the places assigned for them, adjust the colors, and then you can show your slides to the world, with an animated slide included.

Marketing KPIS To Track Success Of Event Stakeholder Engagement Plan For Launch Event Mockup PDF
This slide provides an overview of marketing related key metrics. The indicators covered are email and push notification open rate, RSVP for next event, social media mentions and discount codes. Slidegeeks is one of the best resources for PowerPoint templates. You can download easily and regulate Marketing KPIS To Track Success Of Event Stakeholder Engagement Plan For Launch Event Mockup PDF for your personal presentations from our wonderful collection. A few clicks is all it takes to discover and get the most relevant and appropriate templates. Use our Templates to add a unique zing and appeal to your presentation and meetings. All the slides are easy to edit and you can use them even for advertisement purposes.

Critical Measures For Ensuring How Firm Handle Various Insider Threats At Workplace Graphics PDF
This slide provides information regarding how firm will handle insider threats through employee training, IT security and HR coordination, etc. Formulating a presentation can take up a lot of effort and time, so the content and message should always be the primary focus. The visuals of the PowerPoint can enhance the presenters message, so our Critical Measures For Ensuring How Firm Handle Various Insider Threats At Workplace Graphics PDF was created to help save time. Instead of worrying about the design, the presenter can concentrate on the message while our designers work on creating the ideal templates for whatever situation is needed. Slidegeeks has experts for everything from amazing designs to valuable content, we have put everything into Critical Measures For Ensuring How Firm Handle Various Insider Threats At Workplace Graphics PDF.
Five Years Go Commodity Roadmap With Features And Metrics Icons
Introducing our five years go commodity roadmap with features and metrics icons. This PPT presentation is Google Slides compatible, therefore, you can share it easily with the collaborators for measuring the progress. Also, the presentation is available in both standard screen and widescreen aspect ratios. So edit the template design by modifying the font size, font type, color, and shapes as per your requirements. As this PPT design is fully editable it can be presented in PDF, JPG and PNG formats.
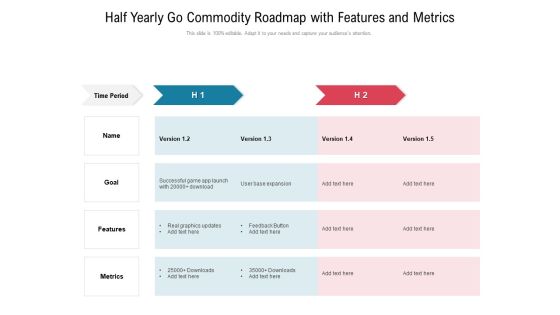
Half Yearly Go Commodity Roadmap With Features And Metrics Diagrams
Introducing our half yearly go commodity roadmap with features and metrics diagrams. This PPT presentation is Google Slides compatible, therefore, you can share it easily with the collaborators for measuring the progress. Also, the presentation is available in both standard screen and widescreen aspect ratios. So edit the template design by modifying the font size, font type, color, and shapes as per your requirements. As this PPT design is fully editable it can be presented in PDF, JPG and PNG formats.
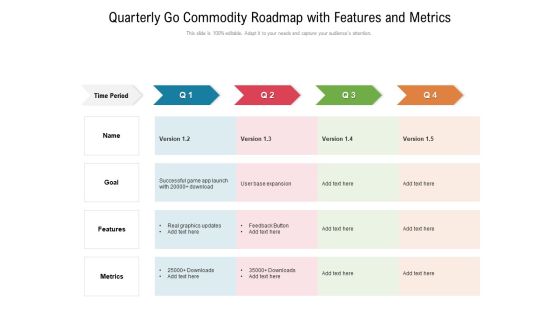
Quarterly Go Commodity Roadmap With Features And Metrics Ideas
Introducing our quarterly go commodity roadmap with features and metrics ideas. This PPT presentation is Google Slides compatible, therefore, you can share it easily with the collaborators for measuring the progress. Also, the presentation is available in both standard screen and widescreen aspect ratios. So edit the template design by modifying the font size, font type, color, and shapes as per your requirements. As this PPT design is fully editable it can be presented in PDF, JPG and PNG formats.

Six Months Go Commodity Roadmap With Features And Metrics Formats
Introducing our six months go commodity roadmap with features and metrics formats. This PPT presentation is Google Slides compatible, therefore, you can share it easily with the collaborators for measuring the progress. Also, the presentation is available in both standard screen and widescreen aspect ratios. So edit the template design by modifying the font size, font type, color, and shapes as per your requirements. As this PPT design is fully editable it can be presented in PDF, JPG and PNG formats.
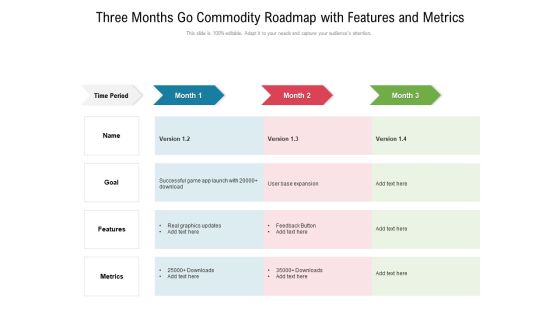
Three Months Go Commodity Roadmap With Features And Metrics Sample
Introducing our three months go commodity roadmap with features and metrics sample. This PPT presentation is Google Slides compatible, therefore, you can share it easily with the collaborators for measuring the progress. Also, the presentation is available in both standard screen and widescreen aspect ratios. So edit the template design by modifying the font size, font type, color, and shapes as per your requirements. As this PPT design is fully editable it can be presented in PDF, JPG and PNG formats.

Customer Behavioral Data And Analytics Customer Experience Metrics Topics PDF
Presenting customer behavioral data and analytics customer experience metrics topics pdf to provide visual cues and insights. Share and navigate important information on seven stages that need your due attention. This template can be used to pitch topics like measure net promoter score, customer satisfaction score, customer churn rate, customer retention rate, customer lifetime value. In addtion, this PPT design contains high resolution images, graphics, etc, that are easily editable and available for immediate download.

EUC Metrics Structure Ppt PowerPoint Presentation Icon Model PDF
This slide depicts end user computing metrics. It covers metrics related to end user sentiment, system data and workflow simplification that helps to measure and enhance end user experience. Presenting EUC Metrics Structure Ppt PowerPoint Presentation Icon Model PDF to dispense important information. This template comprises three stages. It also presents valuable insights into the topics including Sentiment Metrics, System Metrics, Simplification Metrics. This is a completely customizable PowerPoint theme that can be put to use immediately. So, download it and address the topic impactfully.
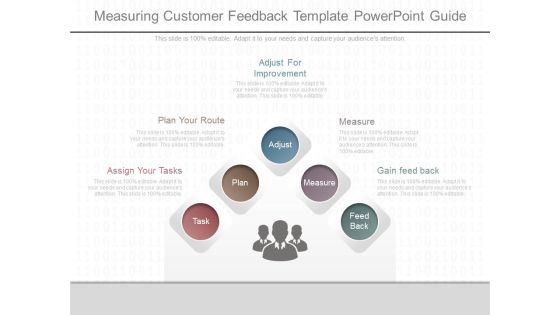
Measuring Customer Feedback Template Powerpoint Guide
This is a measuring customer feedback template powerpoint guide. This is a five stage process. The stages in this process are adjust for improvement, plan your route, assign your tasks, measure, gain feed back, adjust, measure, feed back, plan, task.

KPI Dashboard To Measure Workforce Increase Ppt Slides Elements PDF
This slide shows dashboard which can be used to present the workforce increase in the organization. It includes metrics such as gender wise headcount, department wise headcount, etc. Showcasing this set of slides titled KPI Dashboard To Measure Workforce Increase Ppt Slides Elements PDF. The topics addressed in these templates are Employees Salary, Headcount, Gender Wise, Headcount Increase. All the content presented in this PPT design is completely editable. Download it and make adjustments in color, background, font etc. as per your unique business setting.
Eight Ideas For Successful Project Management With Quality Metrics Ppt PowerPoint Presentation Icon Show PDF
Presenting eight ideas for successful project management with quality metrics ppt powerpoint presentation icon show pdf to dispense important information. This template comprises eight stages. It also presents valuable insights into the topics including project deliverables, goals and benefits, quality metrics, risk analysis, project budget. This is a completely customizable PowerPoint theme that can be put to use immediately. So, download it and address the topic impactfully.

Eleven Ideas For Successful Project Management With Quality Metrics Ppt PowerPoint Presentation Portfolio Graphics PDF
Presenting eleven ideas for successful project management with quality metrics ppt powerpoint presentation portfolio graphics pdf to dispense important information. This template comprises eleven stages. It also presents valuable insights into the topics including project deliverables, goals and benefits, quality metrics, risk analysis, project budget. This is a completely customizable PowerPoint theme that can be put to use immediately. So, download it and address the topic impactfully.
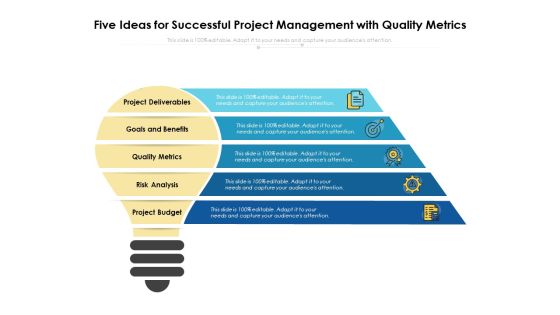
Five Ideas For Successful Project Management With Quality Metrics Ppt PowerPoint Presentation File Vector PDF
Persuade your audience using this five ideas for successful project management with quality metrics ppt powerpoint presentation file vector pdf. This PPT design covers five stages, thus making it a great tool to use. It also caters to a variety of topics including project deliverables, goals and benefits, quality metrics, risk analysis, project budget. Download this PPT design now to present a convincing pitch that not only emphasizes the topic but also showcases your presentation skills.
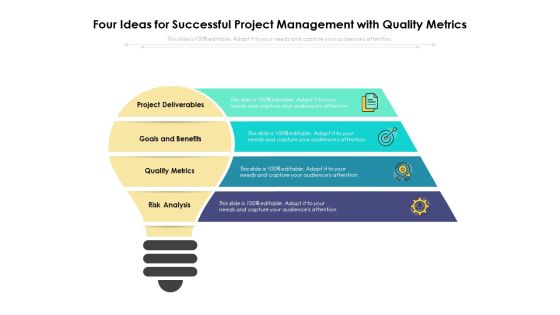
Four Ideas For Successful Project Management With Quality Metrics Ppt PowerPoint Presentation File Visuals PDF
Persuade your audience using this four ideas for successful project management with quality metrics ppt powerpoint presentation file visuals pdf. This PPT design covers four stages, thus making it a great tool to use. It also caters to a variety of topics including project deliverables, goals and benefits, quality metrics, risk analysis. Download this PPT design now to present a convincing pitch that not only emphasizes the topic but also showcases your presentation skills.
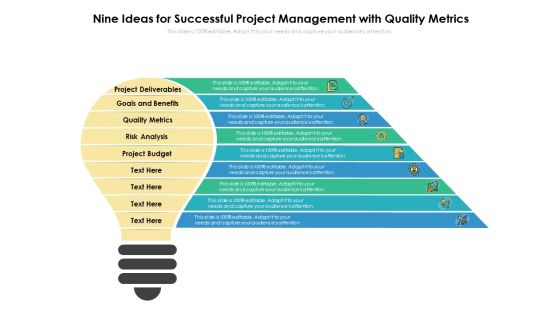
Nine Ideas For Successful Project Management With Quality Metrics Ppt PowerPoint Presentation Professional Visual Aids PDF
Presenting nine ideas for successful project management with quality metrics ppt powerpoint presentation professional visual aids pdf to dispense important information. This template comprises nine stages. It also presents valuable insights into the topics including project deliverables, goals and benefits, quality metrics, risk analysis, project budget. This is a completely customizable PowerPoint theme that can be put to use immediately. So, download it and address the topic impactfully.

Seven Ideas For Successful Project Management With Quality Metrics Ppt PowerPoint Presentation Pictures Graphic Tips PDF
Persuade your audience using this seven ideas for successful project management with quality metrics ppt powerpoint presentation pictures graphic tips pdf. This PPT design covers seven stages, thus making it a great tool to use. It also caters to a variety of topics including project deliverables, goals and benefits, quality metrics, risk analysis, project budget. Download this PPT design now to present a convincing pitch that not only emphasizes the topic but also showcases your presentation skills.

Three Ideas For Successful Project Management With Quality Metrics Ppt PowerPoint Presentation Pictures Graphics PDF
Persuade your audience using this three ideas for successful project management with quality metrics ppt powerpoint presentation pictures graphics pdf. This PPT design covers three stages, thus making it a great tool to use. It also caters to a variety of topics including project deliverables, goals and benefits, quality metrics. Download this PPT design now to present a convincing pitch that not only emphasizes the topic but also showcases your presentation skills.
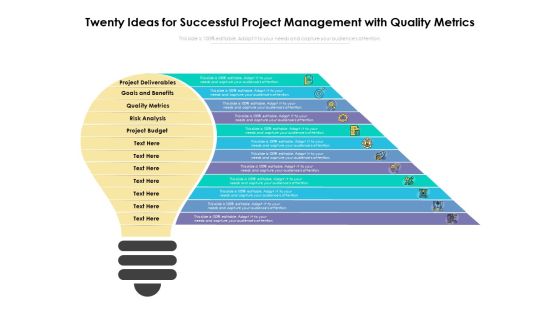
Twenty Ideas For Successful Project Management With Quality Metrics Ppt PowerPoint Presentation Model Rules PDF
Presenting twenty ideas for successful project management with quality metrics ppt powerpoint presentation model rules pdf to dispense important information. This template comprises twelve stages. It also presents valuable insights into the topics including project deliverables, goals and benefits, quality metrics, risk analysis, project budget. This is a completely customizable PowerPoint theme that can be put to use immediately. So, download it and address the topic impactfully.
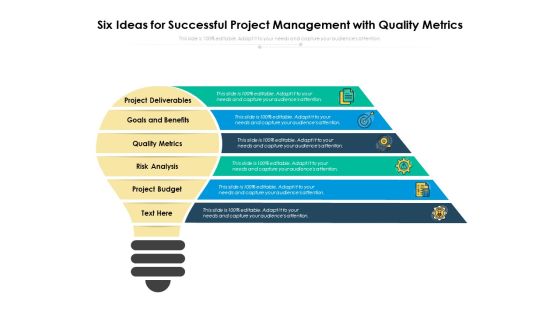
Six Ideas For Successful Project Management With Quality Metrics Ppt PowerPoint Presentation Model Template PDF
Presenting six ideas for successful project management with quality metrics ppt powerpoint presentation model template pdf to dispense important information. This template comprises six stages. It also presents valuable insights into the topics including project deliverables, goals and benefits, quality metrics, risk analysis, project budget. This is a completely customizable PowerPoint theme that can be put to use immediately. So, download it and address the topic impactfully.
Ten Ideas For Successful Project Management With Quality Metrics Ppt PowerPoint Presentation Layouts Slide Download PDF
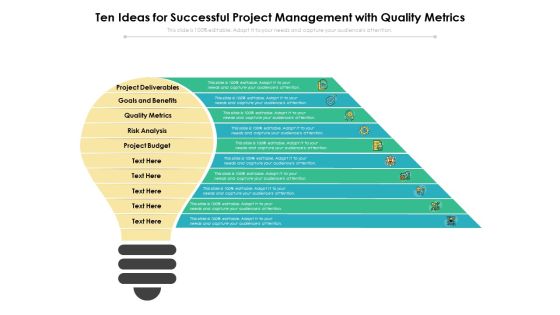
Presenting ten ideas for successful project management with quality metrics ppt powerpoint presentation layouts slide download pdf to dispense important information. This template comprises ten stages. It also presents valuable insights into the topics including project deliverables, goals and benefits, quality metrics, risk analysis, project budget. This is a completely customizable PowerPoint theme that can be put to use immediately. So, download it and address the topic impactfully.

Stock Photo Measuring Tape Construction PowerPoint Slide
This image displays graphic of Measuring Tape on white background. Use this image to depict concept of measurement and engineering. Use this image and make an impressive presentation.

Stock Photo Measuring Tape PowerPoint Slide
This image displays graphic of Measuring Tape on white background. Use this image to depict concept of measurement and engineering. Use this image and make an impressive presentation.
Measure Customer Satisfaction Example Powerpoint Slides
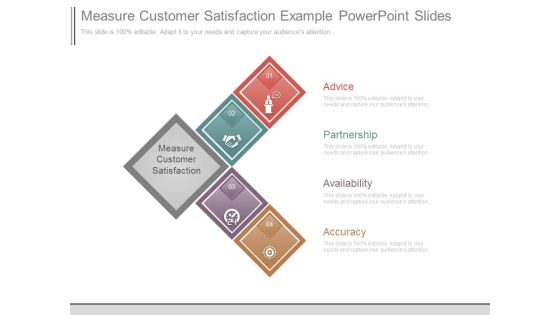
This is a measure customer satisfaction example powerpoint slides. This is a four stage process. The stages in this process are advice, partnership, availability, accuracy, measure customer satisfaction.
Step 2 Measure Ppt PowerPoint Presentation Introduction
This is a step 2 measure ppt powerpoint presentation introduction. This is a five stage process. The stages in this process are measure, strategy, business, marketing, management.

Organization Impact Metrics Strategic Themes PDF
This slides the metrics That assess how your security awareness plan serves the overall security system of your company, and therefore the organizations mission.Presenting organization impact metrics strategic themes pdf. to provide visual cues and insights. Share and navigate important information on one stage that need your due attention. This template can be used to pitch topics like data loss incidents, infected computers, total number of computers currently corrupted. In addtion, this PPT design contains high resolution images, graphics, etc, that are easily editable and available for immediate download.

Dashboard Depicting Customer Accomplishment Metrics Slides PDF
This slide covers the dashboard that depicts customer success metrics which includes total number of customers, net promoter score, support tickets, opportunities, contacts which are active and inactive, customer journey such as onboarding, growth, value achieved, renewal, etc. Showcasing this set of slides titled dashboard depicting customer accomplishment metrics slides pdf. The topics addressed in these templates are customers, unhealthy, support tickets. All the content presented in this PPT design is completely editable. Download it and make adjustments in color, background, font etc. as per your unique business setting.

Project Metrics Dashboard Showing Dependencies Brochure PDF
This slide covers the project management dashboard which shows the risks, assumptions, issues, dependencies, repairs and maintenance with starting and resolution date, version, overall status that is recovering, name of the owner, etc. Showcasing this set of slides titled Project Metrics Dashboard Showing Dependencies Brochure PDF. The topics addressed in these templates are Project Metrics, Dashboard Showing Dependencies. All the content presented in this PPT design is completely editable. Download it and make adjustments in color, background, font etc. as per your unique business setting.

Project Metrics Dashboard With Priorities Formats PDF
This slide focuses on project management dashboard which covers the reporting date of project, different tasks such as setting kick-off meeting, final resource planning, staffing, testing, hardware configuration, etc. with pending items such as decisions, actions and requests. Showcasing this set of slides titled Project Metrics Dashboard With Priorities Formats PDF. The topics addressed in these templates are Budget, Project Metrics Dashboard. All the content presented in this PPT design is completely editable. Download it and make adjustments in color, background, font etc. as per your unique business setting.
Project Metrics Dashboard With Speedometers Themes PDF
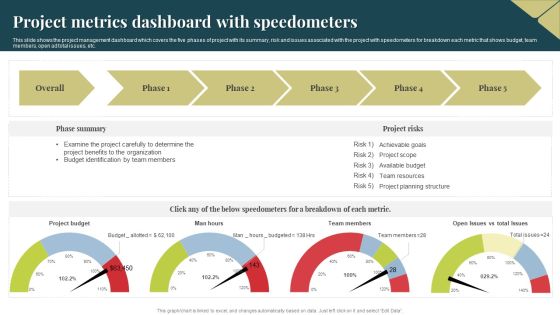
This slide shows the project management dashboard which covers the five phases of project with its summary, risk and issues associated with the project with speedometers for breakdown each metric that shows budget, team members, open ad total issues, etc. Showcasing this set of slides titled Project Metrics Dashboard With Speedometers Themes PDF. The topics addressed in these templates are Budget, Project Benefits, Organization. All the content presented in this PPT design is completely editable. Download it and make adjustments in color, background, font etc. as per your unique business setting.

Project Metrics Dashboard With Stages Download PDF
This slide shows the project management dashboard which includes start and end date if project, its duration, status of the project, key project links and project stages with metrics such as proposal, kick off, discovery, actions, optimization , etc. Pitch your topic with ease and precision using this Project Metrics Dashboard With Stages Download PDF. This layout presents information on Economic, Project Plan, Execution. It is also available for immediate download and adjustment. So, changes can be made in the color, design, graphics or any other component to create a unique layout.

Determine Essential Pipeline Metrics Mockup PDF
This slide provides information regarding the essential pipeline metrics such as opportunity dollar size vs. average won deal size, opportunity age vs. win cycle and win rate. This is a Determine Essential Pipeline Metrics Mockup PDF template with various stages. Focus and dispense information on three stages using this creative set, that comes with editable features. It contains large content boxes to add your information on topics like Opportunity, Determine Numbers, Average Deal. You can also showcase facts, figures, and other relevant content using this PPT layout. Grab it now.

Website Design Procedure Success Metrics Formats PDF
This slide showcases website design process metrics the amount of interaction your website visitors have with your website and online brand. It includes page reviews , average time , average session duration , bounce rate , traffic sources etc. Showcasing this set of slides titled Website Design Procedure Success Metrics Formats PDF. The topics addressed in these templates are Page Views, Average Time, Bounce Rate . All the content presented in this PPT design is completely editable. Download it and make adjustments in color, background, font etc. as per your unique business setting.
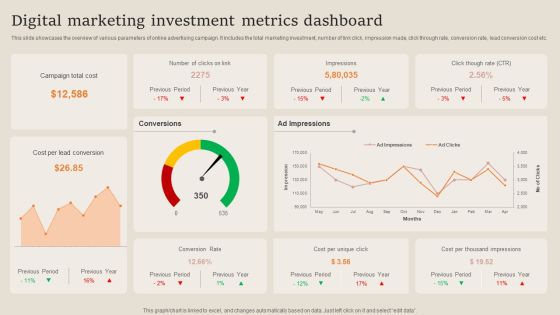
Digital Marketing Investment Metrics Dashboard Professional PDF
This slide showcases the overview of various parameters of online advertising campaign. It includes the total marketing investment, number of link click, impression made, click through rate, conversion rate, lead conversion cost etc. Showcasing this set of slides titled Digital Marketing Investment Metrics Dashboard Professional PDF. The topics addressed in these templates are Campaign Total Cost, Cost Per Lead Conversion, Investment Metrics Dashboard. All the content presented in this PPT design is completely editable. Download it and make adjustments in color, background, font etc. as per your unique business setting.

Web Metrics Roe Diagram Powerpoint Ideas
This is a web metrics roe diagram powerpoint ideas. This is a five stage process. The stages in this process are page views in the first visit, total time spent on the site over multiple visits, bounces, total page views across multiple visits, time spent on the site in the first visit.

Retail Inventory Metrics Systems Ppt Powerpoint Images
This is a retail inventory metrics systems ppt powerpoint images. This is a one stage process. The stages in this process are mobility, labor operations, store pulse, labor budgeting, labor forecasting, labor scheduling, employee self service, time and attendance, kpi activator, store walk, task management, store execution, advanced analytics and reporting.

Kpi Metric Dashboard Diagram Ppt Example
This is a kpi metric dashboard diagram ppt example. This is a seven stage process. The stages in this process are avg cost hour, safety inspection score, on time shipment, ndt acceptance rate, ncr customer accept, annual pipeline value, indirect man hours.
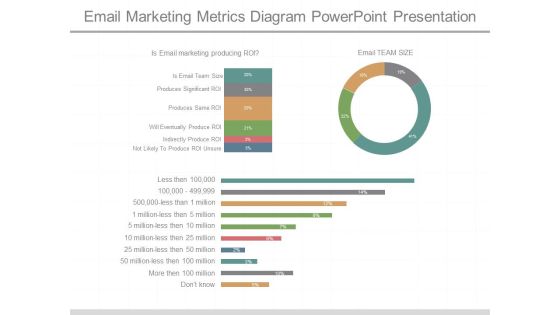
Email Marketing Metrics Diagram Powerpoint Presentation
This is a email marketing metrics diagram powerpoint presentation. This is a three stage process. The stages in this process are is email marketing producing roi, is email team size, produces significant roi, produces same roi, will eventually produce roi, indirectly produce roi, not likely to produce roi unsure, email team size.
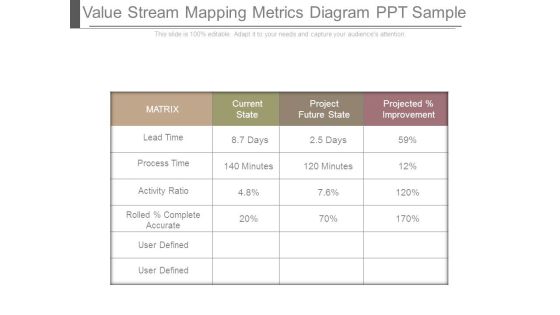
Value Stream Mapping Metrics Diagram Ppt Sample
This is a value stream mapping metrics diagram ppt sample. This is a four stage process. The stages in this process are matrix, current state, project future state, projected improvement, lead time, days, process time, activity ratio, rolled complete accurate, user defined, minutes.

Client Experience Structure With Outcome Metrics Slides PDF
This slide contains the framework on customer experience to know their engagement with the brand. It also includes measures and metrics outcome, perception and interaction. Persuade your audience using this Client Experience Structure With Outcome Metrics Slides PDF. This PPT design covers Three stages, thus making it a great tool to use. It also caters to a variety of topics including Outcome Metrics, Perception Metrics, Interaction Metrics. Download this PPT design now to present a convincing pitch that not only emphasizes the topic but also showcases your presentation skills.

Social Business Model With Objectives And Kpis Ppt PowerPoint Presentation Professional Structure PDF
Presenting social business model with objectives and kpis ppt powerpoint presentation professional structure pdf to dispense important information. This template comprises three stages. It also presents valuable insights into the topics including social business programme, management framework, implementation, high level design, concept integration to business model, social media programme, content focus and process, tools, systems and measures, guides, policies and manuals, training and education. This is a completely customizable PowerPoint theme that can be put to use immediately. So, download it and address the topic impactfully.

Sample Project Management Metrics Ppt Powerpoint Show
This is a sample project management metrics ppt powerpoint show. This is a seven stage process. The stages in this process are impart, routes, sections, summary, estimates, metadata, samples, create tops, import samples, validate, lrs, sections, samples, coverage, verify, sample, adequacy, expansion factor, sample data item check, reports, spatial intersection, impart, routes, sections, summary, estimates, metadata, samples, create tops, import samples, validate, lrs, sections, samples, coverage, verify, sample, adequacy, expansion factor, sample data item check, reports, spatial intersection.

Dashboard Depicting Construction Project Metrics Inspiration PDF
This slide states the construction project management dashboard which includes estimated costs and duration, site inspections, status of regional projects, name of customers from different countries, etc. Pitch your topic with ease and precision using this Dashboard Depicting Construction Project Metrics Inspiration PDF. This layout presents information on Estimated Cost, Estimated Duration, Projects. It is also available for immediate download and adjustment. So, changes can be made in the color, design, graphics or any other component to create a unique layout.
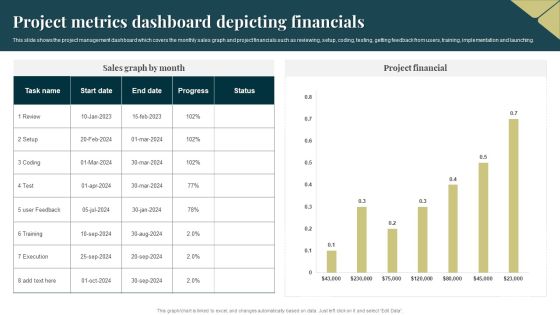
Project Metrics Dashboard Depicting Financials Pictures PDF
This slide shows the project management dashboard which covers the monthly sales graph and project financials such as reviewing, setup, coding, testing, getting feedback from users, training, implementation and launching. Pitch your topic with ease and precision using this Project Metrics Dashboard Depicting Financials Pictures PDF. This layout presents information on Execution, Project Financial. It is also available for immediate download and adjustment. So, changes can be made in the color, design, graphics or any other component to create a unique layout.

Project Metrics Dashboard With Commitments Mockup PDF
This slide focuses on the project management dashboard which includes the actual income, status, duration progress, project health with work schedule and budget, expenses, commitments, current status such as order, revised, billed, etc. Showcasing this set of slides titled Project Metrics Dashboard With Commitments Mockup PDF. The topics addressed in these templates are Expenses, Budget, Average. All the content presented in this PPT design is completely editable. Download it and make adjustments in color, background, font etc. as per your unique business setting.

Campaign Metrics With Traffic Report Information PDF
This template covers about traffic generated with daily number of sessions by user. This further includes behavioral response through analyzing page views. Pitch your topic with ease and precision using this Campaign Metrics With Traffic Report Information PDF. This layout presents information on Origins, Behaviour, Bounce Rate. It is also available for immediate download and adjustment. So, changes can be made in the color, design, graphics or any other component to create a unique layout.
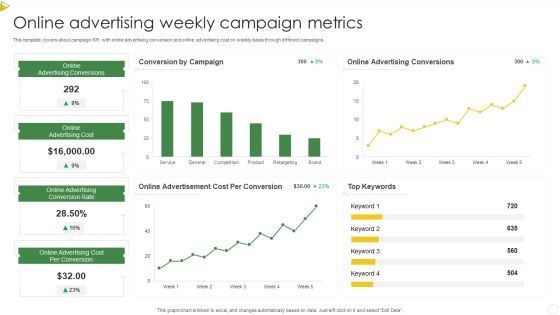
Online Advertising Weekly Campaign Metrics Designs PDF
This template covers about campaign KPI with online advertising conversion and online advertising cost on weekly basis through different campaigns. Showcasing this set of slides titled Online Advertising Weekly Campaign Metrics Designs PDF. The topics addressed in these templates are Online Advertising Cost, Online Advertising Conversions. All the content presented in this PPT design is completely editable. Download it and make adjustments in color, background, font etc. as per your unique business setting.
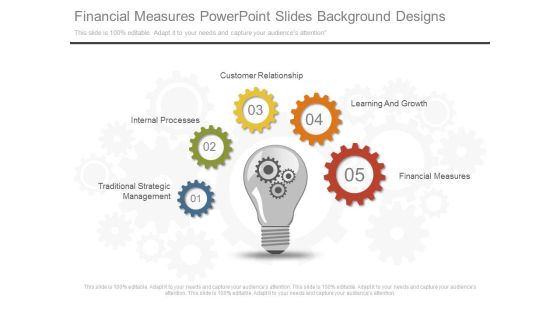
Financial Measures Powerpoint Slides Background Designs
This is a financial measures powerpoint slides background designs. This is a five stage process. The stages in this process are traditional strategic management, internal processes, customer relationship, learning and growth, financial measures.
 Home
Home