Product Innovation
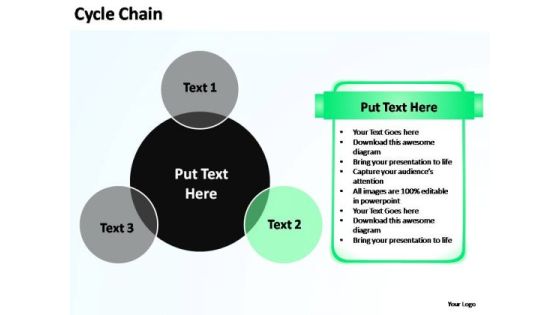
PowerPoint Process Success Chain Ppt Themes
PowerPoint Process Success Chain PPT Themes-Most events and in every aspect of life are invariably interlinked. Use this chains graphic to outline your thoughts and their inherent interdependance to acheive the final outcome. Highlight the strength and durability of your thoughts, ideas and products.-PowerPoint Process Success Chain PPT Themes
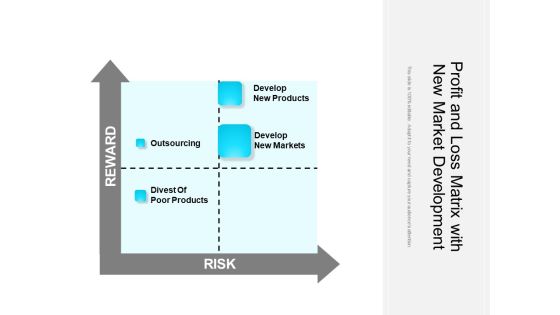
Profit And Loss Matrix With New Market Development Ppt PowerPoint Presentation Professional Graphics PDF
Presenting this set of slides with name profit and loss matrix with new market development ppt powerpoint presentation professional graphics pdf. This is a four stage process. The stages in this process are develop new products, develop new markets, outsourcing, divest of poor products, risk, reward. This is a completely editable PowerPoint presentation and is available for immediate download. Download now and impress your audience.

Touch Screen Technology PowerPoint Templates And PowerPoint Themes 1112
We present our Touch Screen Technology PowerPoint Templates And PowerPoint Themes 1112.Use our Business PowerPoint Templates because, You have the plans to increase the strength of your business relationships. Use our Future PowerPoint Templates because, Our template will help pinpoint their viability. Use our Science PowerPoint Templates because,are the tools that helped most of us evolve. Use our Technology PowerPoint Templates because, Bullet-point your thoughts and ideas to profitably accomplish every step of every stage along the way. Use our Metaphor PowerPoint Templates because, Explain to your group how they mesh together to drive the whole.Use these PowerPoint slides for presentations relating to Hand pushing on a touch Business Future Science Technology Metaphor. The prominent colors used in the PowerPoint template are White, Tan, Black

Sales Departmental Goals And Achievement Chart Ppt File Good PDF
This slide illustrates the matrix for sales targets and achievement. It includes team members names, products, sales targets, achievement till date, improvement rates etc. Showcasing this set of slides titled Sales Departmental Goals And Achievement Chart Ppt File Good PDF. The topics addressed in these templates are Team Members, Product, Sales Target. All the content presented in this PPT design is completely editable. Download it and make adjustments in color, background, font etc. as per your unique business setting.

Costing Solution Diagram Powerpoint Presentation
This is a costing solution diagram powerpoint presentation. This is a six stage process. The stages in this process are equivalent production, computation of cost, valuation of output units, raw material expenses, process costs, tool cost.
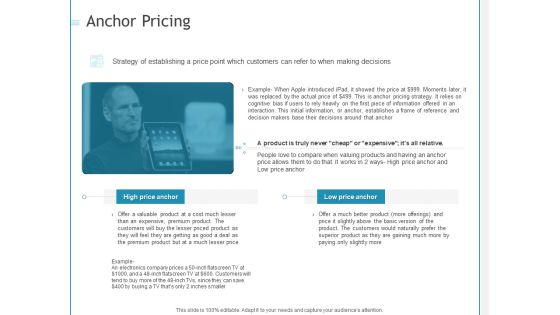
Developing A Right Strategy For Business Anchor Pricing Ppt Inspiration Infographics PDF
This is a developing a right strategy for business anchor pricing ppt inspiration infographics pdf template with various stages. Focus and dispense information on one stage using this creative set, that comes with editable features. It contains large content boxes to add your information on topics like strategy establishing, price compare when valuing products, expensive premium product, electronics company prices, low price anchor, high price anchor. You can also showcase facts, figures, and other relevant content using this PPT layout. Grab it now.
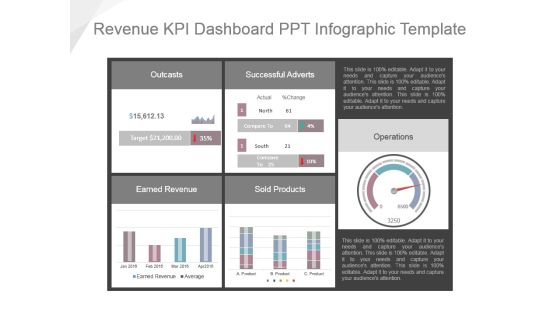
Revenue Kpi Dashboard Ppt Infographic Template
This is a revenue kpi dashboard ppt infographic template. This is a five stage process. The stages in this process are outcasts, successful adverts, earned revenue, sold products, operations.

Clustered Column Line Ppt PowerPoint Presentation Gallery Graphics Example
This is a clustered column line ppt powerpoint presentation gallery graphics example. This is a four stage process. The stages in this process are product, growth, success, business, marketing.

Clustered Column Line Ppt PowerPoint Presentation Show Influencers
This is a clustered column line ppt powerpoint presentation show influencers. This is a four stage process. The stages in this process are financial year, sales in percentage, product, growth, success.
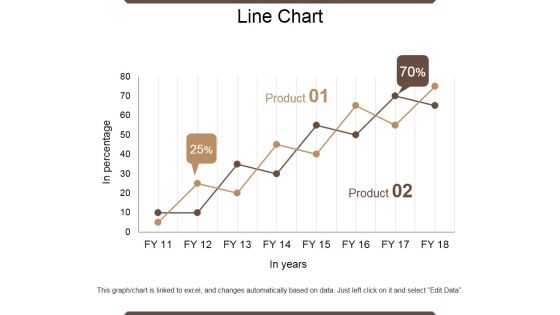
Line Chart Ppt PowerPoint Presentation Outline Infographic Template
This is a line chart ppt powerpoint presentation outline infographic template. This is a two stage process. The stages in this process are in percentage, product, in year, growth, success.

Stacked Area Clustered Column Ppt PowerPoint Presentation Show Guidelines
This is a stacked area clustered column ppt powerpoint presentation show guidelines. This is a four stage process. The stages in this process are in percentage, product, bar graph, growth, success.
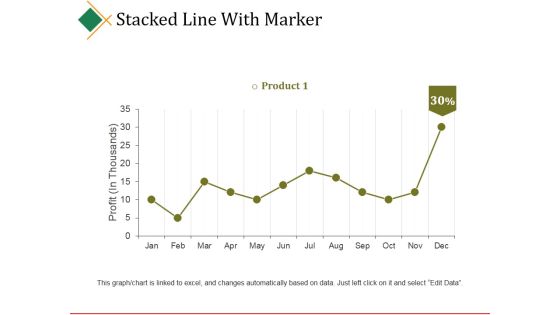
Stacked Line With Marker Ppt PowerPoint Presentation Model Graphics Download
This is a stacked line with marker ppt powerpoint presentation model graphics download. This is a twelve stage process. The stages in this process are product, profit, business, marketing, success.

Combo Chart Ppt PowerPoint Presentation Icon Design Templates
This is a combo chart ppt powerpoint presentation icon design templates. This is a three stage process. The stages in this process are market size, growth rate, product, business, success.
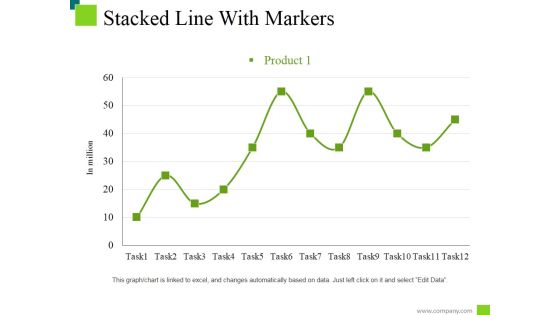
Stacked Line With Markers Ppt PowerPoint Presentation Infographic Template Deck
This is a stacked line with markers ppt powerpoint presentation infographic template deck. This is a twelve stage process. The stages in this process are product, task, business, marketing, success.

Stacked Area Clustered Column Ppt PowerPoint Presentation Inspiration Shapes
This is a stacked area clustered column ppt powerpoint presentation inspiration shapes. This is a four stage process. The stages in this process are in percentage, product, growth, success, graph.
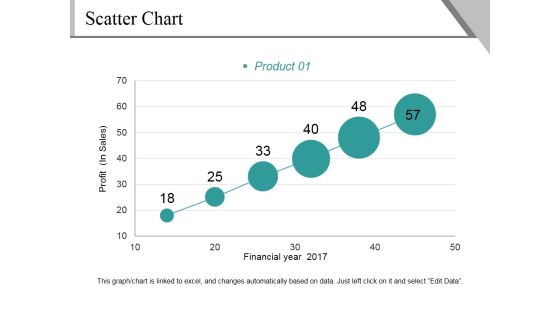
Scatter Chart Ppt PowerPoint Presentation File Background Image
This is a scatter chart ppt powerpoint presentation file background image. This is a six stage process. The stages in this process are profit, financial year, product, growth, success.

Combo Chart Ppt PowerPoint Presentation Summary Slides
This is a combo chart ppt powerpoint presentation summary slides. This is a three stage process. The stages in this process are market size, product, growth rate, bar graph, success.

Area Chart Ppt PowerPoint Presentation Infographics Visual Aids
This is a area chart ppt powerpoint presentation infographics visual aids. This is a two stage process. The stages in this process are product, area chart, in percentage, growth, success.
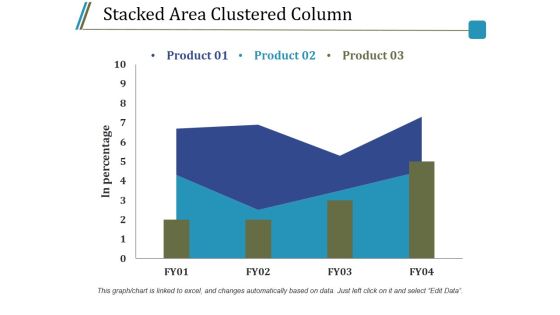
Stacked Area Clustered Column Ppt PowerPoint Presentation Model Guidelines
This is a stacked area clustered column ppt powerpoint presentation model guidelines. This is a three stage process. The stages in this process are product, in percentage, bar graph, growth, success.

Area Chart Ppt PowerPoint Presentation Infographic Template Layout
This is a area chart ppt powerpoint presentation infographic template layout. This is a two stage process. The stages in this process are product, profit, area chart, growth, success.
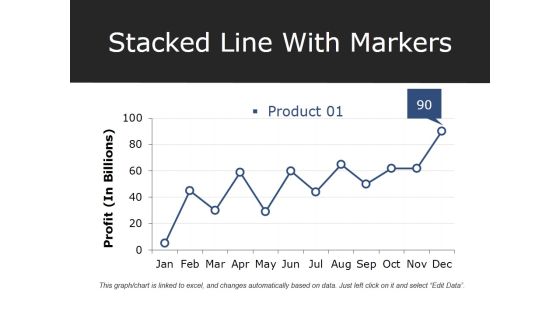
Stacked Line With Markers Ppt PowerPoint Presentation Professional Deck
This is a stacked line with markers ppt powerpoint presentation professional deck. This is a one stage process. The stages in this process are product, profit, growth, success, graph.

Column Chart Ppt PowerPoint Presentation Gallery Background
This is a column chart ppt powerpoint presentation gallery background. This is a two stage process. The stages in this process are product, sales in percentage, financial year, graph, success.

Line Chart Ppt PowerPoint Presentation Professional Graphics Design
This is a line chart ppt powerpoint presentation professional graphics design. This is a two stage process. The stages in this process are financial years, sales in percentage, product, growth, success.
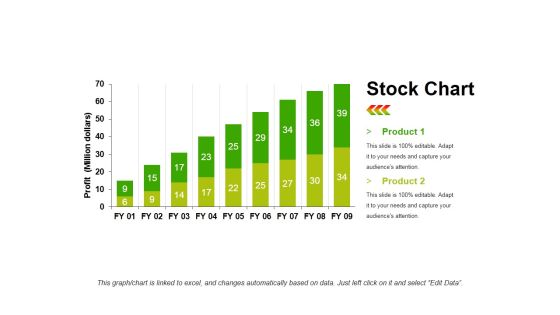
Stock Chart Template 1 Ppt PowerPoint Presentation Infographic Template Objects
This is a stock chart template 1 ppt powerpoint presentation infographic template objects. This is a two stage process. The stages in this process are product, profit, bar graph, growth, success.

Stacked Area Clustered Column Ppt PowerPoint Presentation File Background Designs
This is a stacked area clustered column ppt powerpoint presentation file background designs. This is a three stage process. The stages in this process are product, in percentage, growth, success, bar graph.
Stacked Line With Markers Ppt PowerPoint Presentation Icon Themes
This is a stacked line with markers ppt powerpoint presentation icon themes. This is a one stage process. The stages in this process are product, in million, tasks, line graph, success.

Stacked Area Clustered Column Ppt PowerPoint Presentation Summary Professional
This is a stacked area clustered column ppt powerpoint presentation summary professional. This is a three stage process. The stages in this process are product, bar graph, growth, success, in percentage.
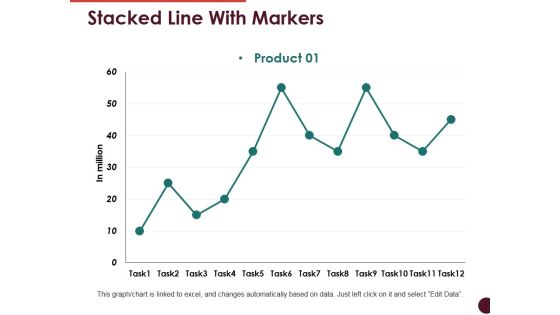
Stacked Line With Markers Ppt PowerPoint Presentation Show Templates
This is a stacked line with markers ppt powerpoint presentation show templates. This is a one stage process. The stages in this process are product, bar graph, growth, success, business.

Column Chart Ppt PowerPoint Presentation Model Graphics Download
This is a column chart ppt powerpoint presentation model graphics download. This is a two stage process. The stages in this process are product, financial year, sales in percentage, bar graph, success.

Line Chart Ppt PowerPoint Presentation Layouts Example
This is a line chart ppt powerpoint presentation layouts example. This is a two stage process. The stages in this process are sales in percentage, product, financial years, growth, success.
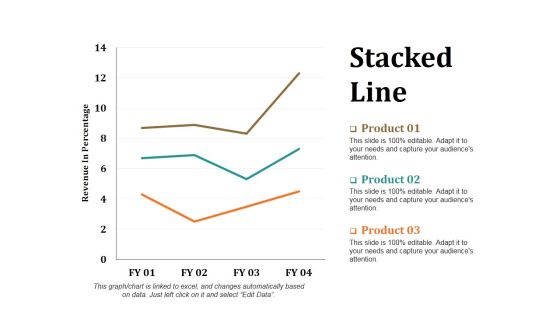
Stacked Line Ppt PowerPoint Presentation Layouts Portrait
This is a stacked line ppt powerpoint presentation layouts portrait. This is a three stage process. The stages in this process are revenue in percentage, stacked line, product, growth, success.

Clustered Column Line Ppt PowerPoint Presentation Summary Background Image
This is a clustered column line ppt powerpoint presentation summary background image. This is a four stage process. The stages in this process are in percentage, product, graph, growth, success.

Column Chart Ppt PowerPoint Presentation Model Clipart Images
This is a column chart ppt powerpoint presentation model clipart images. This is a two stage process. The stages in this process are product, bar graph, growth, success, business.

Line Chart Ppt PowerPoint Presentation File Example File
This is a line chart ppt powerpoint presentation file example file. This is a two stage process. The stages in this process are product, in percentage, in years, growth, success.
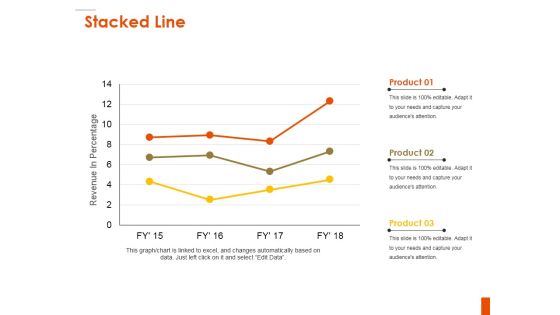
Stacked Line Ppt PowerPoint Presentation Outline Inspiration
This is a stacked line ppt powerpoint presentation outline inspiration. This is a three stage process. The stages in this process are revenue in percentage, product, growth, business, success.
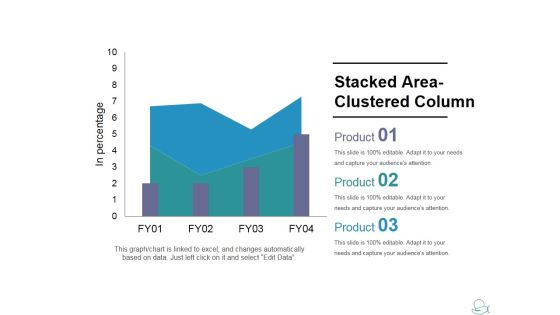
Stacked Area Clustered Column Ppt PowerPoint Presentation Slides Shapes
This is a stacked area clustered column ppt powerpoint presentation slides shapes. This is a three stage process. The stages in this process are product, growth, success graph, business.

Column Chart Ppt PowerPoint Presentation Layouts Background Images
This is a column chart ppt powerpoint presentation layouts background images. This is a two stage process. The stages in this process are product, in months, graph, growth, success.
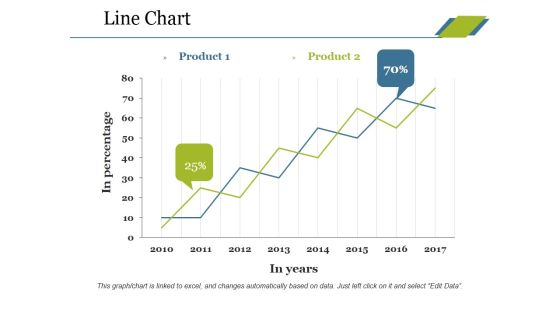
Line Chart Ppt PowerPoint Presentation Professional Tips
This is a line chart ppt powerpoint presentation professional tips. This is a two stage process. The stages in this process are product, in percentage, in years, growth, success.

Bubble Chart Ppt PowerPoint Presentation Inspiration Graphics Download
This is a bubble chart ppt powerpoint presentation inspiration graphics download. This is a three stage process. The stages in this process are product, growth, success, bubble chart, business.

Combo Chart Ppt PowerPoint Presentation Inspiration Slide Portrait
This is a combo chart ppt powerpoint presentation inspiration slide portrait. This is a three stage process. The stages in this process are product, market size, bar chart, growth, success.

Column Chart Ppt PowerPoint Presentation Portfolio Slide Download
This is a column chart ppt powerpoint presentation portfolio slide download. This is a two stage process. The stages in this process are product, year, bar graph, success, business.

Clustered Column Line Ppt PowerPoint Presentation Pictures Example
This is a clustered column line ppt powerpoint presentation pictures example. This is a three stage process. The stages in this process are product, in percentage, bar graph, growth, success.

Column Chart Ppt PowerPoint Presentation Styles Graphics Design
This is a column chart ppt powerpoint presentation styles graphics design. This is a two stage process. The stages in this process are expenditure in, product, years, growth, success.
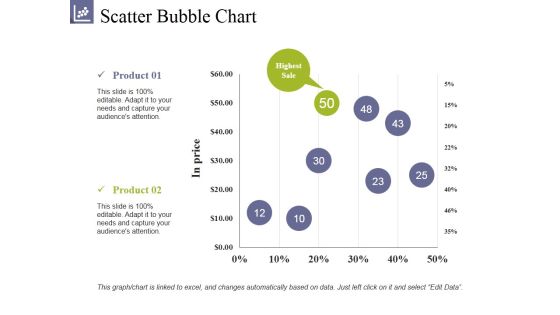
Scatter Bubble Chart Ppt PowerPoint Presentation Summary Clipart
This is a scatter bubble chart ppt powerpoint presentation summary clipart. This is a two stage process. The stages in this process are product, highest sale, in prices, growth, success.

Area Chart Ppt PowerPoint Presentation Infographic Template Model
This is a area chart ppt powerpoint presentation infographic template model. This is a two stage process. The stages in this process are product, area chart, growth, percentage, success.
Agricultural Business Company Profile Organization Chart Icons PDF
This slide highlights the organization chart of agricultural company which includes founder, CEO, EVP of retail products, fertilizer products, chief financial officer, chief legal officer, corporate development and strategy.This is a Agricultural Business Company Profile Organization Chart Icons PDF template with various stages. Focus and dispense information on four stages using this creative set, that comes with editable features. It contains large content boxes to add your information on topics like Development And Strategy, Fertilizer Products, Administrative You can also showcase facts, figures, and other relevant content using this PPT layout. Grab it now.
Farming Business Company Profile Organization Chart Icons PDF
This slide highlights the organization chart of agricultural company which includes founder, CEO, EVP of retail products, fertilizer products, chief financial officer, chief legal officer, corporate development and strategy.This is a Farming Business Company Profile Organization Chart Icons PDF template with various stages. Focus and dispense information on four stages using this creative set, that comes with editable features. It contains large content boxes to add your information on topics like Administrative Officer, Fertilizer Products, Development Strategy. You can also showcase facts, figures, and other relevant content using this PPT layout. Grab it now.

Action Plan To Improve Business Performance Ppt PowerPoint Presentation Infographics Professional PDF
Presenting this set of slides with name action plan to improve business performance ppt powerpoint presentation infographics professional pdf. This is a eight stage process. The stages in this process are generation new ideas, planning future forecasting, distribution work between team, investment idea and requirement of funds, launch product, make strategy implement, distribution resources, new fashion taste preference customer. This is a completely editable PowerPoint presentation and is available for immediate download. Download now and impress your audience.

KPI Metrics Dashboard To Measure Winning Sales Strategy Ideas PDF
The following slide highlights a comprehensive dashboard showcasing the winning sales strategy performance. The dashboard covers information about metrics such as sales by different products, region, channels, etc.Showcasing this set of slides titled KPI Metrics Dashboard To Measure Winning Sales Strategy Ideas PDF The topics addressed in these templates are Sales By Channel, Various Products, Inventory Outstanding All the content presented in this PPT design is completely editable. Download it and make adjustments in color, background, font etc. as per your unique business setting.
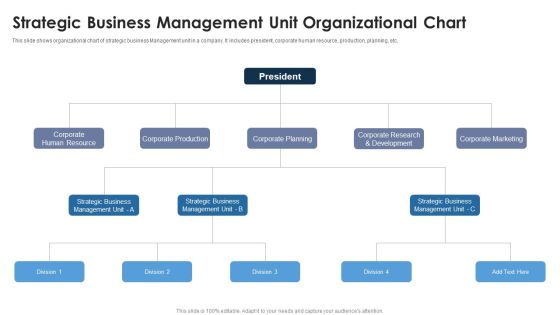
Strategic Business Management Unit Organizational Chart Ideas PDF
This slide shows organizational chart of strategic business Management unit in a company. It includes president, corporate human resource, production, planning, etc.Persuade your audience using this Strategic Business Management Unit Organizational Chart Ideas PDF This PPT design covers five stages, thus making it a great tool to use. It also caters to a variety of topics including Human Resource, Corporate Production, Corporate Planning Download this PPT design now to present a convincing pitch that not only emphasizes the topic but also showcases your presentation skills.

Company Wise Customer Targeting Tactics With Target Audience Ideas PDF
This slide shows various marketing instances of companies catering consumer targeting strategies. It includes information about, product, medium used to reach customers and probable benefit to company. Showcasing this set of slides titled Company Wise Customer Targeting Tactics With Target Audience Ideas PDF. The topics addressed in these templates are Target Audience, Product, Tactic, Probable Benefit Company. All the content presented in this PPT design is completely editable. Download it and make adjustments in color, background, font etc. as per your unique business setting.

Impact Of Change Control Process In Project Management Ideas PDF
This slide shows the impact of change control process in effective management of organizational projects. It includes three benefits of change control process such as increased productivity, effective communication and better teamwork and collaboration. Persuade your audience using this Impact Of Change Control Process In Project Management Ideas PDF. This PPT design covers three stages, thus making it a great tool to use. It also caters to a variety of topics including Increased Productivity, Effective Communication, Better Teamwork And Collaboration. Download this PPT design now to present a convincing pitch that not only emphasizes the topic but also showcases your presentation skills.
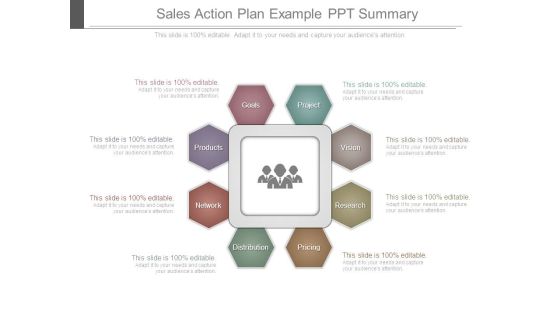
Sales Action Plan Example Ppt Summary
This is a sales action plan example ppt summary. This is a eight stage process. The stages in this process are goals, project, vision, research, pricing, distribution, products, network.

Communication Process Flowchart Employee Team Improvement Ppt PowerPoint Presentation Complete Deck
Presenting this set of slides with name communication process flowchart employee team improvement ppt powerpoint presentation complete deck. The topics discussed in these slides are employee, team, improvement, communication, production. This is a completely editable PowerPoint presentation and is available for immediate download. Download now and impress your audience.
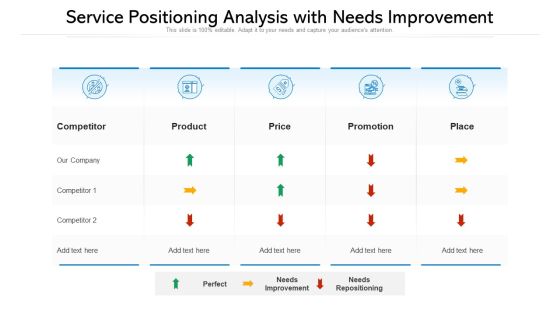
Service Positioning Analysis With Needs Improvement Ppt PowerPoint Presentation Professional Graphics Download PDF
Showcasing this set of slides titled service positioning analysis with needs improvement ppt powerpoint presentation professional graphics download pdf. The topics addressed in these templates are competitor, product, service positioning analysis with needs improvement. All the content presented in this PPT design is completely editable. Download it and make adjustments in color, background, font etc. as per your unique business setting.
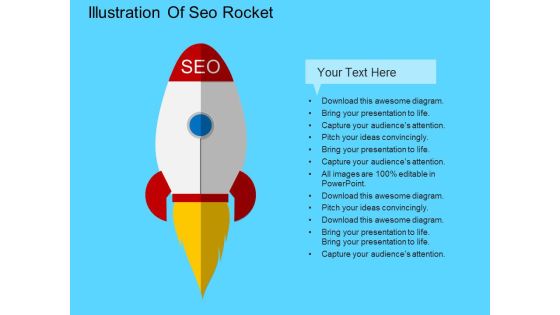
Illustration Of Seo Rocket Powerpoint Templates
This PowerPoint template has been designed with graphics of rocket with SEO text. This diagram may be used to display digital marketing of new product. Grab center stage with this slide and capture the attention of your audience.
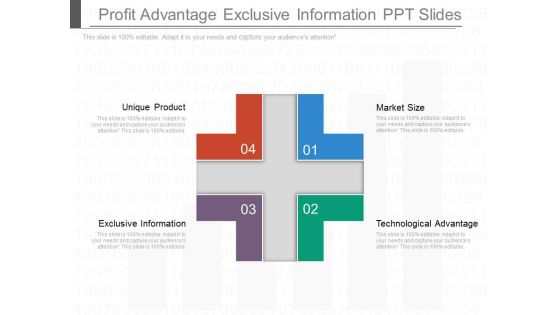
Profit Advantage Exclusive Information Ppt Slides
This is a profit advantage exclusive information ppt slides. This is a four stage process. The stages in this process are unique product, market size, exclusive information, technological advantage.

Advertising Regulation Our Team Powerpoint Slide Backgrounds
This is a advertising regulation our team powerpoint slide backgrounds. This is a four stage process. The stages in this process are advertising regulation, cost of production, market efficiencies, global marketing advertising.

Budget Available Presentation Background Images
This is a budget available presentation background images. This is a four stage process. The stages in this process are budget available, type of purchase decision, type of product, target market characteristics.

Abandoned Rates Powerpoint Templates Microsoft
This is a abandoned rates powerpoint templates microsoft. This is a six stage process. The stages in this process are contract per day, call quality, cost per contact productivity, abandoned rates, call duration, grade of service contract.


 Continue with Email

 Home
Home


