Product Analysis Dashboard

Data Science With Data Analytics Ppt Outline Design Templates PDF
Deliver and pitch your topic in the best possible manner with this data science with data analytics ppt outline design templates pdf. Use them to share invaluable insights on data science, data analytics and impress your audience. This template can be altered and modified as per your expectations. So, grab it now.

Toolkit For Data Science And Analytics Transition Data Analytics Software Vendor Profile Themes PDF
This slide shows the vendor profile matrix. It contains multiple features that can be scored and weighted to evaluate the vendors capability to deliver the software. Slidegeeks is here to make your presentations a breeze with Toolkit For Data Science And Analytics Transition Data Analytics Software Vendor Profile Themes PDF With our easy to use and customizable templates, you can focus on delivering your ideas rather than worrying about formatting. With a variety of designs to choose from, you are sure to find one that suits your needs. And with animations and unique photos, illustrations, and fonts, you can make your presentation pop. So whether you are giving a sales pitch or presenting to the board, make sure to check out Slidegeeks first.
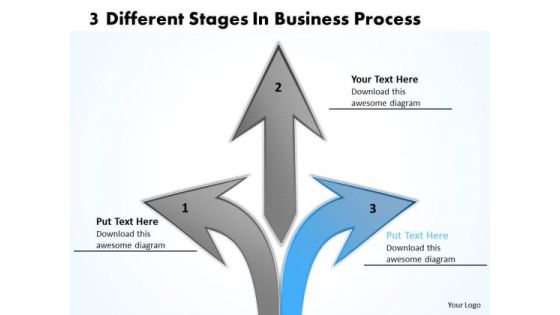
PowerPoint Presentations Process Relative Circular Arrow Network Templates
We present our powerpoint presentations process Relative Circular Arrow Network templates.Present our Marketing PowerPoint Templates because they enhance the essence of your viable ideas. Present our Business PowerPoint Templates because this template helps you to grab the attention of your listeners. Use our Arrows PowerPoint Templates because this layout helps you to impress upon the audience how your strategy will carry all to the top of the corporate heap. Present our Shapes PowerPoint Templates because it helps you to take your team up to a higher level with your thoughts. Download and present our Process and Flows PowerPoint Templates because it illustrates the symbols of human growth.Use these PowerPoint slides for presentations relating to Business, Chart, Circle, Colors, Concept, Corporate, Cycle, Data, Design, Detail, Development, Diagram, Engineering, Graphic, Ideas, Illustration, Image, Implement, Implementation, Life, Lifecycle, Management, Model, Objects, Organization, Phase, Plan, Process, Product, Professional, Project, Quality, Schema, Shape. The prominent colors used in the PowerPoint template are Blue, Gray, Black. Customers tell us our powerpoint presentations process Relative Circular Arrow Network templates are Quaint. Customers tell us our Corporate PowerPoint templates and PPT Slides look good visually. Presenters tell us our powerpoint presentations process Relative Circular Arrow Network templates are Multicolored. PowerPoint presentation experts tell us our Design PowerPoint templates and PPT Slides are Dynamic. Customers tell us our powerpoint presentations process Relative Circular Arrow Network templates are Multicolored. Professionals tell us our Data PowerPoint templates and PPT Slides are Attractive.
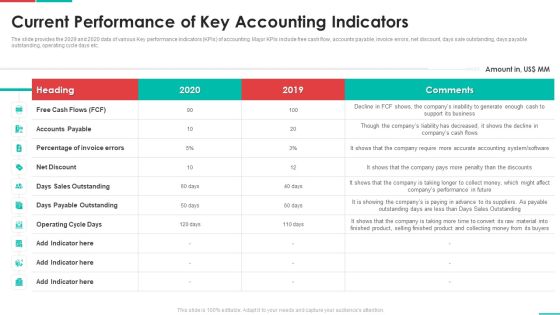
Roadmap For Financial Accounting Transformation Current Performance Of Key Accounting Indicators Elements PDF
The slide provides the 2029 and 2020 data of various Key performance indicators KPIs of accounting. Major KPIs include free cash flow, accounts payable, invoice errors, net discount, days sale outstanding, days payable outstanding, operating cycle days etc. Deliver an awe inspiring pitch with this creative roadmap for financial accounting transformation current performance of key accounting indicators elements pdf bundle. Topics like accounts payable, operating cycle days, days payable outstanding, net discount can be discussed with this completely editable template. It is available for immediate download depending on the needs and requirements of the user.

Finance And Accounting Online Conversion Plan Current Performance Of Key Accounting Indicators Template PDF
The slide provides the 2022 and 2020 data of various Key performance indicators KPIs of accounting. Major KPIs include free cash flow, accounts payable, invoice errors, net discount, days sale outstanding, days payable outstanding, operating cycle days etc. Deliver and pitch your topic in the best possible manner with this Finance And Accounting Online Conversion Plan Current Performance Of Key Accounting Indicators Template PDF. Use them to share invaluable insights on Sales Outstanding, Payable Outstanding, Accounts Payable and impress your audience. This template can be altered and modified as per your expectations. So, grab it now.
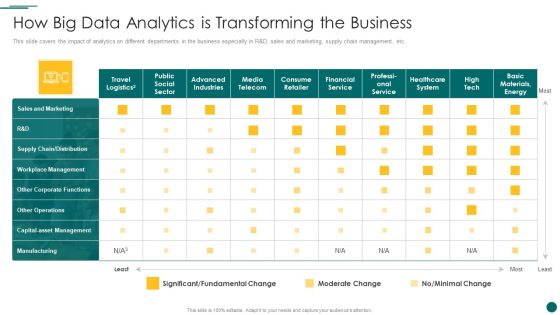
Organization Reinvention How Big Data Analytics Is Transforming The Business Rules PDF
Deliver and pitch your topic in the best possible manner with this Organization Reinvention How Big Data Analytics Is Transforming The Business Rules PDF. Use them to share invaluable insights on Sales And Marketing, Manufacturing, Consume Retailer and impress your audience. This template can be altered and modified as per your expectations. So, grab it now.

Business Intelligence And Big Data Analytics Change Management Data Analytics Process Infographics PDF
In this slide, we are tabulating the key processes and activities involved for data management process. It contains information on implementing the change management in data analytic framework. Deliver an awe inspiring pitch with this creative business intelligence and big data analytics change management data analytics process infographics pdf bundle. Topics like strategy, key plan, key activities, infrastructure can be discussed with this completely editable template. It is available for immediate download depending on the needs and requirements of the user.

Servers Deliver Data To Computers PowerPoint Templates Ppt Backgrounds For Slides 0813
Create your domain with our Servers Deliver Data To Computers Through Internet PowerPoint Templates PPT Backgrounds For Slides. Rule minds with your thoughts. Get the domestics right with our Technology PowerPoint Templates. Create the base for thoughts to grow. Do away with dogmatic approaches. Establish the value of reason with our Business PowerPoint Templates.

Content Marketing Planning Techniques With Major Kpis Background PDF
This slide shows content marketing outline with KPIs and strategies. It provides information about customer lifecycle, objectives, website visits, cost per lead, whitepaper, conversion rate, reach, act, etc. Showcasing this set of slides titled Content Marketing Planning Techniques With Major Kpis Background PDF. The topics addressed in these templates are Key Performance Indicators, Strategies To Achieve Goals, Smart Objectives. All the content presented in this PPT design is completely editable. Download it and make adjustments in color, background, font etc. as per your unique business setting.
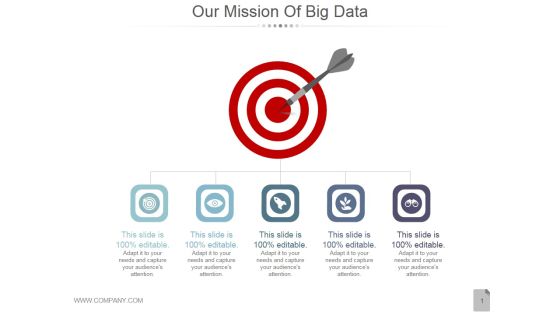
Our Mission Of Big Data Ppt PowerPoint Presentation Visuals
This is a our mission of big data ppt powerpoint presentation visuals. This is a five stage process. The stages in this process are targets, business, marketing, success, icons.
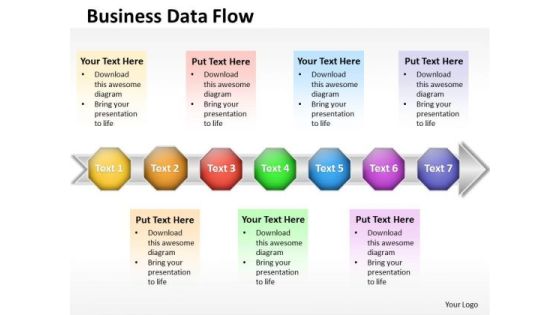
Ppt 7 Stages Self Concept PowerPoint Presentation Download Data Flow Diagram Templates
PPT 7 stages self concept powerpoint presentation download data flow diagram Templates-Use this 3D PowerPoint Diagram to describe seven stages of Linear Process through text boxes on Arrow. PowerPoint text boxes diagram templates are designed to help you place your text in a professional layout.-PPT 7 stages self concept powerpoint presentation download data flow diagram Templates-Achievement, Actualization, Basic, Belonging, Blue, Chart, Confidence, Diagram, Elements, Essential, Fundamental, Glossy, Goals, Gradient, Health, Hierarchical, Hierarchy, Human, Illustration, Isolated, Layer, Level, Love, Morality, Motivation, Needs, Person, Psychological, Psychology, Pyramid
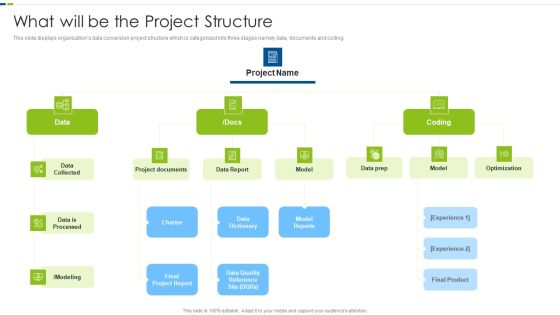
Utilizing Agile Methodology In Data Transformation Project IT What Will Be The Project Themes PDF
This slide displays organizations data conversion project structure which is categorized into three stages namely data, documents and coding. Deliver an awe inspiring pitch with this creative utilizing agile methodology in data transformation project it what will be the project themes pdf bundle. Topics like data quality, optimization, data report, project documents can be discussed with this completely editable template. It is available for immediate download depending on the needs and requirements of the user.
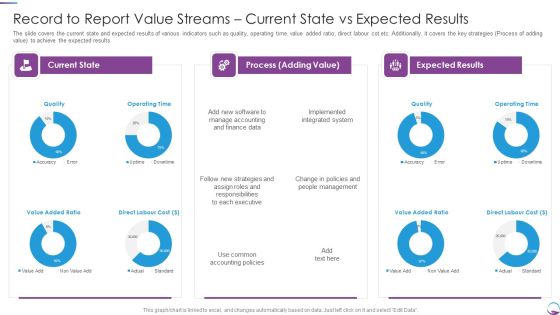
Record To Report Value Streams Current State Vs Expected Results Professional PDF
The slide covers the current state and expected results of various indicators such as quality, operating time, value added ratio, direct labour cot etc. Additionally, it covers the key strategies Process of adding value to achieve the expected results. Deliver and pitch your topic in the best possible manner with this Record To Report Value Streams Current State Vs Expected Results Professional PDF. Use them to share invaluable insights on Management, Strategies, Executive, Finance Data and impress your audience. This template can be altered and modified as per your expectations. So, grab it now.
Diagram Of Gears With Icons PowerPoint Templates
Our above PPT slide contains diagram of gears with icons. It helps to exhibit process planning and solutions. Use this diagram to impart more clarity to data and to create more sound impact on viewers.

Comprehensive Business Digitization Deck How Big Data Analytics Is Transforming The Business Slides PDF
This slide covers the impact of analytics on different departments in the business especially in RandD, sales and marketing, supply chain management, etc. Deliver an awe inspiring pitch with this creative comprehensive business digitization deck how big data analytics is transforming the business slides pdf bundle. Topics like sales and marketing, workplace management, manufacturing, capital asset management can be discussed with this completely editable template. It is available for immediate download depending on the needs and requirements of the user.

Back Propagation Program AI Machine Learning Output Data Ppt Model Graphics Example PDF
Presenting back propagation program ai machine learning output data ppt model graphics example pdf to provide visual cues and insights. Share and navigate important information on three stages that need your due attention. This template can be used to pitch topics like data output, machine learning, traditional programming learning, machine learning system. In addition, this PPT design contains high-resolution images, graphics, etc, that are easily editable and available for immediate download.

Classified Data Memo Record With Strategic Goals Company Overview With Business Information And Details Template PDF
This slide shows the brief outline of the company with details such as company name, company headquarters, industry type, business overview, business promoters etc. Presenting classified data memo record with strategic goals company overview with business information and details template pdf to provide visual cues and insights. Share and navigate important information on four stages that need your due attention. This template can be used to pitch topics like head quarters, industry, service, value proposition. In addtion, this PPT design contains high resolution images, graphics, etc, that are easily editable and available for immediate download.

Iot Digital Twin Technology Post Covid Expenditure Management Key Performance Indicators Background PDF
This slide focuses on the key performance indicators in oil and gas industry which includes loss of primary containment, oil spills, greenhouse gas emissions, etc. Deliver an awe inspiring pitch with this creative iot digital twin technology post covid expenditure management key performance indicators background pdf bundle. Topics like key performance indicators in oil and gas industry can be discussed with this completely editable template. It is available for immediate download depending on the needs and requirements of the user.

Toolkit For Data Science And Analytics Transition Key Essential Features Of Data Analytics Tools Elements PDF
The slide elaborates the key features of Data Analytics software which are required to improve business results. The features includes easy raw data processing, scalability, and technical support etc. Whether you have daily or monthly meetings, a brilliant presentation is necessary. Toolkit For Data Science And Analytics Transition Key Essential Features Of Data Analytics Tools Elements PDF can be your best option for delivering a presentation. Represent everything in detail using Toolkit For Data Science And Analytics Transition Key Essential Features Of Data Analytics Tools Elements PDF and make yourself stand out in meetings. The template is versatile and follows a structure that will cater to your requirements. All the templates prepared by Slidegeeks are easy to download and edit. Our research experts have taken care of the corporate themes as well. So, give it a try and see the results.

Data Driven Marketing Survey Insights Ppt Slides Icon PDF
This slide represents the results of the survey conducted to gain insights related to marketers view on data driven marketing. It includes survey insights such as 87 percent marketers believe that data is most underutilized asset of their enterprise etc. Are you searching for a Data Driven Marketing Survey Insights Ppt Slides Icon PDF that is uncluttered, straightforward, and original Its easy to edit, and you can change the colors to suit your personal or business branding. For a presentation that expresses how much effort you have put in, this template is ideal With all of its features, including tables, diagrams, statistics, and lists, its perfect for a business plan presentation. Make your ideas more appealing with these professional slides. Download Data Driven Marketing Survey Insights Ppt Slides Icon PDF from Slidegeeks today.

Data Driven Marketing Survey Insights Ppt Summary Objects PDF
This slide represents the results of the survey conducted to gain insights related to marketers view on data driven marketing. It includes survey insights such as 87 percent marketers believe that data is most underutilized asset of their enterprise etc. Are you searching for a Data Driven Marketing Survey Insights Ppt Summary Objects PDF that is uncluttered, straightforward, and original Its easy to edit, and you can change the colors to suit your personal or business branding. For a presentation that expresses how much effort you have put in, this template is ideal With all of its features, including tables, diagrams, statistics, and lists, its perfect for a business plan presentation. Make your ideas more appealing with these professional slides. Download Data Driven Marketing Survey Insights Ppt Summary Objects PDF from Slidegeeks today.

Data Evaluation And Processing Toolkit Project Mini Charter For Data Analytics Structure PDF
In this slide, we are providing vital information needed to get the project started. It includes information about project goals, deliverables, business case, participants and key milestones etc. Slidegeeks is here to make your presentations a breeze with Data Evaluation And Processing Toolkit Project Mini Charter For Data Analytics Structure PDF With our easy-to-use and customizable templates, you can focus on delivering your ideas rather than worrying about formatting. With a variety of designs to choose from, youre sure to find one that suits your needs. And with animations and unique photos, illustrations, and fonts, you can make your presentation pop. So whether youre giving a sales pitch or presenting to the board, make sure to check out Slidegeeks first.
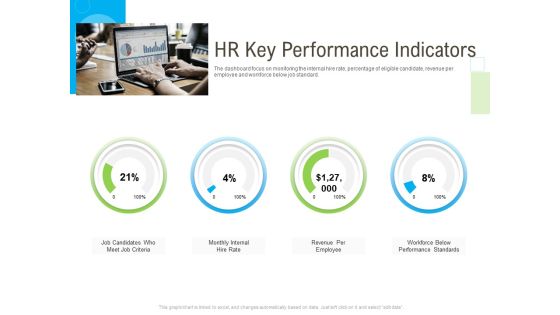
Rapid Innovation In HR Technology Space HR Key Performance Indicators Slides PDF
Deliver an awe inspiring pitch with this creative rapid innovation in hr technology space hr key performance indicators slides pdf bundle. Topics like criteria, workforce, performance, revenue, internal can be discussed with this completely editable template. It is available for immediate download depending on the needs and requirements of the user.
Business Diagram Three Staged Gear Diagram With Icons PowerPoint Template
Graphic of three staged gear and icons diagram has been used to craft this power point template diagram. This PPT contains the concept of data and text representation. Use this PPT diagram for your marketing and management related presentations.
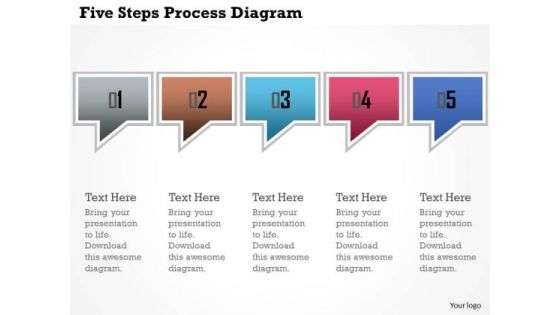
Business Diagram Five Steps Process Diagram Presentation Template
This power point template has been crafted with graphic of five dialogue boxes. This PPT contains the concept of text and data representation. Use this PPT for your business and marketing related presentations.
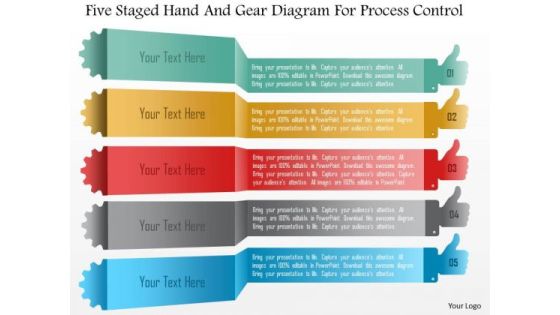
Business Diagram Five Staged Hand And Gear Diagram For Process Control PowerPoint Template
Five staged hand and gear diagram has been used to design this power point template. This PPT contains the concept of data representation and process control. Use this PPT slide for your marketing and business process related presentations.

Data Analytics Must Have Skills Before Implementing Data Analytics Ppt Ideas PDF
This slide depicts the three primary skill sets needed to become a Data Scientists, including mathematical expertise, knowledge of technology, and business acumen. Deliver an awe inspiring pitch with this creative data analytics must have skills before implementing data analytics ppt ideas pdf bundle. Topics like business, system, measurements, information can be discussed with this completely editable template. It is available for immediate download depending on the needs and requirements of the user.

Debt Retrieval Techniques Our Key Performance Indicators For Balance Sheet Ppt Pictures Gallery PDF
Purpose of the following side is to display the major KPI for the balance sheet as it highlight the key components such as current asset, current liabilities, total assets and total liability of the organization for the financial year 2020 2021 Deliver and pitch your topic in the best possible manner with this debt retrieval techniques our key performance indicators for balance sheet ppt pictures gallery pdf. Use them to share invaluable insights on current assets, current liabilities, total assets, total liabilities and impress your audience. This template can be altered and modified as per your expectations. So, grab it now.

Customer Demand Creation Marketing Metrics To Measure Performance Ppt Outline Graphic Images PDF
This slide contains the metrics of demand generation marketing to measure the results of efforts to increase overall revenue. It also includes key performance indicators, details, technology and reporting team. Showcasing this set of slides titled Customer Demand Creation Marketing Metrics To Measure Performance Ppt Outline Graphic Images PDF. The topics addressed in these templates are Engagement, Secondary Action, Primary Action. All the content presented in this PPT design is completely editable. Download it and make adjustments in color, background, font etc. as per your unique business setting.

Information Science Data Science With Data Analytics Ppt PowerPoint Presentation Infographics Show PDF
This slide represents the difference between data science and data analytics based on skillset, scope, exploration and goals and how both will work together.Deliver and pitch your topic in the best possible manner with this Information Science Data Science With Data Analytics Ppt PowerPoint Presentation Infographics Show PDF. Use them to share invaluable insights on Engine Exploration, Machine Learning, Often Unstructured and impress your audience. This template can be altered and modified as per your expectations. So, grab it now.

Toolkit For Data Science And Analytics Transition Vendor Scan Analytics Table For Data Software Portrait PDF
In this slide, we are evaluating each vendor based on the mentioned criteria. These criteria are weighted to get a total score per vendor for checking the vendors actual capability to deliver the analytical tool. Coming up with a presentation necessitates that the majority of the effort goes into the content and the message you intend to convey. The visuals of a PowerPoint presentation can only be effective if it supplements and supports the story that is being told. Keeping this in mind our experts created Toolkit For Data Science And Analytics Transition Vendor Scan Analytics Table For Data Software Portrait PDF to reduce the time that goes into designing the presentation. This way, you can concentrate on the message while our designers take care of providing you with the right template for the situation.

5 Stages Work Flow Diagram Business Plan Formats PowerPoint Slides
We present our 5 stages work flow diagram business plan formats PowerPoint Slides.Present our Marketing PowerPoint Templates because Our PowerPoint Templates and Slides are Clear and concise. Use them and dispel any doubts your team may have. Download and present our Competition PowerPoint Templates because You canTake a leap off the starting blocks with our PowerPoint Templates and Slides. They will put you ahead of the competition in quick time. Use our Process and Flows PowerPoint Templates because It can be used to Set your controls for the heart of the sun. Our PowerPoint Templates and Slides will be the propellant to get you there. Download our Circle Charts PowerPoint Templates because You have belief amd faith in your futuristic plans. Chalk them out for your team with our PowerPoint Templates and Slides. Download our Business PowerPoint Templates because Our PowerPoint Templates and Slides will provide you the cutting edge. Slice through the doubts in the minds of your listeners.Use these PowerPoint slides for presentations relating to Diagram, process, business, graphic, design, model, data, chart, project, corporate, plan, engineering, concept, vector, success, symbol, circle, guide, work flow, development, shape, team, management, steps, strategy, objects, pyramid, phase, professional, organization, detail, structure, product. The prominent colors used in the PowerPoint template are Green, Black, Gray.

5 Stages Work Flow Diagram Business PowerPoint Slides
We present our 5 stages work flow diagram business PowerPoint Slides.Download our Marketing PowerPoint Templates because Our PowerPoint Templates and Slides are like the strings of a tennis racquet. Well strung to help you serve aces. Use our Competition PowerPoint Templates because It will get your audience in sync. Present our Process and Flows PowerPoint Templates because Our PowerPoint Templates and Slides will let your team Walk through your plans. See their energy levels rise as you show them the way. Download and present our Circle Charts PowerPoint Templates because Our PowerPoint Templates and Slides will bullet point your ideas. See them fall into place one by one. Use our Business PowerPoint Templates because Our PowerPoint Templates and Slides will let you Illuminate the road ahead to Pinpoint the important landmarks along the way.Use these PowerPoint slides for presentations relating to Diagram, process, business, graphic, design, model, data, chart, project, corporate, plan, engineering, concept, vector, success, symbol, circle, guide, work flow, development, shape, team, management, steps, strategy, objects, pyramid, phase, professional, organization, detail, structure, product. The prominent colors used in the PowerPoint template are Green, Black, Gray.

3 Stages Stacked Shapes Chart Business Plan PowerPoint Slides
We present our 3 stages stacked shapes chart business plan PowerPoint Slides.Download our Business PowerPoint Templates because They will Put the wind in your sails. Skim smoothly over the choppy waters of the market. Use our Venn Diagrams PowerPoint Templates because Our PowerPoint Templates and Slides will give you great value for your money. Be assured of finding the best projection to highlight your words. Use our Layers PowerPoint Templates because Our PowerPoint Templates and Slides are effectively colour coded to prioritise your plans They automatically highlight the sequence of events you desire. Use our Circle Charts PowerPoint Templates because Our PowerPoint Templates and Slides will let Your superior ideas hit the target always and everytime. Download and present our Shapes PowerPoint Templates because Our PowerPoint Templates and Slides will let you Hit the right notes. Watch your audience start singing to your tune.Use these PowerPoint slides for presentations relating to diagram, process, business, graphic, design, ideas, model, data, chart, project, schema, corporate, implementation, tag, plan, engineering, concept, vector, success, symbol, stack, circle, guide, work flow, development, shape, team, management, cycle, steps, illustration, system, strategy, objects, phase, professional, organization, implement, background, image, detail, structure, product. The prominent colors used in the PowerPoint template are Blue light, Gray, White.
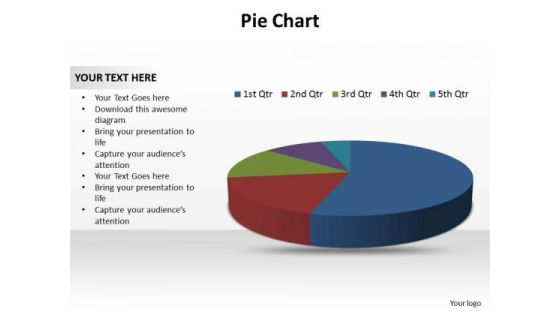
Buisness Leadership PowerPoint Templates Business Pie Chart Data Ppt Slides
Business Leadership PowerPoint Templates Business pie chart data PPT Slides-use this diagram to show your ideas all together to form the complete picture and reach the goal-Business Leadership PowerPoint Templates Business pie chart data PPT Slides-This ppt can be used for concepts relating to-Answer, Assemble, Assembly, Attention, Background, Brains, Build, Business, Challenge, Challenging, Clue, Complete, Complex, Concentration, Concept, Connect, Connection, Education, Entertainment, Finish

Toolkit For Data Science And Analytics Transition Key Failure Reasons For Data Analytics Project Structure PDF
This slide displays the key reasons for why the data analytics project fails. It includes reasons such as incorrect data, poor communication structure, and conflicting data etc. Find highly impressive Toolkit For Data Science And Analytics Transition Key Failure Reasons For Data Analytics Project Structure PDF on Slidegeeks to deliver a meaningful presentation. You can save an ample amount of time using these presentation templates. No need to worry to prepare everything from scratch because Slidegeeks experts have already done a huge research and work for you. You need to download Toolkit For Data Science And Analytics Transition Key Failure Reasons For Data Analytics Project Structure PDF for your upcoming presentation. All the presentation templates are 100 percent editable and you can change the color and personalize the content accordingly. Download now.

Toolkit For Data Science And Analytics Transition Key Phases Of Data Analytics Project Structure PDF
The slide explains the key phases of data analytics management. It includes multiple functions like data integration, data governance and repository management to accomplish data analytical results. Crafting an eye catching presentation has never been more straightforward. Let your presentation shine with this tasteful yet straightforward Toolkit For Data Science And Analytics Transition Key Phases Of Data Analytics Project Structure PDF template. It offers a minimalistic and classy look that is great for making a statement. The colors have been employed intelligently to add a bit of playfulness while still remaining professional. Construct the ideal Toolkit For Data Science And Analytics Transition Key Phases Of Data Analytics Project Structure PDF that effortlessly grabs the attention of your audience Begin now and be certain to wow your customers.
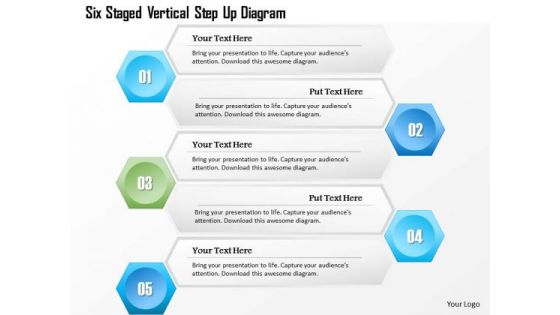
Business Diagram Six Staged Vertical Step Up Diagram Presentation Template
This business diagram has been designed with six staged vertical steps diagram. This slide suitable for data representation. You can also use this slide to present six steps of any business process. Use this diagram to present your views in a wonderful manner.
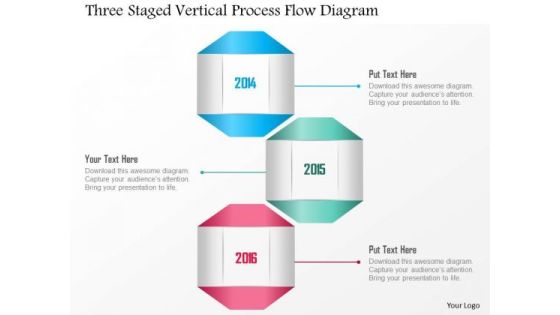
Business Diagram Three Staged Vertical Process Flow Diagram Presentation Template
This business diagram has been designed with three staged vertical process flow design. This slide suitable for data representation. You can also use this slide to present three steps of any business process. Use this diagram to present your views in a wonderful manner.

Big Latest Facts About Data Market In IT Industry Pictures PDF
This slide covers big data market trends and analytics in IT industries. It involves percentage of growth over years, third party platforms and challenges to deliver successful business analytics solutions. Showcasing this set of slides titled Big Latest Facts About Data Market In IT Industry Pictures PDF. The topics addressed in these templates are Unskilled Workforce, Data Integration, Data Quality Management. All the content presented in this PPT design is completely editable. Download it and make adjustments in color, background, font etc. as per your unique business setting.
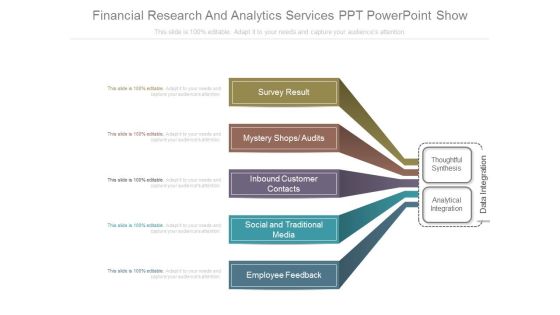
Financial Research And Analytics Services Ppt Powerpoint Show
This is a financial research and analytics services ppt powerpoint show. This is a five stage process. The stages in this process are survey result, mystery shops audits, inbound customer contacts, social and traditional media, employee feedback, thoughtful synthesis, analytical integration, data integration.
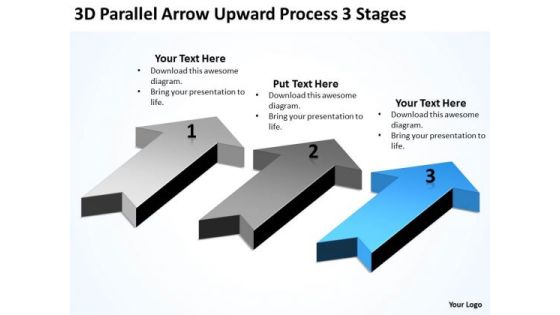
Parallel Data Processing 3 Stages Ppt PowerPoint Templates Backgrounds For Slides
We present our parallel data processing 3 stages ppt PowerPoint templates backgrounds for slides.Download and present our Flow Charts PowerPoint Templates because Our PowerPoint Templates and Slides will effectively help you save your valuable time. They are readymade to fit into any presentation structure. Download and present our Business PowerPoint Templates because Our PowerPoint Templates and Slides are truly out of this world. Even the MIB duo has been keeping tabs on our team. Download and present our Arrows PowerPoint Templates because Watching this your Audience will Grab their eyeballs, they wont even blink. Present our Process and Flows PowerPoint Templates because Our PowerPoint Templates and Slides will Embellish your thoughts. They will help you illustrate the brilliance of your ideas. Present our Success PowerPoint Templates because Our PowerPoint Templates and Slides help you pinpoint your timelines. Highlight the reasons for your deadlines with their use.Use these PowerPoint slides for presentations relating to Abstract, advertising, arrow, artwork,backdrop, background, banner,brochure, business, button, card,concept, corporate, creative, design, flyer,form, histogram, illustration, infographic,information, label, layout, leaflet, menu,navigation, number, options, order,origami, paper, pattern, product,promotion, ribbon, sequence, site,special, stationery, step, symbol, tab. The prominent colors used in the PowerPoint template are Blue, Gray, Black. Presenters tell us our parallel data processing 3 stages ppt PowerPoint templates backgrounds for slides are readymade to fit into any presentation structure. Presenters tell us our business PowerPoint templates and PPT Slides will generate and maintain the level of interest you desire. They will create the impression you want to imprint on your audience. Customers tell us our parallel data processing 3 stages ppt PowerPoint templates backgrounds for slides will save the presenter time. Use our banner PowerPoint templates and PPT Slides are effectively colour coded to prioritise your plans They automatically highlight the sequence of events you desire. Customers tell us our parallel data processing 3 stages ppt PowerPoint templates backgrounds for slides will make you look like a winner. Presenters tell us our arrow PowerPoint templates and PPT Slides will help you be quick off the draw. Just enter your specific text and see your points hit home.
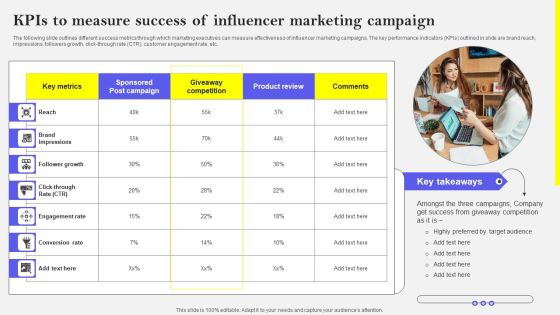
Kpis To Measure Success Of Influencer Marketing Campaign Formats PDF
The following slide outlines different success metrics through which marketing executives can measure effectiveness of influencer marketing campaigns. The key performance indicators KPIs outlined in slide are brand reach, impressions, followers growth, click-through rate CTR, customer engagement rate, etc. The best PPT templates are a great way to save time, energy, and resources. Slidegeeks have 100 percent editable powerpoint slides making them incredibly versatile. With these quality presentation templates, you can create a captivating and memorable presentation by combining visually appealing slides and effectively communicating your message. Download Kpis To Measure Success Of Influencer Marketing Campaign Formats PDF from Slidegeeks and deliver a wonderful presentation.

Ppt Slide Segmented Pie Chart Data Driven Business Diagrams
Dribble Away With Our PPT Slide segmented pie chart data driven business diagrams Powerpoint Templates. Score A Goal With Your Ideas. Drill It In With Our Business Plan Powerpoint Templates. Embed Your Message Into The Minds Of Your Audience.

Data Evaluation And Processing Toolkit Business Data Analytics Requirement Table Pictures PDF
In this slide, we are tabulating the key requirements required for data analytics project in various fields of business. It includes timeframe and kpis to measure the project results. Want to ace your presentation in front of a live audience Our Data Evaluation And Processing Toolkit Business Data Analytics Requirement Table Pictures PDF can help you do that by engaging all the users towards you. Slidegeeks experts have put their efforts and expertise into creating these impeccable powerpoint presentations so that you can communicate your ideas clearly. Moreover, all the templates are customizable, and easy-to-edit and downloadable. Use these for both personal and commercial use.

Classified Data Memo Record With Strategic Goals Table Of Contents Business Formats PDF
Presenting classified data memo record with strategic goals table of contents business formats pdf to provide visual cues and insights. Share and navigate important information on fourteen stages that need your due attention. This template can be used to pitch topics like expansion plans, value proposition, performance, geographical, target market demographics. In addtion, this PPT design contains high resolution images, graphics, etc, that are easily editable and available for immediate download.

Ppt Slide Representation Of Yearly Data Marketing Plan
Our PPT Slide representation of yearly data marketing plan Powerpoint Templates Team Are A Dogged Lot. They Keep At It Till They Get It Right.
Comprehensive Guide For Launch Survey Results To Identify Most Effective Marketing Tool Icons PDF
This graph or chart is linked to excel, and changes automatically based on data. Just left click on it and select Edit Data. Slidegeeks is here to make your presentations a breeze with Comprehensive Guide For Launch Survey Results To Identify Most Effective Marketing Tool Icons PDF With our easy-to-use and customizable templates, you can focus on delivering your ideas rather than worrying about formatting. With a variety of designs to choose from, youre sure to find one that suits your needs. And with animations and unique photos, illustrations, and fonts, you can make your presentation pop. So whether youre giving a sales pitch or presenting to the board, make sure to check out Slidegeeks first.
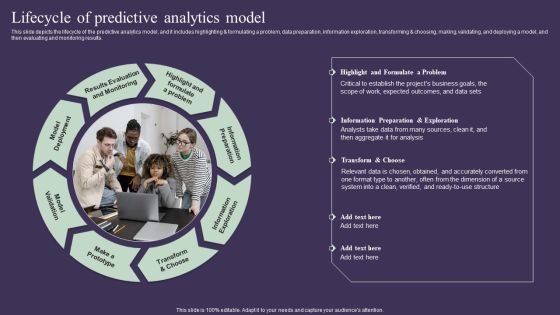
Projection Model Lifecycle Of Predictive Analytics Model Demonstration PDF
This slide depicts the lifecycle of the predictive analytics model, and it includes highlighting and formulating a problem, data preparation, information exploration, transforming and choosing, making, validating, and deploying a model, and then evaluating and monitoring results. Coming up with a presentation necessitates that the majority of the effort goes into the content and the message you intend to convey. The visuals of a PowerPoint presentation can only be effective if it supplements and supports the story that is being told. Keeping this in mind our experts created Projection Model Lifecycle Of Predictive Analytics Model Demonstration PDF to reduce the time that goes into designing the presentation. This way, you can concentrate on the message while our designers take care of providing you with the right template for the situation.

Data Driven Marketing Trends Significant To Marketers Ppt Slides Clipart Images PDF
This slide represents the latest and emerging trends to help marketers in gaining insights related to future of data driven marketing in order to avoid potential dangers and take benefit of potential opportunities. It includes details related to trends such as deliver personalized experience etc. Retrieve professionally designed Data Driven Marketing Trends Significant To Marketers Ppt Slides Clipart Images PDF to effectively convey your message and captivate your listeners. Save time by selecting pre made slideshows that are appropriate for various topics, from business to educational purposes. These themes come in many different styles, from creative to corporate, and all of them are easily adjustable and can be edited quickly. Access them as PowerPoint templates or as Google Slides themes. You do not have to go on a hunt for the perfect presentation because Slidegeeks got you covered from everywhere.

Data Driven Marketing Trends Significant To Marketers Ppt Infographic Template Example File
This slide represents the latest and emerging trends to help marketers in gaining insights related to future of data driven marketing in order to avoid potential dangers and take benefit of potential opportunities. It includes details related to trends such as deliver personalized experience etc. Retrieve professionally designed Data Driven Marketing Trends Significant To Marketers Ppt Infographic Template Example File to effectively convey your message and captivate your listeners. Save time by selecting pre made slideshows that are appropriate for various topics, from business to educational purposes. These themes come in many different styles, from creative to corporate, and all of them are easily adjustable and can be edited quickly. Access them as PowerPoint templates or as Google Slides themes. You do not have to go on a hunt for the perfect presentation because Slidegeeks got you covered from everywhere.

Data Steward Vs Data Analyst Background PDF
This slide represents the difference between data stewards and data analysts, including the functions they perform and the annual package. Both of them handle information but still possess different roles and responsibilities. Whether you have daily or monthly meetings, a brilliant presentation is necessary. Data Steward Vs Data Analyst Background PDF can be your best option for delivering a presentation. Represent everything in detail using Data Steward Vs Data Analyst Background PDF and make yourself stand out in meetings. The template is versatile and follows a structure that will cater to your requirements. All the templates prepared by Slidegeeks are easy to download and edit. Our research experts have taken care of the corporate themes as well. So, give it a try and see the results.

Targeted Marketing Strategic Plan For Audience Engagement Kpis To Measure Personalized Marketing Results Ideas PDF
If your project calls for a presentation, then Slidegeeks is your go to partner because we have professionally designed, easy-to-edit templates that are perfect for any presentation. After downloading, you can easily edit Targeted Marketing Strategic Plan For Audience Engagement Kpis To Measure Personalized Marketing Results Ideas PDF and make the changes accordingly. You can rearrange slides or fill them with different images. Check out all the handy templates.

BPO Performance Improvement Action Plan Evaluate Performance By Monitoring Call Center Kpis Slides PDF
This slide highlights call center key performance indicators which can be used to evaluate organization and employee performance which includes service level, response time, abandonment rate, quality monitoring scores, customer satisfaction and first call resolution. From laying roadmaps to briefing everything in detail, our templates are perfect for you. You can set the stage with your presentation slides. All you have to do is download these easy to edit and customizable templates. BPO Performance Improvement Action Plan Evaluate Performance By Monitoring Call Center Kpis Slides PDF will help you deliver an outstanding performance that everyone would remember and praise you for. Do download this presentation today.

Nestle Performance Management Report Our Target Ppt Infographics Example Topics PDF
If you are looking for a format to display your unique thoughts, then the professionally designed Nestle Performance Management Report Our Target Ppt Infographics Example Topics PDF is the one for you. You can use it as a Google Slides template or a PowerPoint template. Incorporate impressive visuals, symbols, images, and other charts. Modify or reorganize the text boxes as you desire. Experiment with shade schemes and font pairings. Alter, share or cooperate with other people on your work. Download Nestle Performance Management Report Our Target Ppt Infographics Example Topics PDF and find out how to give a successful presentation. Present a perfect display to your team and make your presentation unforgettable.
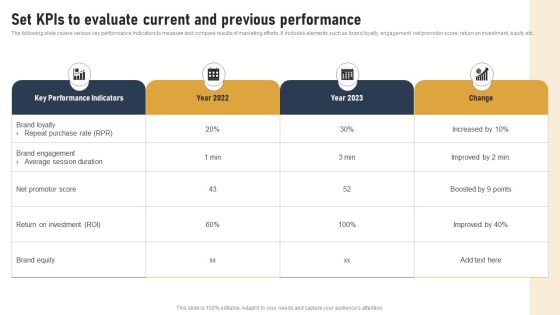
Incorporating Real Time Marketing For Improved Consumer Set Kpis To Evaluate Current And Previous Introduction PDF
The following slide covers various key performance indicators to measure and compare results of marketing efforts. It includes elements such as brand loyalty, engagement, net promotor score, return on investment, equity etc. The Incorporating Real Time Marketing For Improved Consumer Set Kpis To Evaluate Current And Previous Introduction PDF is a compilation of the most recent design trends as a series of slides. It is suitable for any subject or industry presentation, containing attractive visuals and photo spots for businesses to clearly express their messages. This template contains a variety of slides for the user to input data, such as structures to contrast two elements, bullet points, and slides for written information. Slidegeeks is prepared to create an impression.

Telemarketing Report Template 1 Ppt PowerPoint Presentation Show Structure
This is a telemarketing report template 1 ppt powerpoint presentation show structure. This is a four stage process. The stages in this process are inbound calls connected, appointment requested, appointment results, key data, daily connected calls.

Customer Behavioral Data And Analytics Personalize The Customer Experience Guidelines PDF
Customers are increasingly demanding personalization. Marketing team should personalize the experience at each stage of the journey to increase sales and retention. Deliver an awe inspiring pitch with this creative customer behavioral data and analytics personalize the customer experience guidelines pdf bundle. Topics like very satisfied, satisfied, neutral, dissatisfied, very dissatisfied can be discussed with this completely editable template. It is available for immediate download depending on the needs and requirements of the user.

Key Goals Of Performance Appraisal For Employees Ppt PowerPoint Presentation Infographic Template Background PDF
This slide shows the objectives of performance appraisal which ensure better teamwork, improves performance and profitability and increases job satisfaction. It includes setting objectives, acknowledge performance , periodic feedbacks, amplify talent, determine weak links. Persuade your audience using this Key Goals Of Performance Appraisal For Employees Ppt PowerPoint Presentation Infographic Template Background PDF. This PPT design covers five stages, thus making it a great tool to use. It also caters to a variety of topics including Periodic Feedbacks, Set Objectives, Acknowledge Performance. Download this PPT design now to present a convincing pitch that not only emphasizes the topic but also showcases your presentation skills.
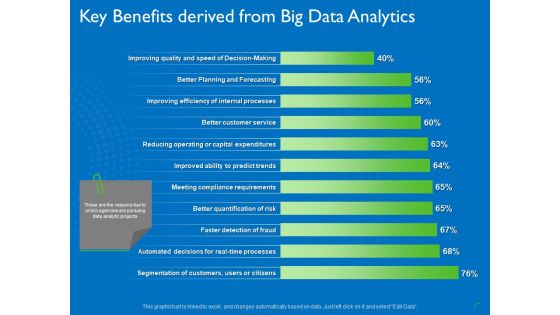
Transforming Big Data Analytics To Knowledge Key Benefits Derived From Big Data Analytics Introduction PDF
Deliver an awe inspiring pitch with this creative transforming big data analytics to knowledge key benefits derived from big data analytics introduction pdf bundle. Topics like service, processes, efficiency, planning, decision making can be discussed with this completely editable template. It is available for immediate download depending on the needs and requirements of the user.
 Home
Home