AI PPT Maker
Templates
PPT Bundles
Design Services
Business PPTs
Business Plan
Management
Strategy
Introduction PPT
Roadmap
Self Introduction
Timelines
Process
Marketing
Agenda
Technology
Medical
Startup Business Plan
Cyber Security
Dashboards
SWOT
Proposals
Education
Pitch Deck
Digital Marketing
KPIs
Project Management
Product Management
Artificial Intelligence
Target Market
Communication
Supply Chain
Google Slides
Research Services
 One Pagers
All Categories
-
Home
- Customer Favorites
- Procurement Process
Procurement Process
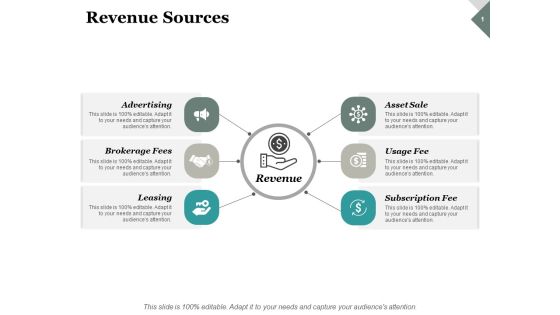
Revenue Sources Ppt PowerPoint Presentation Pictures Sample
This is a revenue sources ppt powerpoint presentation pictures sample. This is a six stage process. The stages in this process are advertising, leasing, asset sale, brokerage fees, subscription fees.

Key Performance Indicators Ppt PowerPoint Presentation Pictures Design Templates
This is a key performance indicators ppt powerpoint presentation pictures design templates. This is a five stage process. The stages in this process are day sales outstanding, cost of goods sold, customer retention rate.
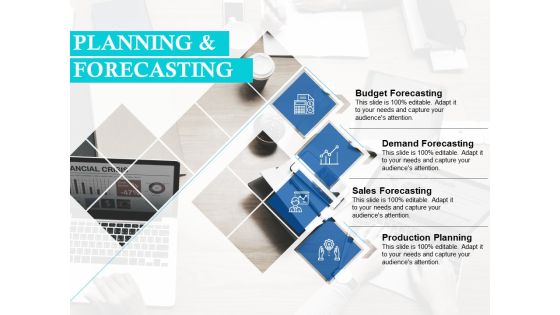
Planning And Forecasting Ppt Powerpoint Presentation Styles Graphic Images
This is a planning and forecasting ppt powerpoint presentation styles graphic images. This is a four stage process. The stages in this process are budget forecasting, demand forecasting, sales forecasting, production planning.

Ratio Analysis Growth Ratios Ppt Powerpoint Presentation Gallery Graphics Download
This is a ratio analysis growth ratios ppt powerpoint presentation gallery graphics download. This is a two stage process. The stages in this process are ratio analysis, sales growth, growth ratios, asset growth, profitability ratios.
Return On Investment Icons Ppt Powerpoint Presentation Gallery Brochure
This is a return on investment icons ppt powerpoint presentation gallery brochure. This is a two stage process. The stages in this process are risks, sales, capital, return, finance.

Venn Business Marketing Planning Ppt PowerPoint Presentation Show Tips
This is a venn business marketing planning ppt powerpoint presentation show tips. This is a four stage process. The stages in this process are venn, marketing, sales, strategy, business.

Key Assignments Task Table Ppt PowerPoint Presentation Inspiration Tips
This is a key assignments task table ppt powerpoint presentation inspiration tips. This is a six stage process. The stages in this process are key assignments, product marketing, channel sales, marketing, planning.

Our Team Ppt PowerPoint Presentation Deck
This is a our team ppt powerpoint presentation deck. This is a four stage process. The stages in this process are director of sales, ceo and founder, production manager, finance manager .

The Core Team Ppt PowerPoint Presentation Visual Aids
This is a the core team ppt powerpoint presentation visual aids. This is a four stage process. The stages in this process are ceo, director of sales, director, managing director.
Financial Projection Graph Template 1 Ppt PowerPoint Presentation Icon Summary
This is a financial projection graph template 1 ppt powerpoint presentation icon summary. This is a three stage process. The stages in this process are annual sales forecast, years, business, marketing, management.

Area Chart Ppt PowerPoint Presentation Slides Deck
This is a area chart ppt powerpoint presentation slides deck. This is a two stage process. The stages in this process are financial, sales in percentage, business, marketing, management.
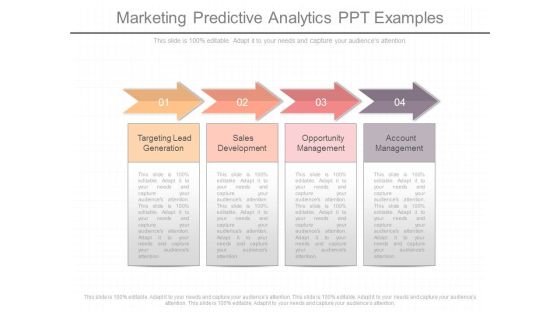
Marketing Predictive Analytics Ppt Examples
This is a marketing predictive analytics ppt examples. This is a four stage process. The stages in this process are targeting lead generation, sales development, opportunity management, account management.

Sustainable Value Chains Powerpoint Slide Images
This is a sustainable value chains powerpoint slide images. This is a five stage process. The stages in this process are green sales and marketing, sustainable value chains, sustainable operations, operational risk management, reputation management.

Small Business Structure Chart Example Powerpoint Slide Background Image
This is a small business structure chart example powerpoint slide background image. This is a six stage process. The stages in this process are financial manager, sales, distributions, finance, operations, general manager.

Hierarchy Ppt PowerPoint Presentation Sample
This is a hierarchy ppt powerpoint presentation sample. This is a four stage process. The stages in this process are hr manager, graphic designer, sales manager, web designer, ceo.

Meet Our Team Ppt PowerPoint Presentation Backgrounds
This is a meet our team ppt powerpoint presentation backgrounds. This is a four stage process. The stages in this process are ceo and founder, finance manager, product manager, sales marketing.

Our Team Ppt PowerPoint Presentation Slides Gridlines
This is a our team ppt powerpoint presentation slides gridlines. This is a four stage process. The stages in this process are ceo and founder, finance manager, director of sales, production manager.

About Us Ppt PowerPoint Presentation Ideas Summary
This is a about us ppt powerpoint presentation ideas summary. This is a four stage process. The stages in this process are production manager, director of sales, ceo and founder, finance manager.

Our Team Ppt PowerPoint Presentation Slides Graphics Template
This is a our team ppt powerpoint presentation slides graphics template. This is a four stage process. The stages in this process are ceo, product manager, director of sales, finance manager.

Our Team Template 1 Ppt PowerPoint Presentation Show Graphics
This is a our team template 1 ppt powerpoint presentation show graphics. This is a three stage process. The stages in this process are director of sales, product manager, finance manager, designer, graphic designer.

Company Employees Portfolio Ppt PowerPoint Presentation Deck
This is a company employees portfolio ppt powerpoint presentation deck. This is a five stage process. The stages in this process are product development, sales marketing, expand operations, product development.

Last 90 Days Results Ppt PowerPoint Presentation Introduction
This is a last 90 days results ppt powerpoint presentation introduction. This is a six stage process. The stages in this process are revenue, new customers, gross profit, sales comparison.
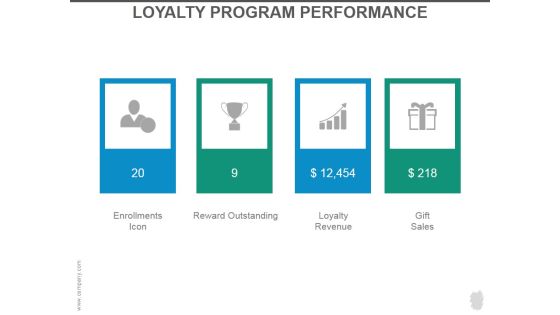
Loyalty Program Performance Ppt PowerPoint Presentation Slides
This is a loyalty program performance ppt powerpoint presentation slides. This is a four stage process. The stages in this process are enrollments icon, reward outstanding, loyalty revenue, gift sales.

Loyalty Program Performance Ppt PowerPoint Presentation Introduction
This is a loyalty program performance ppt powerpoint presentation introduction. This is a four stage process. The stages in this process are enrollments icon, reward outstanding, loyalty revenue, gift sales.

Competitive Analysis Template 8 Matrix Chart Ppt PowerPoint Presentation Designs Download
This is a competitive analysis template 8 matrix chart ppt powerpoint presentation designs download. This is a six stage process. The stages in this process are product quality, product fidelity, after sales service, customer service, price, shipping speed.
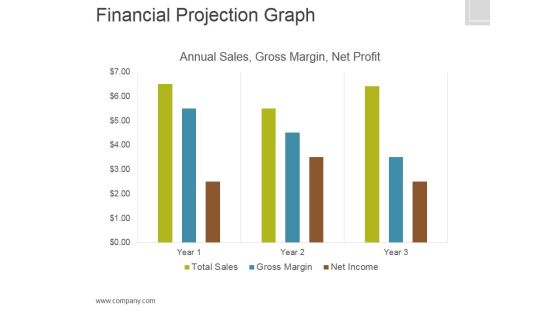
Financial Projection Graph Template 2 Ppt PowerPoint Presentation Graphics
This is a financial projection graph template 2 ppt powerpoint presentation graphics. This is a three stage process. The stages in this process are annual sales, gross margin, net profit, finance.
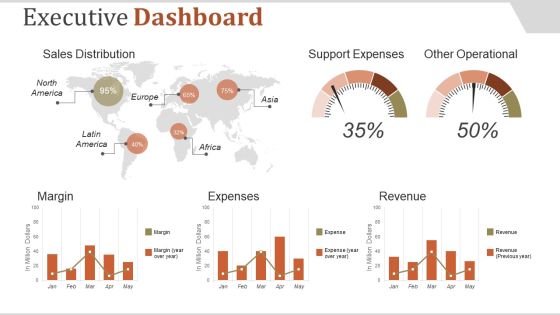
Executive Dashboard Ppt PowerPoint Presentation Introduction
This is a executive dashboard ppt powerpoint presentation introduction. This is a five stage process. The stages in this process are sales distribution, support expenses, other operational, margin, expenses.

Combo Chart Ppt PowerPoint Presentation Shapes
This is a combo chart ppt powerpoint presentation shapes. This is a eight stage process. The stages in this process are combo chart, business, marketing, sales in percentage, bar graph.
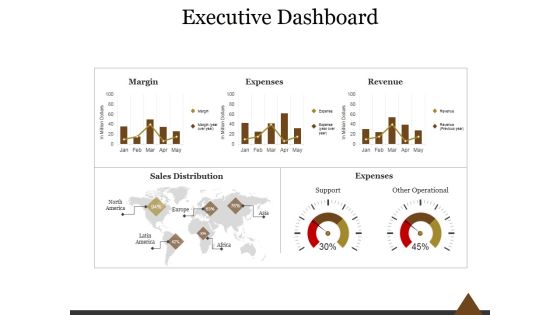
Executive Dashboard Ppt PowerPoint Presentation Professional
This is a executive dashboard ppt powerpoint presentation professional. This is a five stage process. The stages in this process are margin, expenses, revenue, sales distribution, expenses, support, other operational.
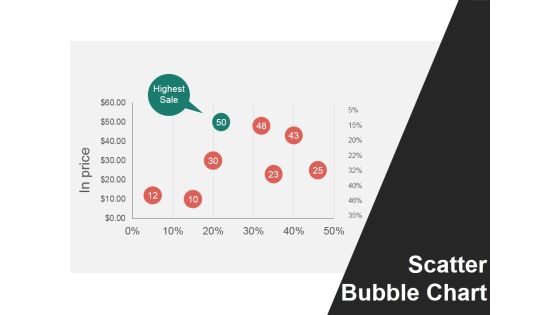
Scatter Bubble Chart Ppt PowerPoint Presentation Show Infographic Template
This is a scatter bubble chart ppt powerpoint presentation show infographic template. This is a six stage process. The stages in this process are in price, scatter bubble chart, highest sale.

Market Trends Ppt PowerPoint Presentation Model Background Images
This is a market trends ppt powerpoint presentation model background images. This is a two stage process. The stages in this process are our analysis, montana, texas, sales in texas.

Bar Chart Ppt PowerPoint Presentation Infographic Template Skills
This is a bar chart ppt powerpoint presentation infographic template skills. This is a nine stage process. The stages in this process are sales in percentage, finance, business, marketing, strategy, success.
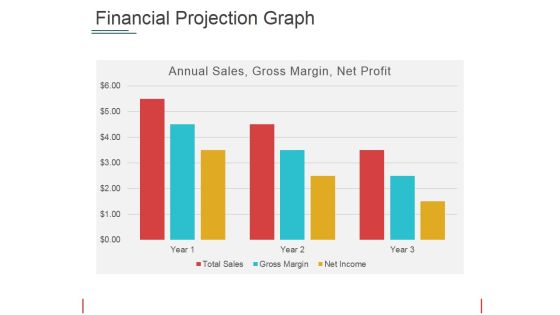
Financial Projection Graph Template 2 Ppt PowerPoint Presentation Show Picture
This is a financial projection graph template 2 ppt powerpoint presentation show picture. This is a three stage process. The stages in this process are annual sales, gross margin, net profit, years.

Bar Chart Ppt PowerPoint Presentation Icon Design Templates
This is a bar chart ppt powerpoint presentation icon design templates. This is a nine stage process. The stages in this process are sales in percentage, bar graph, business, marketing, growth.

Line Chart Ppt PowerPoint Presentation Ideas Example
This is a line chart ppt powerpoint presentation ideas example. This is a two stage process. The stages in this process are sales in percentage, bar graph, business, marketing, growth.

Development In Past 10 Years Template 2 Ppt PowerPoint Presentation Professional Topics
This is a development in past 10 years template 2 ppt powerpoint presentation professional topics. This is a ten stage process. The stages in this process are net sales, other income, ebita, ebita margins, profit before tax, taxes.
Founders Of The Company Ppt PowerPoint Presentation Icon Infographic Template
This is a founders of the company ppt powerpoint presentation icon infographic template. This is a five stage process. The stages in this process are ceo, web designer, sales and marketing, editor, graphic designer.

Bar Chart Ppt PowerPoint Presentation Ideas Graphic Tips
This is a bar chart ppt powerpoint presentation ideas graphic tips. This is a seven stage process. The stages in this process are sales in percentage, bar chart, growth, business, marketing.

Clustered Column Ppt PowerPoint Presentation Icon Design Inspiration
This is a clustered column ppt powerpoint presentation icon design inspiration. This is a two stage process. The stages in this process are product, financial year, sales in percentage, clustered column.
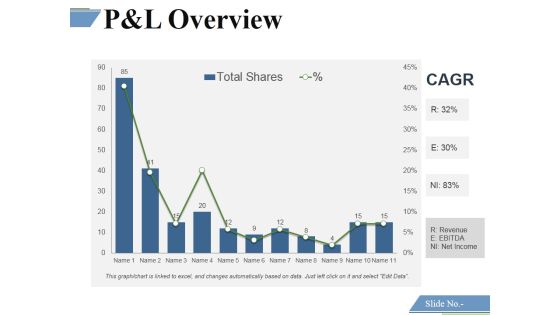
P And L Overview Template 3 Ppt PowerPoint Presentation Model Gridlines
This is a p and l overview template 3 ppt powerpoint presentation model gridlines. This is a eleven stage process. The stages in this process are financing cost, net sales, profit before tax, profit after tax.
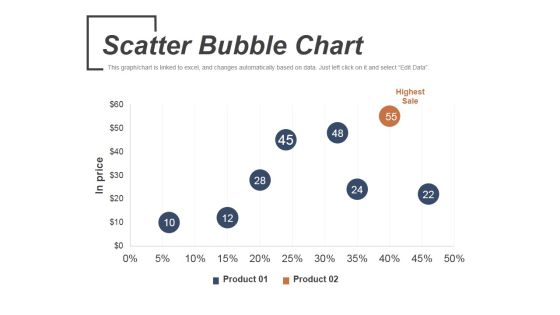
Scatter Bubble Chart Ppt PowerPoint Presentation Infographic Template Graphics
This is a scatter bubble chart ppt powerpoint presentation infographic template graphics. This is a two stage process. The stages in this process are highest sale, product, in price.
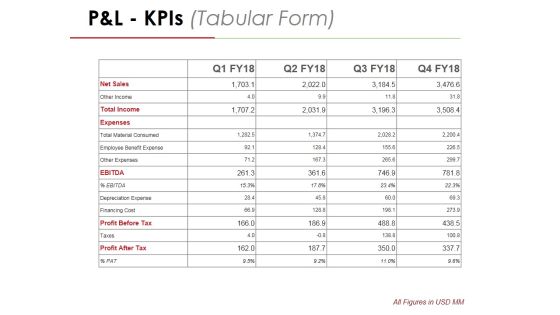
P And L Kpis Template 2 Ppt PowerPoint Presentation Professional Graphics
This is a p and l kpis template 2 ppt powerpoint presentation professional graphics. This is a four stage process. The stages in this process are net sales, other income, total income, expenses, total material consumed.

Profitability Ratios Template 1 Ppt PowerPoint Presentation Inspiration Graphics Pictures
This is a profitability ratios template 1 ppt powerpoint presentation inspiration graphics pictures. This is a two stage process. The stages in this process are net profit ratio, net profit after tax, net sales, gross profit ratio.

Profitability Ratios Template 2 Ppt PowerPoint Presentation Professional Slide
This is a profitability ratios template 2 ppt powerpoint presentation professional slide. This is a two stage process. The stages in this process are net profit ratio, net profit after tax, net sales, gross profit ratio.

Area Chart Ppt PowerPoint Presentation Infographics Graphics Tutorials
This is a area chart ppt powerpoint presentation infographics graphics tutorials. This is a two stage process. The stages in this process are product, area chart, sales in percentage.

Bar Chart Ppt PowerPoint Presentation Slides Design Ideas
This is a bar chart ppt powerpoint presentation slides design ideas. This is a six stage process. The stages in this process are product, bar chart, sales in percentage.

Clustered Column Line Ppt PowerPoint Presentation File Examples
This is a clustered column line ppt powerpoint presentation file examples. This is a three stage process. The stages in this process are sales in percentage, product, business, marketing, success.
Plan And Pricing Ppt PowerPoint Presentation Icon Templates
This is a plan and pricing ppt powerpoint presentation icon templates. This is a three stage process. The stages in this process are package, pricing, business, sales, success, strategy.

Area Chart Ppt PowerPoint Presentation Icon Layout Ideas
This is a area chart ppt powerpoint presentation icon layout ideas. This is a two stage process. The stages in this process are area chart, sales in percentage, years, planning, business.

Bar Graph Ppt PowerPoint Presentation Infographic Template Template
This is a bar graph ppt powerpoint presentation infographic template template. This is a three stage process. The stages in this process are bar graph, sales in percentage, product, planning, business.

Clustered Column Line Chart Ppt PowerPoint Presentation File Pictures
This is a clustered column line chart ppt powerpoint presentation file pictures. This is a four stage process. The stages in this process are clustered bar, product, planning, business, sales in percentage.
Market Segmentation Evaluation Ppt PowerPoint Presentation Icon Pictures
This is a market segmentation evaluation ppt powerpoint presentation icon pictures. This is a two stage process. The stages in this process are net profit, in usd millions, market sales, business, marketing.

Bar Chart Ppt PowerPoint Presentation Professional Files
This is a bar chart ppt powerpoint presentation professional files. This is a seven stage process. The stages in this process are bar chart, product, sales in percentage, financial years.

Column Chart Ppt PowerPoint Presentation Gallery Design Inspiration
This is a column chart ppt powerpoint presentation gallery design inspiration. This is a two stage process. The stages in this process are column chart, product, sales in percentage, financial years.
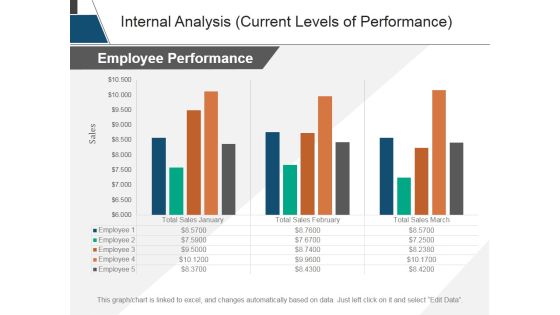
Internal Analysis Current Levels Of Performance Ppt PowerPoint Presentation Tips
This is a internal analysis current levels of performance ppt powerpoint presentation tips. This is a three stage process. The stages in this process are sales, employee performance, years, business, marketing.
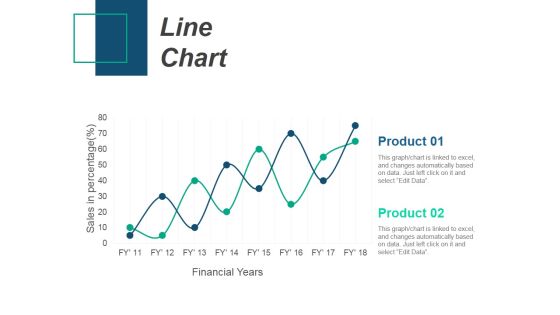
Line Chart Ppt PowerPoint Presentation Infographic Template Introduction
This is a line chart ppt powerpoint presentation infographic template introduction. This is a two stage process. The stages in this process are product, sales in percentage, financial years, line chart.

Area Chart Ppt PowerPoint Presentation Styles Images
This is a area chart ppt powerpoint presentation styles images. This is a two stage process. The stages in this process are sales in percentage, product, graph, business, marketing.

Clustered Column Line Ppt PowerPoint Presentation Model Images
This is a clustered column line ppt powerpoint presentation model images. This is a four stage process. The stages in this process are sales in percentage, product, business, marketing, bar graph.
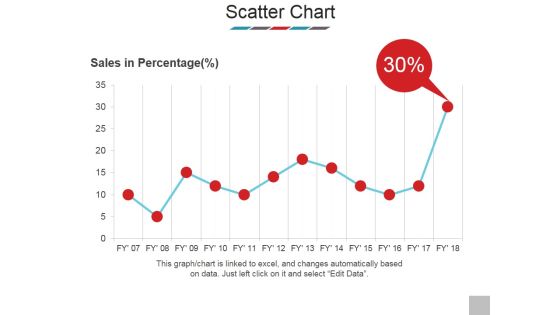
Scatter Chart Ppt PowerPoint Presentation Model Show
This is a scatter chart ppt powerpoint presentation model show. This is a one stage process. The stages in this process are sales in percentage, scatter chart, business, bar graph, marketing.

Bar Graph Ppt PowerPoint Presentation Model Clipart
This is a bar graph ppt powerpoint presentation model clipart. This is a six stage process. The stages in this process are sales in percentage, product, bar graph, business, marketing.
