Procurement Planning Dashboards
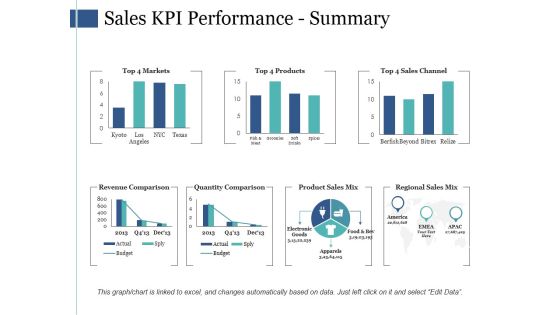
Sales Kpi Performance Summary Ppt PowerPoint Presentation Infographic Template Infographics
This is a sales kpi performance summary ppt powerpoint presentation infographic template infographics. This is a seven stage process. The stages in this process are revenue comparison, quantity comparison, product sales mix, regional sales mix.

Approaches For New Product Release Defining The Strategic Approach To Product Marketing Rules PDF
This slide shows RACE planning framework to reach, act, convert and engage the audience with activities for marketing and digital marketing plan with KPIs This is a approaches for new product release defining the strategic approach to product marketing rules pdf template with various stages. Focus and dispense information on five stages using this creative set, that comes with editable features. It contains large content boxes to add your information on topics like brand content, publishers and blogs, interactive tools, customer advocacy. You can also showcase facts, figures, and other relevant content using this PPT layout. Grab it now.

Proof Concept Variety Shop Your Investment For Retail Store Opening Feasibility Study Services Price Themes PDF
Presenting this set of slides with name proof concept variety shop your investment for retail store opening feasibility study services price themes pdf. The topics discussed in these slides are reporting and analytics, inventory planning and control, staffing licensing. This is a completely editable PowerPoint presentation and is available for immediate download. Download now and impress your audience.
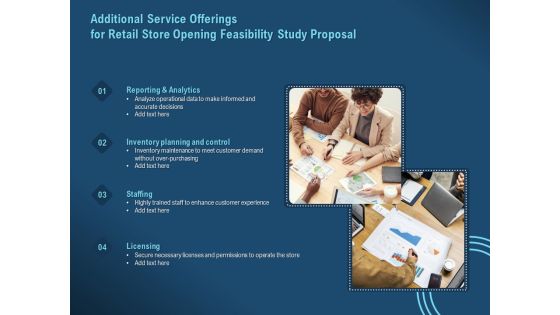
Proof Concept Variety Shop Additional Service Offerings For Retail Store Opening Feasibility Study Proposal Themes PDF
Presenting this set of slides with name proof concept variety shop additional service offerings for retail store opening feasibility study proposal themes pdf. This is a four stage process. The stages in this process are reporting and analytics, inventory planning and control, staffing licensing. This is a completely editable PowerPoint presentation and is available for immediate download. Download now and impress your audience.

Retail Store Social Media Activities Analysis Retail Outlet Performance Assessment Rules PDF
This slide represents the dashboard to showcase retail store social media activities such as followers on Facebook, Twitter, website traffic, etc. It also provides information regarding social media channels engagement in terms of clicks, shares, likes, and comments.Deliver an awe inspiring pitch with this creative Retail Store Social Media Activities Analysis Retail Outlet Performance Assessment Rules PDF bundle. Topics like Social Media, Channels, Referral Traffic can be discussed with this completely editable template. It is available for immediate download depending on the needs and requirements of the user.
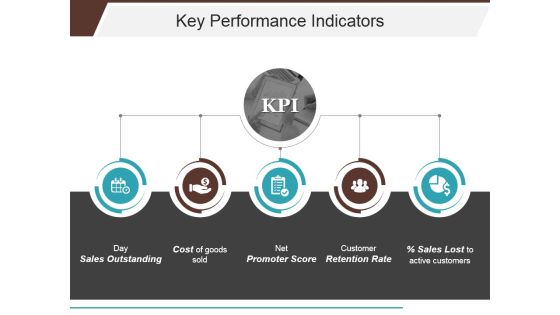
Key Performance Indicators Template 1 Ppt PowerPoint Presentation Portfolio Background Image
This is a key performance indicators template 1 ppt powerpoint presentation portfolio background image. This is a five stage process. The stages in this process are sales outstanding, cost of goods sold, net promoter score, customer retention rate, sales lost to active customers.

Channel Kpis Template 2 Ppt PowerPoint Presentation Show Designs
This is a channel kpis template 2 ppt powerpoint presentation show designs. This is a four stage process. The stages in this process are channel kpis, inspiration, evaluation, purchase, stationary pos.

Cash Position By Quarter Ppt PowerPoint Presentation Outline
This is a cash position by quarter ppt powerpoint presentation outline. This is a four stage process. The stages in this process are cash position, cash in, initial funding, sales, total cash in.

Business Retail Shop Selling Your Investment For Retail Business Services Elements PDF
Presenting this set of slides with name business retail shop selling your investment for retail business services elements pdf. The topics discussed in these slides are reporting and analytics, staffing, licensing, inventory planning and control. This is a completely editable PowerPoint presentation and is available for immediate download. Download now and impress your audience.

Business Retail Shop Selling Additional Service Offerings For Retail Business Proposal Introduction PDF
Presenting this set of slides with name business retail shop selling additional service offerings for retail business proposal introduction pdf. This is a four stage process. The stages in this process are reporting and analytics, staffing, licensing, inventory planning and control. This is a completely editable PowerPoint presentation and is available for immediate download. Download now and impress your audience.

Key Sales Performance Metrics Ppt PowerPoint Presentation Slides Designs
This is a key sales performance metrics ppt powerpoint presentation slides designs. This is a four stage process. The stages in this process are campaigns to drive traffic, visitors, trials, closed deals.
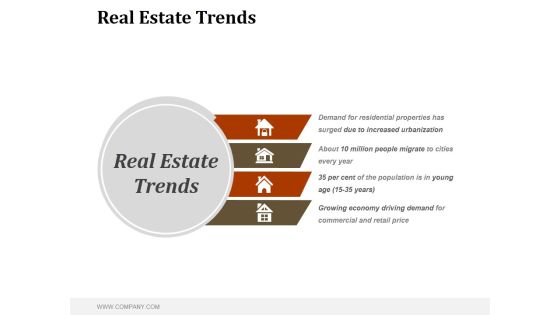
Real Estate Trends Ppt PowerPoint Presentation Examples
This is a real estate trends ppt powerpoint presentation examples. This is a four stage process. The stages in this process are business, marketing, management, trends, innovation.

Market Trends Percentage Spending By Region Ppt PowerPoint Presentation Inspiration Graphic Images
This is a market trends percentage spending by region ppt powerpoint presentation inspiration graphic images. This is a two stage process. The stages in this process are western europe, asia, north america, eastern europe, latin america, middle east.
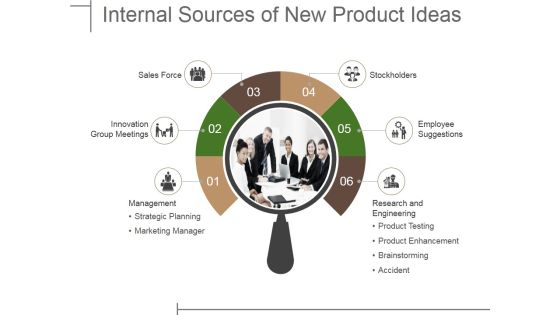
Internal Sources Of New Product Ideas Ppt PowerPoint Presentation Infographics Graphics Download
This is a internal sources of new product ideas ppt powerpoint presentation infographics graphics download. This is a six stage process. The stages in this process are sales force, innovation group meetings, management, stockholders, employee suggestions.
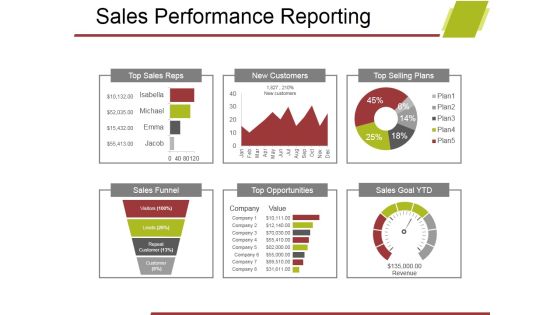
Sales Performance Reporting Ppt PowerPoint Presentation Gallery Introduction
This is a sales performance reporting ppt powerpoint presentation gallery introduction. This is a six stage process. The stages in this process are top sales reps, new customers, top selling plans, sales funnel, opportunities, sales goal ytd.

Financial Projections And Key Metrics Ppt PowerPoint Presentation Styles Skills
This is a financial projections and key metrics ppt powerpoint presentation styles skills. This is a five stage process. The stages in this process are expenses, profits, sales, employees, years.

Media Kpis Performance Evaluation Ppt PowerPoint Presentation Information
This is a media kpis performance evaluation ppt powerpoint presentation information. This is a three stage process. The stages in this process are traffic, engagement, conversion.
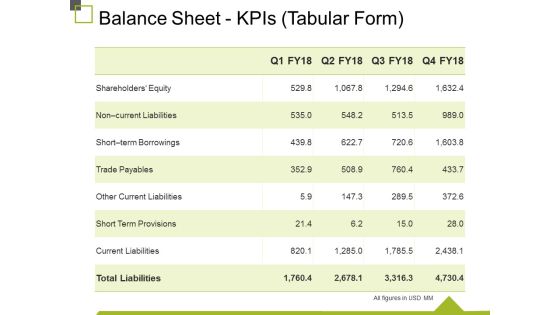
Balance Sheet Kpis Tabular Form Ppt PowerPoint Presentation Gallery Example
This is a balance sheet kpis tabular form ppt powerpoint presentation gallery example. This is a four stage process. The stages in this process are trade payables, other current liabilities, short term provisions, current liabilities, total liabilities.
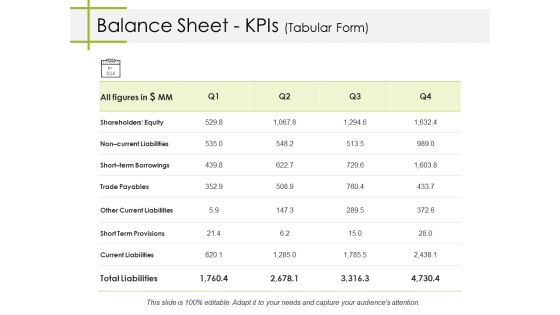
Balance Sheet Kpis Tabular Form Ppt PowerPoint Presentation Pictures Gridlines
This is a balance sheet kpis tabular form ppt powerpoint presentation pictures gridlines. This is a four stage process. The stages in this process are trade payables, other current liabilities, short term provisions, current liabilities, short term borrowings.
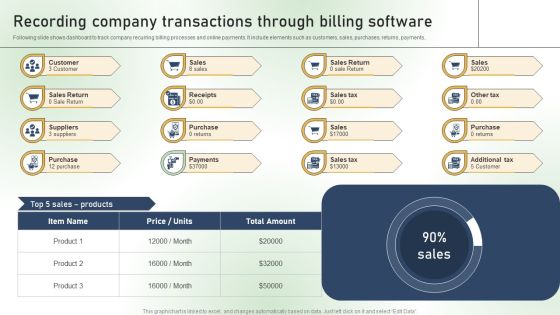
Recording Company Transactions Through Billing Software Ppt PowerPoint Presentation File Files PDF
Following slide shows dashboard to track company recurring billing processes and online payments. It include elements such as customers, sales, purchases, returns, payments, Boost your pitch with our creative Recording Company Transactions Through Billing Software Ppt PowerPoint Presentation File Files PDF. Deliver an awe-inspiring pitch that will mesmerize everyone. Using these presentation templates you will surely catch everyones attention. You can browse the ppts collection on our website. We have researchers who are experts at creating the right content for the templates. So you do not have to invest time in any additional work. Just grab the template now and use them.

Measuring Sales Performance And Productivity Ppt PowerPoint Presentation Infographic Template Sample
This is a measuring sales performance and productivity ppt powerpoint presentation infographic template sample. This is a eight stage process. The stages in this process are sales objectives, sales goal, achieving sales target.

P And L Kpis Ppt PowerPoint Presentation Portfolio Slide
This is a p and l kpis ppt powerpoint presentation portfolio slide. This is a four stage process. The stages in this process are ebitda, profit before tax, profit after tax, expenses, net sales.

Pandl Kpis Tabular Form Ppt PowerPoint Presentation Outline Background
This is a pandl kpis tabular form ppt powerpoint presentation outline background. This is a four stage process. The stages in this process are net sales, expenses, ebitda, profit before tax, profit after tax.

Reaching Business Goals Performance Indicator Ppt PowerPoint Presentation Pictures Infographic Template
This is a reaching business goals performance indicator ppt powerpoint presentation pictures infographic template. This is a one stage process. The stages in this process are sales objectives, sales goal, achieving sales target.

Balance Sheet Kpis Tabular Form Template 1 Ppt PowerPoint Presentation Pictures Tips
This is a balance sheet kpis tabular form template 1 ppt powerpoint presentation pictures tips. This is a four stage process. The stages in this process are noncurrent liabilities, short term borrowings, trade payables, other current liabilities, short term provisions.

Balance Sheet Kpis Tabular Form Cont Ppt PowerPoint Presentation Model Graphics Tutorials
This is a balance sheet kpis tabular form cont ppt powerpoint presentation model graphics tutorials. This is a four stage process. The stages in this process are long term loans and advances, current investments, inventories, trade receivables.
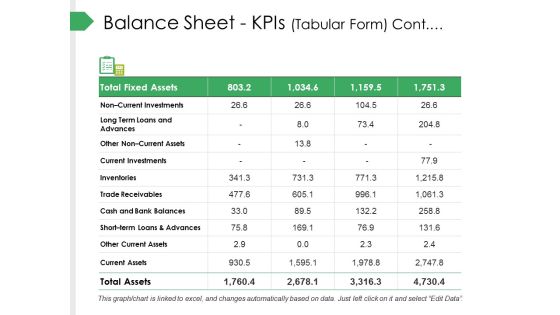
Balance Sheet Kpis Tabular Form Cont Ppt PowerPoint Presentation Summary Templates
This is a balance sheet kpis tabular form cont ppt powerpoint presentation summary templates. This is a four stage process. The stages in this process are current investments, inventories, trade receivables, cash and bank balances.
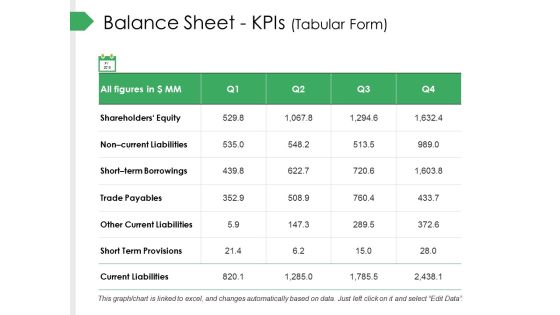
Balance Sheet Kpis Tabular Form Ppt PowerPoint Presentation Slides Designs Download
This is a balance sheet kpis tabular form ppt powerpoint presentation slides designs download. This is a four stage process. The stages in this process are trade payables, other current liabilities, short term provisions, current liabilities, short term borrowings.

Channel Kpis Template 1 Ppt PowerPoint Presentation Infographic Template Elements
This is a channel kpis template 1 ppt powerpoint presentation infographic template elements. This is a four stage process. The stages in this process are channel kpis, sales density, personnel cost, real estate cost, inventory turnover.

Channel Kpis Template Ppt PowerPoint Presentation Show Portfolio
This is a channel kpis template ppt powerpoint presentation show portfolio. This is a four stage process. The stages in this process are sales density, personnel cost, real estate cost, inventory turnover.
Pandl Kpis Tabular Form Ppt PowerPoint Presentation Icon
This is a pandl kpis tabular form ppt powerpoint presentation icon. This is a four stage process. The stages in this process are business, net sales, total income, expenses, profit before tax, profit after tax.
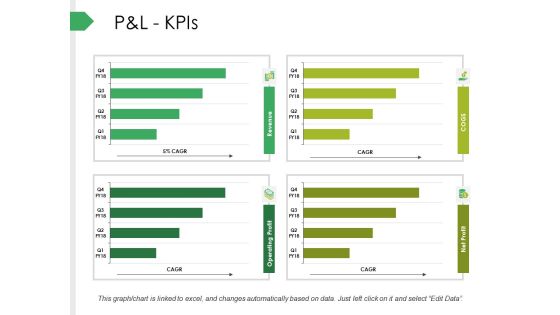
P And L Kpis Ppt PowerPoint Presentation Infographics Background
This is a p and l kpis ppt powerpoint presentation infographics background. This is a four stage process. The stages in this process are net sales, expenses, ebitda, profit before tax, profit after tax.

Competitive Analysis Report Ppt PowerPoint Presentation Tips
This is a competitive analysis report ppt powerpoint presentation tips. This is a eight stage process. The stages in this process are number of competitors, number of companies that exited, replacement rate industrial cameras, replacement rate frame grabbers, average product development time industrial cameras, average product development time frame grabbers, r and d spend as a per cent of market revenue, marketing spend as a per cent of market revenue.
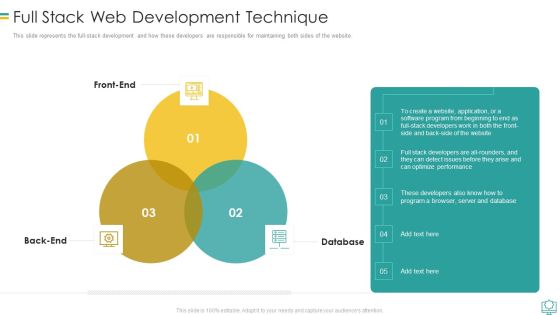
Full Stack Web Development Technique Infographics PDF
This slide represents the full stack development and how these developers are responsible for maintaining both sides of the website.Presenting Full Stack Web Development Technique Infographics PDF to provide visual cues and insights. Share and navigate important information on three stages that need your due attention. This template can be used to pitch topics like Program A Browser, Optimize Performance, Software Program In addtion, this PPT design contains high resolution images, graphics, etc, that are easily editable and available for immediate download.

Business Framework Enterprise Performance Management PowerPoint Presentation
This image slide has been designed to depict enterprise performance management diagram. This image slide displays business planning and forecasting. This image slide may be used to exhibit business performance management in your presentations. This image slide will give edge to your presentations.
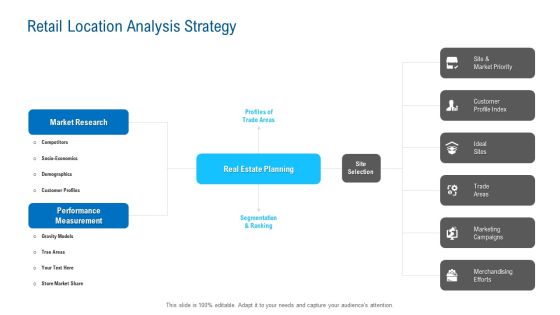
Merchandising Industry Analysis Retail Location Analysis Strategy Infographics PDF
Deliver an awe inspiring pitch with this creative merchandising industry analysis retail location analysis strategy infographics pdf bundle. Topics like market research, performance measurement, real estate planning can be discussed with this completely editable template. It is available for immediate download depending on the needs and requirements of the user.

Balance Sheet Kpis Tabular Form Template 2 Ppt PowerPoint Presentation Summary Structure
This is a balance sheet kpis tabular form template 2 ppt powerpoint presentation summary structure. This is a four stage process. The stages in this process are net sales, expenses, ebitda, profit after tax, finecing cost.
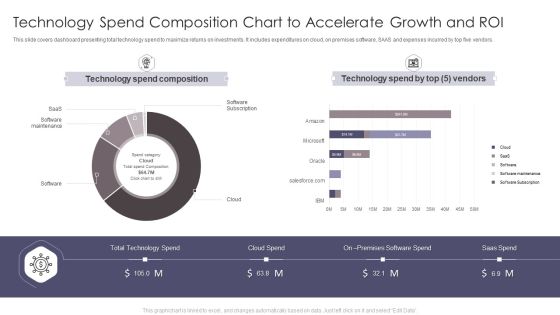
Technology Spend Composition Chart To Accelerate Growth And Roi Summary PDF
This slide covers dashboard presenting total technology spend to maximize returns on investments. It includes expenditures on cloud, on premises software, SAAS and expenses incurred by top five vendors. Pitch your topic with ease and precision using this Technology Spend Composition Chart To Accelerate Growth And Roi Summary PDF. This layout presents information on Technology Spend Composition, Technology Spend. It is also available for immediate download and adjustment. So, changes can be made in the color, design, graphics or any other component to create a unique layout.
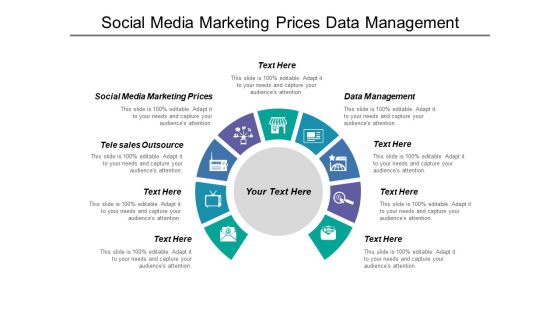
Social Media Marketing Prices Data Management Tele Sales Outsource Ppt PowerPoint Presentation Infographic Template Background
This is a social media marketing prices data management tele sales outsource ppt powerpoint presentation infographic template background. This is a nine stage process. The stages in this process are social media marketing prices, data management, tele sales outsource.

Sales And Marketing Challenges Ppt PowerPoint Presentation Styles Master Slide
This is a sales and marketing challenges ppt powerpoint presentation styles master slide. This is a six stage process. The stages in this process are salespeople reporting false or misleading information to sales management, salespeople not reporting crucial information, sales reps short on sales skills, risk of duplication, no reliable automatic way to track sales.
Quality Cost Report Ppt PowerPoint Presentation Icon Information
This is a quality cost report ppt powerpoint presentation icon information. This is a three stage process. The stages in this process are types of cost, quality cost, percentage of sales, prevention cost business.
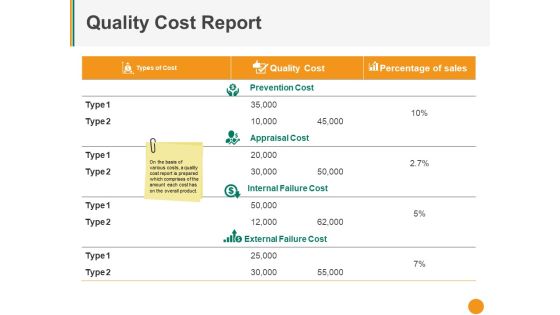
Quality Cost Report Ppt PowerPoint Presentation Model Portrait
This is a quality cost report ppt powerpoint presentation model portrait. This is a three stage process. The stages in this process are types of cost, quality cost, percentage of sales, prevention cost, appraisal cost.

Quality Cost Report Ppt PowerPoint Presentation Portfolio Show
This is a quality cost report ppt powerpoint presentation portfolio show. This is a four stage process. The stages in this process are types of cost, quality cost, percentage of sales, prevention cost, appraisal cost.
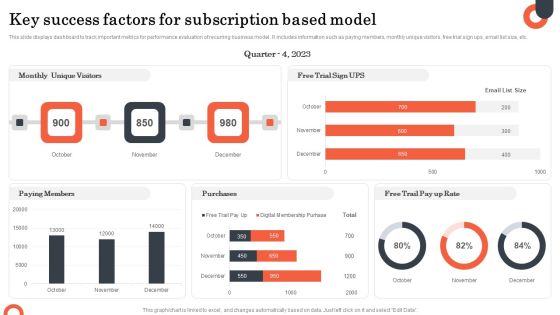
Key Success Factors For Subscription Based Model Formats PDF
This slide displays dashboard to track important metrics for performance evaluation of recurring business model . It includes information such as paying members, monthly unique visitors, free trial sign ups, email list size, etc. Showcasing this set of slides titled Key Success Factors For Subscription Based Model Formats PDF. The topics addressed in these templates are Monthly Unique Visitors, Purchases, Paying Members. All the content presented in this PPT design is completely editable. Download it and make adjustments in color, background, font etc. as per your unique business setting.

Crm Components Ppt PowerPoint Presentation Infographics Grid
This is a crm components ppt powerpoint presentation infographics grid. This is a two stage process. The stages in this process are customer interaction center, self serve channels, customer sales, customer marketing, customer field service, customer service, customer analysis and reporting, various system.

Advertising Programs Management Techniques Digital Marketing Performance Evaluation Slides PDF
This slide showcases the dashboard that helps to track and measure digital marketing campaign performance. It includes cost, clicks, impressions, STR, conversion rate, etc. Make sure to capture your audiences attention in your business displays with our gratis customizable Advertising Programs Management Techniques Digital Marketing Performance Evaluation Slides PDF. These are great for business strategies, office conferences, capital raising or task suggestions. If you desire to acquire more customers for your tech business and ensure they stay satisfied, create your own sales presentation with these plain slides.
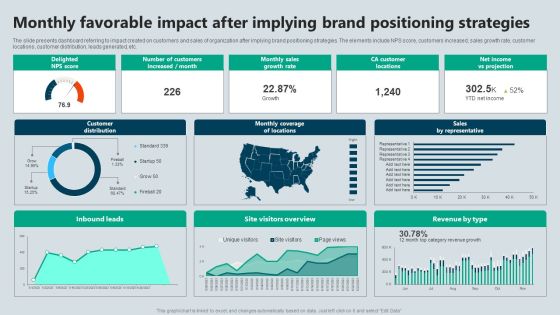
Monthly Favorable Impact After Implying Brand Positioning Strategies Demonstration PDF
The slide presents dashboard referring to impact created on customers and sales of organization after implying brand positioning strategies. The elements include NPS score, customers increased, sales growth rate, customer locations, customer distribution, leads generated, etc. Pitch your topic with ease and precision using this Monthly Favorable Impact After Implying Brand Positioning Strategies Demonstration PDF. This layout presents information on Strategies, Projection, Growth Rate. It is also available for immediate download and adjustment. So, changes can be made in the color, design, graphics or any other component to create a unique layout.
Monthly Services Business Marketing Strategy Implementation Timeline Professional PDF
Following slide demonstrates dashboard for monitoring services company sales strategy impact on maximizing business profits. It includes elements such as number of sales, revenue, profit, cost, monthly sales revenue, cost breakdown, up and cross sell, revenue collected and sales by communication channel. Showcasing this set of slides titled Monthly Services Business Marketing Strategy Implementation Timeline Professional PDF. The topics addressed in these templates are Strategy, Lead Generation, Customer Retention. All the content presented in this PPT design is completely editable. Download it and make adjustments in color, background, font etc. as per your unique business setting.

Clothing Business Market Entry Strategy Company Key Figures For Past 5 Years Infographics PDF
This slide covers the dashboard with major values for the last five years. It includes KPIs such as sales, net operating profit, sales by geographic areas, and number of employees. Deliver an awe inspiring pitch with this creative Clothing Business Market Entry Strategy Company Key Figures For Past 5 Years Infographics PDF bundle. Topics like Geographical Area, Operating Profit, Billions Of Euros can be discussed with this completely editable template. It is available for immediate download depending on the needs and requirements of the user.
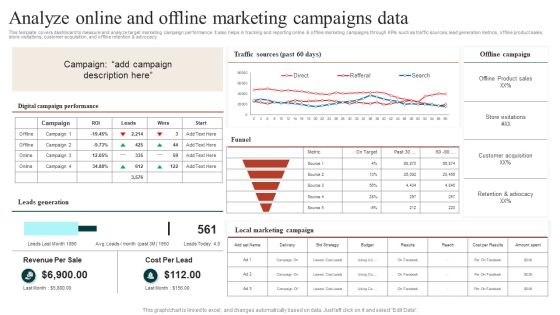
Target Marketing Techniques Analyze Online And Offline Marketing Campaigns Data Ideas PDF
This template covers dashboard to measure and analyze target marketing campaign performance. It also helps in tracking and reporting online and offline marketing campaigns through KPIs such as traffic sources, lead generation metrics, offline product sales, store visitations, customer acquisition, and offline retention and advocacy Find a pre designed and impeccable Target Marketing Techniques Evaluating Growth Rate For Target Marketing Slides PDF. The templates can ace your presentation without additional effort. You can download these easy to edit presentation templates to make your presentation stand out from others. So, what are you waiting for Download the template from Slidegeeks today and give a unique touch to your presentation.
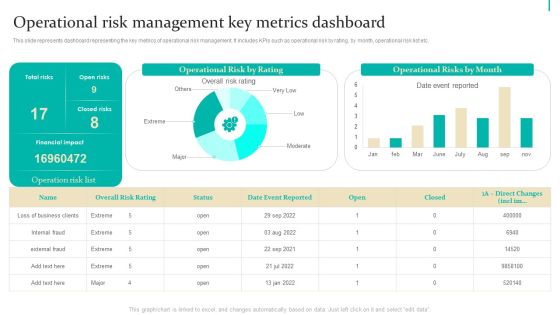
Enterprise Risk Management Operational Risk Management Key Metrics Inspiration PDF
This slide represents dashboard representing the key metrics of operational risk management. It includes KPIs such as operational risk by rating, by month, operational risk list etc. Boost your pitch with our creative Enterprise Risk Management Operational Risk Management Key Metrics Inspiration PDF. Deliver an awe-inspiring pitch that will mesmerize everyone. Using these presentation templates you will surely catch everyones attention. You can browse the ppts collection on our website. We have researchers who are experts at creating the right content for the templates. So you dont have to invest time in any additional work. Just grab the template now and use them.

Core Components Of Strategic Brand Administration Brand Equity Performance Professional PDF
This slide provides information regarding brand equity performance assessment dashboard that highlights customer lifecycle value, customer adoption rate, mentions, engagement, etc. Boost your pitch with our creative Core Components Of Strategic Brand Administration Brand Equity Performance Professional PDF. Deliver an awe-inspiring pitch that will mesmerize everyone. Using these presentation templates you will surely catch everyones attention. You can browse the ppts collection on our website. We have researchers who are experts at creating the right content for the templates. So you do not have to invest time in any additional work. Just grab the template now and use them.
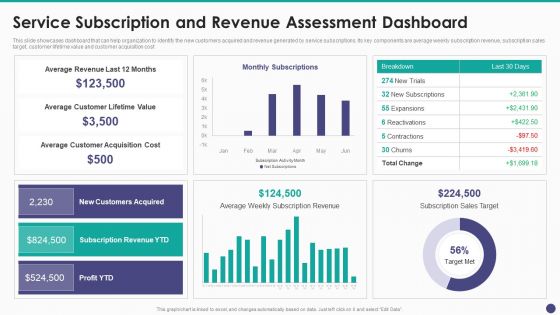
New Service Launch And Development Strategy To Gain Market Share Service Subscription And Revenue Demonstration PDF
This slide showcases dashboard that can help organization to identify the new customers acquired and revenue generated by service subscriptions. Its key components are average weekly subscription revenue, subscription sales target, customer lifetime value and customer acquisition cost.Deliver an awe inspiring pitch with this creative New Service Launch And Development Strategy To Gain Market Share Service Subscription And Revenue Demonstration PDF bundle. Topics like Average Revenue, Average Customer, Customer Acquisition can be discussed with this completely editable template. It is available for immediate download depending on the needs and requirements of the user.
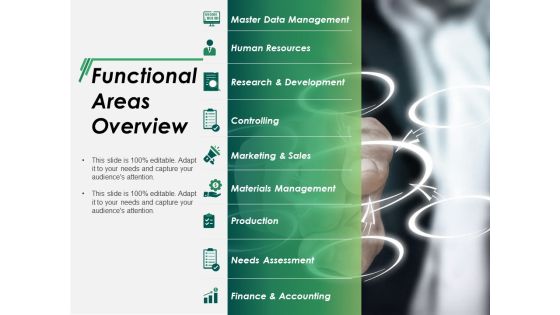
Functional Areas Overview Ppt PowerPoint Presentation Layouts Backgrounds
This is a functional areas overview ppt powerpoint presentation layouts backgrounds. This is a nine stage process. The stages in this process are master data management, human resources, controlling, marketing and sales, materials management.

B2B Demand Generation Best Practices Table Of CONTENTS Ppt PowerPoint Presentation File Master Slide PDF
This is a b2b demand generation best practices table of contents ppt powerpoint presentation file master slide pdf template with various stages. Focus and dispense information on six stages using this creative set, that comes with editable features. It contains large content boxes to add your information on topics like b2b buyer sales enablement, various initiatives for b2b buyer engagement, b2b account management team overview, cost assessment, impact assessment, dashboard assessment. You can also showcase facts, figures, and other relevant content using this PPT layout. Grab it now.
Sales Process Management To Boost Business Effectiveness Sales Pipeline Tracking And Reporting Introduction PDF
This slide shows dashboard to track the performance of sales pipeline. Major points covered under this are number of opportunities, conversion rate, win rate, opportunity status etc. Deliver and pitch your topic in the best possible manner with this Sales Process Management To Boost Business Effectiveness Sales Pipeline Tracking And Reporting Introduction PDF. Use them to share invaluable insights on Return On Investment, Investment Review, Average Length and impress your audience. This template can be altered and modified as per your expectations. So, grab it now.
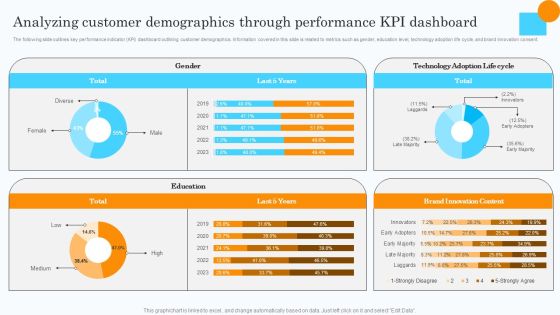
Market Research Assessment Of Target Market Requirements Analyzing Customer Demographics Clipart PDF
The following slide outlines key performance indicator KPI dashboard outlining customer demographics. Information covered in this slide is related to metrics such as gender, education level, technology adoption life cycle, and brand innovation consent. There are so many reasons you need a Market Research Assessment Of Target Market Requirements Analyzing Customer Demographics Clipart PDF. The first reason is you cannot spend time making everything from scratch, Thus, Slidegeeks has made presentation templates for you too. You can easily download these templates from our website easily.

Analyze Online And Offline Marketing Campaigns Data Ideas PDF
This template covers dashboard to measure and analyze target marketing campaign performance. It also helps in tracking and reporting online and offline marketing campaigns through KPIs such as traffic sources, lead generation metrics, offline product sales, store visitations, customer acquisition, and offline retention and advocacy. Find a pre designed and impeccable Analyze Online And Offline Marketing Campaigns Data Ideas PDF. The templates can ace your presentation without additional effort. You can download these easy to edit presentation templates to make your presentation stand out from others. So, what are you waiting for Download the template from Slidegeeks today and give a unique touch to your presentation.

Customer Sales Kpis Of Distribution Company Ppt Infographic Template Templates PDF
This slide showcase customer sales dashboard that helps in providing self service analysis to monitored customer sales metrics. It includes sales by location, gross product margin, product cost actual vs targeted. Showcasing this set of slides titled Customer Sales Kpis Of Distribution Company Ppt Infographic Template Templates PDF. The topics addressed in these templates are Gross Product Margin, Sales Revenue, Industrial Sales Trend. All the content presented in this PPT design is completely editable. Download it and make adjustments in color, background, font etc. as per your unique business setting.
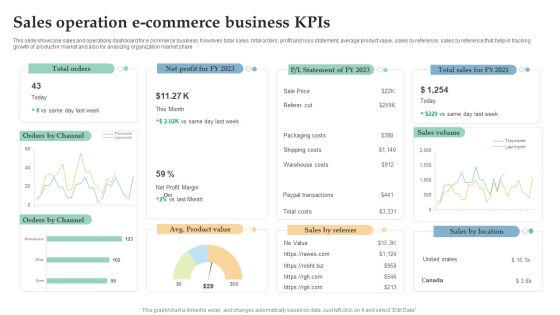
Sales Operation E Commerce Business Kpis Ppt Infographics Design Templates PDF
This slide showcase sales and operations dashboard for e commerce business. It involves total sales, total orders, profit and loss statement, average product value, sales by reference, sales by reference that help in tracking growth of product in market and also for analyzing organization market share. Pitch your topic with ease and precision using this Sales Operation E Commerce Business Kpis Ppt Infographics Design Templates PDF. This layout presents information on Total Orders, Sales Volume, Orders Channel. It is also available for immediate download and adjustment. So, changes can be made in the color, design, graphics or any other component to create a unique layout.
 Home
Home