Procurement Management

Break Even Analysis Ppt PowerPoint Presentation Outline Example Topics
This is a break even analysis ppt powerpoint presentation outline example topics. This is a five stage process. The stages in this process are units of output, variable, fixed cost, total cost, sales revenue.

Column Chart Ppt PowerPoint Presentation Ideas Vector
This is a column chart ppt powerpoint presentation ideas vector. This is a two stage process. The stages in this process are column chart, product, financial years, sales in percentage, growth.
Growth Strategy Ppt PowerPoint Presentation Layouts Icon
This is a growth strategy ppt powerpoint presentation layouts icon. This is a three stage process. The stages in this process are marketing and sales, customer service, product development.

Scatter Line Ppt PowerPoint Presentation Professional Design Inspiration
This is a scatter line ppt powerpoint presentation professional design inspiration. This is a one stage process. The stages in this process are product, sales in percentage, dollar in millions.

Break Even Analysis Ppt PowerPoint Presentation Pictures Good
This is a break even analysis ppt powerpoint presentation pictures good. This is a five stage process. The stages in this process are key comments on the table, units of output, fixed cost, variable cost, sales revenue.

Growth Strategy Ppt PowerPoint Presentation Ideas Graphics Tutorials
This is a growth strategy ppt powerpoint presentation ideas graphics tutorials. This is a three stage process. The stages in this process are marketing and sales, customer service, product development, growth strategy, business.

Clustered Column Ppt PowerPoint Presentation Gallery Format
This is a clustered column ppt powerpoint presentation gallery format. This is a two stage process. The stages in this process are business, marketing, graph, financial year, sales in percentage.

Area Chart Ppt PowerPoint Presentation Infographics Good
This is a area chart ppt powerpoint presentation infographics good. This is a two stage process. The stages in this process are sales in percentage, product, area chart, business, percentage.

Month Wise Budget Forecasting Ppt PowerPoint Presentation Model Show
This is a month wise budget forecasting ppt powerpoint presentation model show. This is a four stage process. The stages in this process are budget, actual, revenue, sales, direct costs.

Bar Chart Ppt PowerPoint Presentation Outline Backgrounds
This is a bar chart ppt powerpoint presentation outline backgrounds. This is a one stage process. The stages in this process are sales in percentage, financial years, product, bar graph, finance.
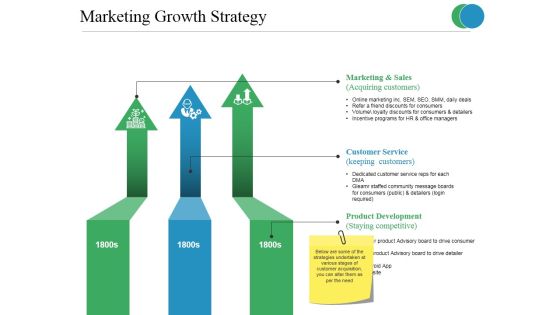
Marketing Growth Strategy Ppt PowerPoint Presentation Slides Examples
This is a marketing growth strategy ppt powerpoint presentation slides examples. This is a three stage process. The stages in this process are marketing and sales, customer service, product development.
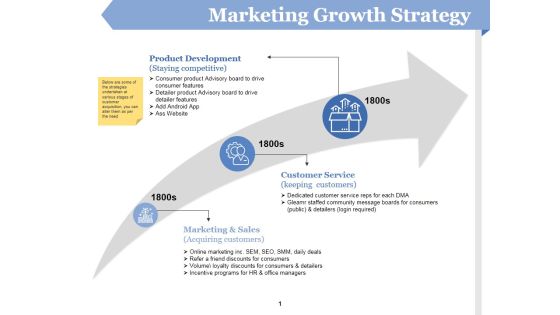
Marketing Growth Strategy Ppt PowerPoint Presentation Ideas Deck
This is a marketing growth strategy ppt powerpoint presentation ideas deck. This is a three stage process. The stages in this process are product development, marketing and sales, customer service, business, icons, percentage.
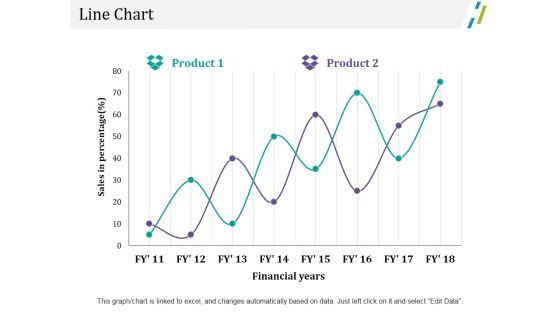
Line Chart Ppt PowerPoint Presentation Outline File Formats
This is a line chart ppt powerpoint presentation outline file formats. This is a two stage process. The stages in this process are business, marketing, sales in percentage, financial years, chart.
P And L Kpis Template 1 Ppt PowerPoint Presentation Icon Graphics Download
This is a p and l kpis template 1 ppt powerpoint presentation icon graphics download. This is a four stage process. The stages in this process are net sales, total income, expenses, financing cost, profit after tax.
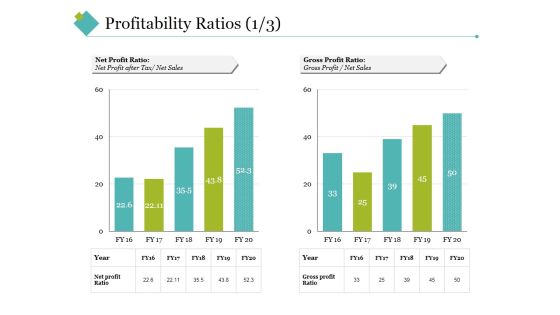
Profitability Ratios Template 2 Ppt PowerPoint Presentation Styles Example Topics
This is a profitability ratios template 2 ppt powerpoint presentation styles example topics. This is a two stage process. The stages in this process are net profit ratio, gross profit ratio, net sales, gross profit, year.

Activity Ratios Template 4 Ppt PowerPoint Presentation Styles Slideshow
This is a activity ratios template 4 ppt powerpoint presentation styles slideshow. This is a two stage process. The stages in this process are total asset turnover, fixed assets turnover, net sales, year, net profit ratio, gross profit ratio.

Bar Chart Ppt PowerPoint Presentation Model Picture
This is a bar chart ppt powerpoint presentation model picture. This is a two stage process. The stages in this process are product, sales in percentage, financial years, bar chart.

Marketing Growth Strategy Ppt PowerPoint Presentation Gallery Show
This is a marketing growth strategy ppt powerpoint presentation gallery show. This is a three stage process. The stages in this process are marketing and sales, customer service, product development.

Area Chart Ppt PowerPoint Presentation Model Slides
This is a area chart ppt powerpoint presentation model slides. This is a two stage process. The stages in this process are business, marketing, sales in percentage, chart, percentage, finance.

Area Chart Ppt PowerPoint Presentation File Visuals
This is a area chart ppt powerpoint presentation file visuals. This is a two stage process. The stages in this process are business, sales in percentage, marketing, graph, strategy, finance.

Area Chart Ppt PowerPoint Presentation Pictures Vector
This is a area chart ppt powerpoint presentation pictures vector. This is a two stage process. The stages in this process are sales in percentage, business, marketing, graph, percentage.

Line Chart Ppt PowerPoint Presentation Outline Ideas
This is a line chart ppt powerpoint presentation outline ideas. This is a two stage process. The stages in this process are business, marketing, financial years, sales in percentage, strategy.

Marketing Communication Plan Ppt PowerPoint Presentation Styles Gridlines
This is a marketing communication plan ppt powerpoint presentation styles gridlines. This is a five stage process. The stages in this process are direct marketing, public relations, personal selling, sales promotion.
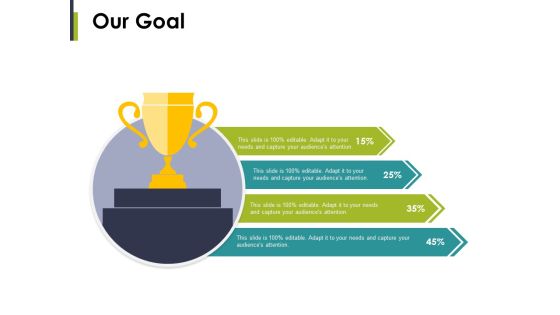
Our Goal Ppt PowerPoint Presentation Professional Graphic Images
This is a product planning cycle ppt powerpoint presentation example 2015. This is a five stage process. The stages in this process are customers, sales, engineering, tech support, market analysis.
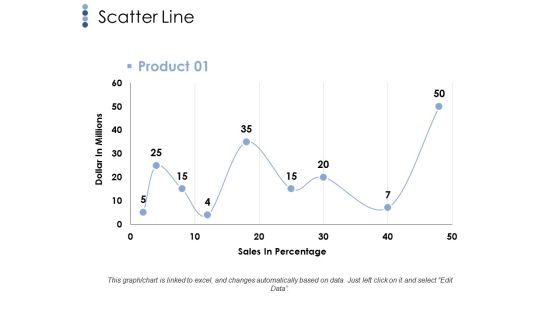
Scatter Line Ppt PowerPoint Presentation File Infographics
This is a scatter line ppt powerpoint presentation file infographics. This is a one stage process. The stages in this process are scatter line, dollar in millions, sales in percentage, business.

Activity Ratios Ppt PowerPoint Presentation Gallery Microsoft
This is a activity ratios ppt powerpoint presentation gallery microsoft. This is a two stage process. The stages in this process are inventory turnover, receivables turnover, net credit sales, average accounts receivable.
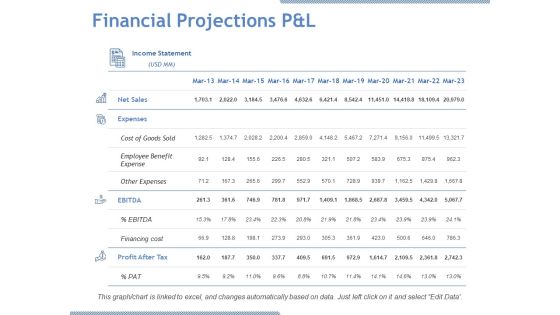
Financial Projections P And L Ppt PowerPoint Presentation Model Design Inspiration
This is a financial projections p and l ppt powerpoint presentation model design inspiration. This is a four stage process. The stages in this process are net sales, expenses, ebitda, profit after tax, cost of goods sold.

P And L Kpis Tabular Form Ppt PowerPoint Presentation Outline Aids
This is a p and l kpis tabular form ppt powerpoint presentation outline aids. This is a four stage process. The stages in this process are net sales, other income, total income, expenses, taxes.

Area Chart Ppt PowerPoint Presentation Outline Graphic Tips
This is a area chart ppt powerpoint presentation outline graphic tips. This is a two stage process. The stages in this process are business, sales in percentage, area chart, percentage, marketing.

Column Chart Ppt PowerPoint Presentation Infographic Template Icon
This is a column chart ppt powerpoint presentation infographic template icon. This is a two stage process. The stages in this process are business, marketing, sales in percentage, financial year, graph.

Break Even Analysis Ppt PowerPoint Presentation Portfolio Graphics Design
This is a break even analysis ppt powerpoint presentation portfolio graphics design. This is a five stage process. The stages in this process are units of output, fixed cost, variable cost, total cost, sales revenue.

Bar Chart Ppt PowerPoint Presentation Summary File Formats
This is a bar chart ppt powerpoint presentation summary file formats. This is a two stage process. The stages in this process are business, finance, financial years, sales in percentage, graph.

Bar Chart Ppt PowerPoint Presentation Model Sample
This is a bar chart ppt powerpoint presentation model sample. This is a two stage process. The stages in this process are sales in percentage, business, marketing, graph, percentage, year.

Balance Sheet Kpis Tabular Form Template 2 Ppt PowerPoint Presentation Summary Structure
This is a balance sheet kpis tabular form template 2 ppt powerpoint presentation summary structure. This is a four stage process. The stages in this process are net sales, expenses, ebitda, profit after tax, finecing cost.

Pandl Kpis Tabular Form Ppt PowerPoint Presentation Outline Background
This is a pandl kpis tabular form ppt powerpoint presentation outline background. This is a four stage process. The stages in this process are net sales, expenses, ebitda, profit before tax, profit after tax.

Revenue Streams Template 3 Ppt PowerPoint Presentation Slides Introduction
This is a revenue streams template 3 ppt powerpoint presentation slides introduction. This is a six stage process. The stages in this process are advertising, sales commission, subscription, affiliate, feature listening.
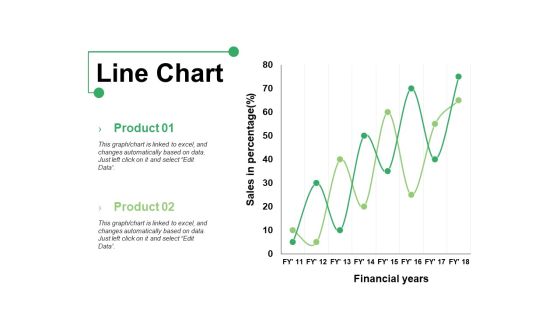
Line Chart Ppt PowerPoint Presentation Show Graphics Example
This is a line chart ppt powerpoint presentation show graphics example. This is a two stage process. The stages in this process are product, line chart, financial years, sales in percentage.

Bar Chart Ppt PowerPoint Presentation Infographics Format Ideas
This is a bar chart ppt powerpoint presentation infographics format ideas. This is a two stage process. The stages in this process are bar graph, product, financial year, sales in percentage.

Financial Projections P And L Ppt PowerPoint Presentation Summary Backgrounds
This is a financial projections p and l ppt powerpoint presentation summary backgrounds. This is a four stage process. The stages in this process are net sales, expenses, other expenses, profit after tax, pat.

Column Chart Ppt PowerPoint Presentation Show Structure
This is a column chart ppt powerpoint presentation show structure. This is a two stage process. The stages in this process are business, financial year in, sales in percentage, marketing, graph.

Financial Projections Pandl Ppt PowerPoint Presentation File Example File
This is a financial projections pandl ppt powerpoint presentation file example file. This is a four stage process. The stages in this process are net sales, expenses, ebitda, profit after tax, business.
Pandl Kpis Tabular Form Ppt PowerPoint Presentation Icon
This is a pandl kpis tabular form ppt powerpoint presentation icon. This is a four stage process. The stages in this process are business, net sales, total income, expenses, profit before tax, profit after tax.
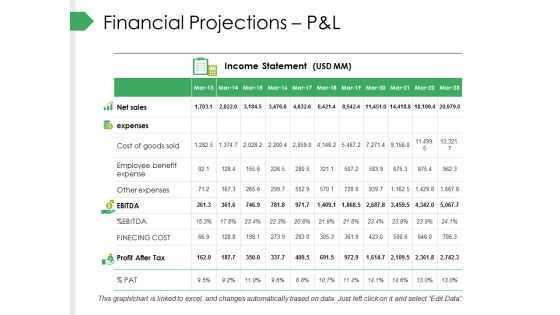
Financial Projections Pandl Ppt PowerPoint Presentation Visual Aids Professional
This is a financial projections pandl ppt powerpoint presentation visual aids professional. This is a four stage process. The stages in this process are net sales, expenses, ebitda, profit after tax, business.
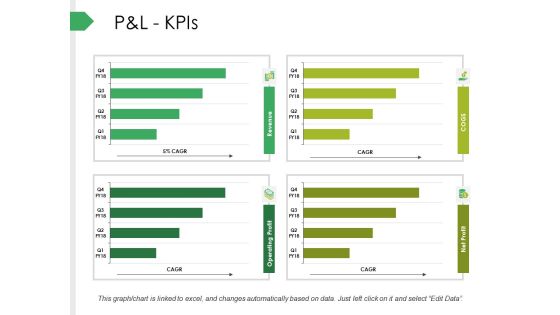
P And L Kpis Ppt PowerPoint Presentation Infographics Background
This is a p and l kpis ppt powerpoint presentation infographics background. This is a four stage process. The stages in this process are net sales, expenses, ebitda, profit before tax, profit after tax.

Line Chart Ppt PowerPoint Presentation Professional Grid
This is a line chart ppt powerpoint presentation professional grid. This is a two stage process. The stages in this process are sales in percentage, financial years, product, line chart.

Area Chart Ppt PowerPoint Presentation Infographics Graphics Pictures
This is a area chart ppt powerpoint presentation infographics graphics pictures. This is a two stage process. The stages in this process are business, sales in percentage, area chart, marketing, graph.

Financial Projections Pandl Ppt PowerPoint Presentation Outline Grid
This is a financial projections pandl ppt powerpoint presentation outline grid. This is a ten stage process. The stages in this process are net sales, expenses, cost of goods sold, other expenses, financing cost.
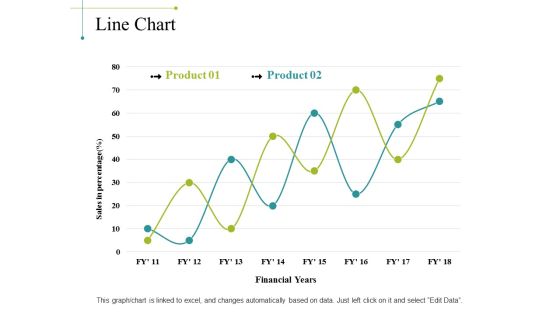
Line Chart Ppt PowerPoint Presentation Portfolio Background Image
This is a line chart ppt powerpoint presentation portfolio background image. This is a two stage process. The stages in this process are sales in percentage, financial years, chart, business, marketing, finance.
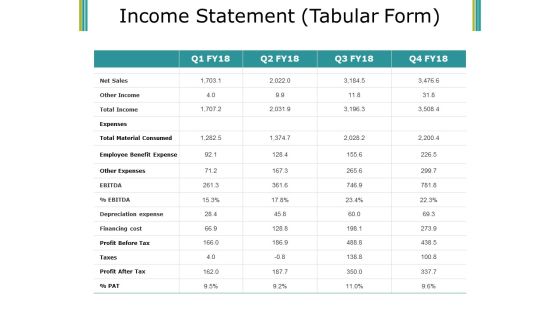
Income Statement Ppt PowerPoint Presentation Layouts Show
This is a income statement ppt powerpoint presentation layouts show. This is a four stage process. The stages in this process are net sales, expenses, total income, texas, profit after tax.

Financial Projections Pandl Ppt PowerPoint Presentation Portfolio Sample
This is a financial projections pandl ppt powerpoint presentation portfolio sample. This is a ten stage process. The stages in this process are net sales, expenses, cost of goods sold, employee benefit expense, other expenses.

Area Chart Ppt PowerPoint Presentation Ideas Professional
This is a area chart ppt powerpoint presentation ideas professional. This is a two stage process. The stages in this process are business, sales in percentage, area chart, marketing, finance.

Financial Projections Income Statement Ppt PowerPoint Presentation Outline Designs Download
This is a financial projections income statement ppt powerpoint presentation outline designs download. This is a one stage process. The stages in this process are net sales, expenses, cost of goods sold, employee benefit expense, other expenses.
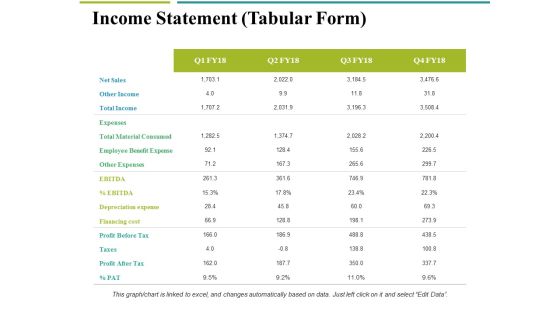
Income Statement Tabular Form Ppt PowerPoint Presentation Inspiration Examples
This is a income statement tabular form ppt powerpoint presentation inspiration examples. This is a four stage process. The stages in this process are net sales, other income, total income, expenses, total material consumed.

Area Chart Ppt PowerPoint Presentation Inspiration Graphics
This is a area chart ppt powerpoint presentation inspiration graphics. This is a two stage process. The stages in this process are product, area chart, business, growth, sales in percentage.
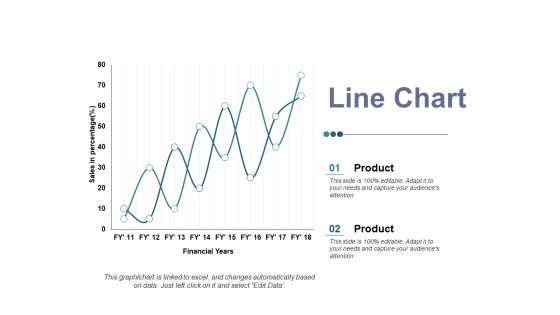
Line Chart Ppt PowerPoint Presentation Ideas Elements
This is a line chart ppt powerpoint presentation ideas elements. This is a two stage process. The stages in this process are product, sales in percentage, financial year, business, line chart.

Area Chart Ppt PowerPoint Presentation Icon Aids
This is a area chart ppt powerpoint presentation icon aids. This is a three stage process. The stages in this process are financial years, sales in percentage, business, marketing, graph.

Bar Chart Ppt PowerPoint Presentation Summary Themes
This is a bar chart ppt powerpoint presentation summary themes. This is a three stage process. The stages in this process are financial years, sales in percentage, business, marketing, graph.

Combo Chart Ppt PowerPoint Presentation Gallery Design Ideas
This is a combo chart ppt powerpoint presentation gallery design ideas. This is a three stage process. The stages in this process are business, financial years, sales in percentage, finance, graph.
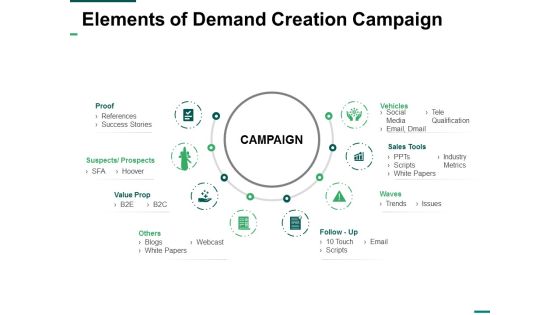
Elements Of Demand Creation Campaign Ppt PowerPoint Presentation Slides Aids
This is a elements of demand creation campaign ppt powerpoint presentation slides aids. This is a eight stage process. The stages in this process are proof, vehicles, sales tools, waves, value prop.

Line Chart Ppt PowerPoint Presentation Infographic Template Master Slide
This is a line chart ppt powerpoint presentation infographic template master slide. This is a two stage process. The stages in this process are product, financial years, sales in percentage.

 Home
Home