Procurement Dashboard

Sales Performance Dashboard Marketing Ppt PowerPoint Presentation Slides Graphics Design
This is a sales performance dashboard marketing ppt powerpoint presentation slides graphics design. This is a four stage process. The stages in this process are compare, marketing, business, management, planning.
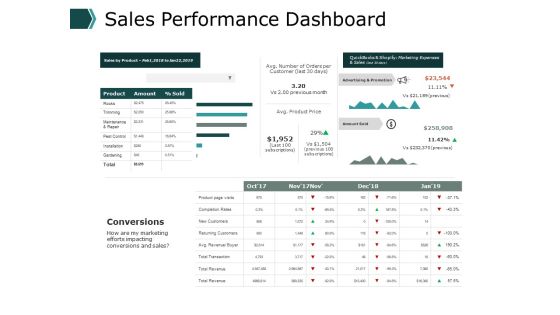
Sales Performance Dashboard Business Ppt PowerPoint Presentation Pictures Visuals
This is a sales performance dashboard business ppt powerpoint presentation pictures visuals . This is a three stage process. The stages in this process are finance, marketing, management, investment, analysis.

Crm Dashboard Leads By Source Ppt PowerPoint Presentation Outline Deck
This is a crm dashboard leads by source ppt powerpoint presentation outline deck. This is a four stage process. The stages in this process are advertisement, email campaign, exhibition, online site.

Crm Dashboard Top Customers Ppt PowerPoint Presentation Styles Designs
This is a crm dashboard top customers ppt powerpoint presentation styles designs. This is a ten stage process. The stages in this process are business, customer, finance, bar graph, marketing, strategy, analysis.
Quality Management Dashboard Ppt PowerPoint Presentation Icon Images
This is a quality management dashboard ppt powerpoint presentation icon images. This is a six stage process. The stages in this process are purpose and overview, scope, roles and responsibilities, metrics and tools, review and audit plan.
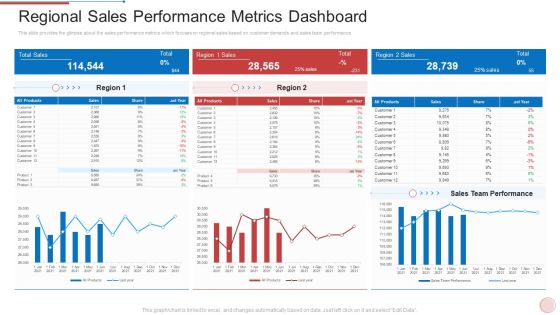
Regional Marketing Strategies Regional Sales Performance Metrics Dashboard Infographics PDF
This slide provides the glimpse about the sales performance metrics which focuses on regional sales based on customer demands and sales team performance. Deliver and pitch your topic in the best possible manner with this regional marketing strategies regional sales performance metrics dashboard infographics pdf. Use them to share invaluable insights on regional sales performance metrics dashboard and impress your audience. This template can be altered and modified as per your expectations. So, grab it now.

KPI Dashboard To Track Amazon Performance Ppt Styles Guidelines PDF
This slide provides information regarding dashboard to monitor Amazon performance. The KPIs include tracking of product sales, conversion rate, advertising spends, session, organic sales, etc. There are so many reasons you need a KPI Dashboard To Track Amazon Performance Ppt Styles Guidelines PDF. The first reason is you can not spend time making everything from scratch, Thus, Slidegeeks has made presentation templates for you too. You can easily download these templates from our website easily.
Monthly Sales Report Performance Monitoring Dashboard Icon Infographics PDF
This is a Monthly Sales Report Performance Monitoring Dashboard Icon Infographics PDF template with various stages. Focus and dispense information on four stages using this creative set, that comes with editable features. It contains large content boxes to add your information on topics like Monthly Sales, Dashboard Icon, Report Performance. You can also showcase facts, figures, and other relevant content using this PPT layout. Grab it now.
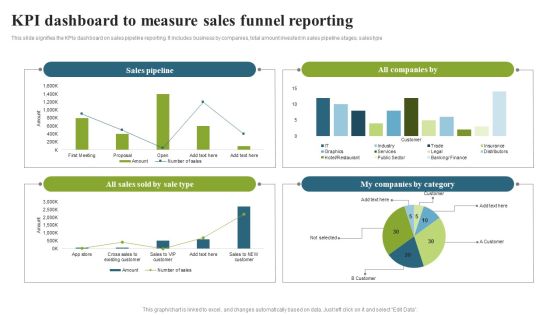
KPI Dashboard To Measure Sales Funnel Reporting Template PDF
This slide signifies the KPIs dashboard on sales pipeline reporting. It includes business by companies, total amount invested in sales pipeline stages, sales type. Showcasing this set of slides titled KPI Dashboard To Measure Sales Funnel Reporting Template PDF. The topics addressed in these templates are Sales Pipeline, Companies Category, Sales Sold. All the content presented in this PPT design is completely editable. Download it and make adjustments in color, background, font etc. as per your unique business setting.

Analyzing And Deploying HR Analytics Software Kpi Dashboard Information PDF
This slide shows the dashboard representing data related to human resource operations of the enterprise. It includes key metrics such as vacant positions, YTD personal expenses etc. There are so many reasons you need a Analyzing And Deploying HR Analytics Software Kpi Dashboard Information PDF. The first reason is you cant spend time making everything from scratch, Thus, Slidegeeks has made presentation templates for you too. You can easily download these templates from our website easily.
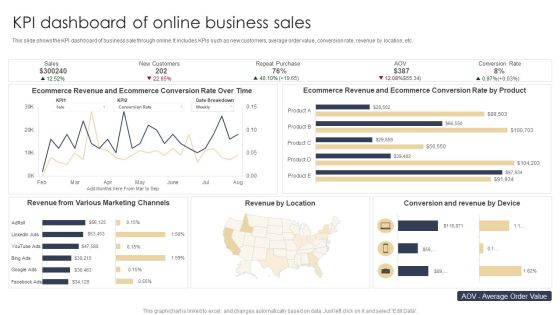
KPI Dashboard Of Online Business Sales Microsoft PDF
This slide shows the KPI dashboard of business sale through online. It includes KPIs such as new customers, average order value, conversion rate, revenue by location, etc. Showcasing this set of slides titled KPI Dashboard Of Online Business Sales Microsoft PDF. The topics addressed in these templates are Marketing Channels, Revenue, Location. All the content presented in this PPT design is completely editable. Download it and make adjustments in color, background, font etc. as per your unique business setting.

Vendor Performance KPI Dashboard For Distribution Business Formats PDF
This slide exhibits monthly performance dashboard for distribution businesses to track their suppliers and reduce the chance of major disruptions. It includes key elements such as cost per drop, purchase trend, top items, top suppliers, etc. Showcasing this set of slides titled Vendor Performance KPI Dashboard For Distribution Business Formats PDF. The topics addressed in these templates are Purchase Trend, Suppliers, Distribution Business. All the content presented in this PPT design is completely editable. Download it and make adjustments in color, background, font etc. as per your unique business setting.
Market Penetration Dashboard With Sales Metrics Ppt Icon Examples PDF
This slide shows market penetration dashboard for sales team. It provides information about regions, emerging markets, planned sales, actual sales, revenue, gender wise sales, etc. Pitch your topic with ease and precision using this Market Penetration Dashboard With Sales Metrics Ppt Icon Examples PDF. This layout presents information on Emerging Markets, Sales Gender, Actual Sales. It is also available for immediate download and adjustment. So, changes can be made in the color, design, graphics or any other component to create a unique layout.
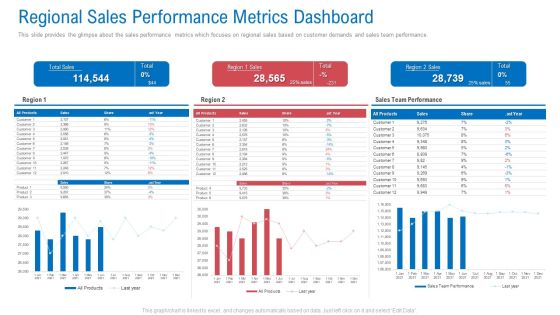
Regional Marketing Planning Regional Sales Performance Metrics Dashboard Information PDF
This slide provides the glimpse about the sales performance metrics which focuses on regional sales based on customer demands and sales team performance. Deliver an awe inspiring pitch with this creative regional marketing planning regional sales performance metrics dashboard information pdf bundle. Topics like regional sales performance metrics dashboard can be discussed with this completely editable template. It is available for immediate download depending on the needs and requirements of the user.
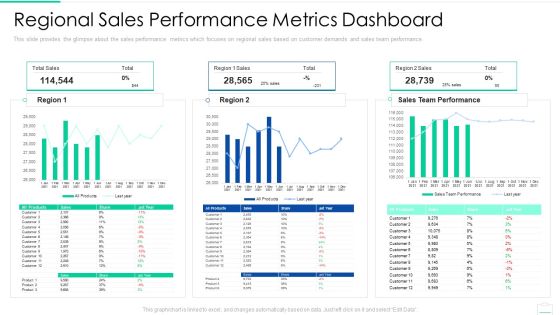
Market Area Analysis Regional Sales Performance Metrics Dashboard Designs PDF
This slide provides the glimpse about the sales performance metrics which focuses on regional sales based on customer demands and sales team performance. Deliver and pitch your topic in the best possible manner with this market area analysis regional sales performance metrics dashboard designs pdf. Use them to share invaluable insights on regional sales performance metrics dashboard and impress your audience. This template can be altered and modified as per your expectations. So, grab it now.

B2B Sales Representative Insights Dashboard Ppt Icon PDF
This slide covers the sales reps dashboard wherein teams contribution to leads, managing SQLs and revenue targets are evaluated.Deliver an awe-inspiring pitch with this creative B2B sales representative insights dashboard ppt icon pdf. bundle. Topics like sales representatives leads actual, sales representatives revenue actual, revenue pace can be discussed with this completely editable template. It is available for immediate download depending on the needs and requirements of the user.

B2B Sales Representative Insights Dashboard Ppt Summary PDF
This slide covers the sales reps dashboard wherein teams contribution to leads, managing SQLs and revenue targets are evaluated.Deliver an awe-inspiring pitch with this creative B2B sales representative insights dashboard ppt summary pdf. bundle. Topics like sales representatives leads actual, sales representatives revenue actual, revenue pace can be discussed with this completely editable template. It is available for immediate download depending on the needs and requirements of the user.
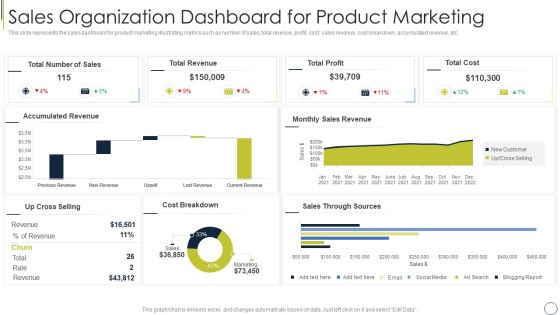
Sales Organization Dashboard For Product Marketing Themes PDF
This slide represents the sales dashboard for product marketing illustrating metrics such as number of sales, total revenue, profit, cost, sales revenue, cost breakdown, accumulated revenue, etc. Pitch your topic with ease and precision using this sales organization dashboard for product marketing themes pdf. This layout presents information on total cost, total profit, total revenue. It is also available for immediate download and adjustment. So, changes can be made in the color, design, graphics or any other component to create a unique layout.

Digital Dashboard Indicating Insurance Agent Sales Performance Portrait PDF
This slide illustrates insurance agent sales performance digital dashboard. It provides information about total proposals, policies, accident, claims, sales revenue, rewards, etc. Pitch your topic with ease and precision using this Digital Dashboard Indicating Insurance Agent Sales Performance Portrait PDF. This layout presents information on Sales Revenue, Reward And Recognition. It is also available for immediate download and adjustment. So, changes can be made in the color, design, graphics or any other component to create a unique layout.

Sales Timeframe And Performance Management Dashboard Introduction PDF
The slide highlight the sales timeline and performance management dashboard illustrating regional market share, sales timeline, regional margin and category margin. Pitch your topic with ease and precision using this Sales Timeframe And Performance Management Dashboard Introduction PDF. This layout presents information on Regional Market Share, Category Margin, Sales Timeline. It is also available for immediate download and adjustment. So, changes can be made in the color, design, graphics or any other component to create a unique layout.
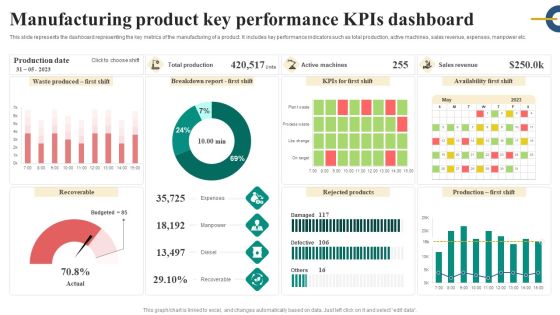
Manufacturing Product Key Performance Kpis Dashboard Inspiration PDF
This slide represents the dashboard representing the key metrics of the manufacturing of a product. It includes key performance indicators such as total production, active machines, sales revenue, expenses, manpower etc. Showcasing this set of slides titled Manufacturing Product Key Performance Kpis Dashboard Inspiration PDF. The topics addressed in these templates are Expenses, Manpower, Diesel, Recoverable. All the content presented in this PPT design is completely editable. Download it and make adjustments in color, background, font etc. as per your unique business setting.

Product USP Sales Dashboard Ppt Inspiration Background Designs PDF
Show your highlights of sale through our dashboard. Deliver and pitch your topic in the best possible manner with this product usp sales dashboard ppt inspiration background designs pdf. Use them to share invaluable insights on product sale comparison, products in revenue, cost of goods sold and impress your audience. This template can be altered and modified as per your expectations. So, grab it now.
Five Years Sales Projection And Analysis Dashboard Icons PDF
This slide defines the dashboard for five years sales forecast and analysis . It includes information related to the estimated and actual sales. Pitch your topic with ease and precision using this Five Years Sales Projection And Analysis Dashboard Icons PDF. This layout presents information on Forecast Value, Forecast Accuracy, Won Opportunities. It is also available for immediate download and adjustment. So, changes can be made in the color, design, graphics or any other component to create a unique layout.

Dashboard For Pharmaceutical Device Sales Performance Graphics PDF
This slide showcases sales performance dashboard od medical instruments. It includes elements such as the shipping information, order information and payment information. Showcasing this set of slides titled Dashboard For Pharmaceutical Device Sales Performance Graphics PDF. The topics addressed in these templates are Pharmaceutical Device, Sales Performance. All the content presented in this PPT design is completely editable. Download it and make adjustments in color, background, font etc. as per your unique business setting.

Smartphone Sales Dashboard Ppt Infographics Graphic Tips PDF
This slide shows the dashboard related to smartphone market overview, revenue and sales of the company with top smartphones with their details. Deliver an awe inspiring pitch with this creative smartphone sales dashboard ppt infographics graphic tips pdf bundle. Topics like management overview, profit margin, total revenue, net profit can be discussed with this completely editable template. It is available for immediate download depending on the needs and requirements of the user.

Dashboard Showing Effective Management Of Sales Pipeline Rules PDF
This slide shows the process steps followed by the company for the recruitment of new employees. It stars from Identifying the hiring needs and ends with employment offer. Deliver an awe inspiring pitch with this creative Dashboard Showing Effective Management Of Sales Pipeline Rules PDF bundle. Topics like Dashboard Showing Effective Management Of Sales Pipeline can be discussed with this completely editable template. It is available for immediate download depending on the needs and requirements of the user.
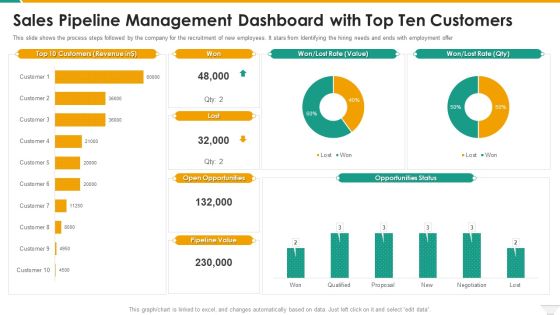
Sales Pipeline Management Dashboard With Top Ten Customers Microsoft PDF
This slide shows the process steps followed by the company for the recruitment of new employees. It stars from Identifying the hiring needs and ends with employment offer. Deliver an awe inspiring pitch with this creative Sales Pipeline Management Dashboard With Top Ten Customers Microsoft PDF bundle. Topics like Sales Pipeline Management Dashboard With Top Ten Customers can be discussed with this completely editable template. It is available for immediate download depending on the needs and requirements of the user.
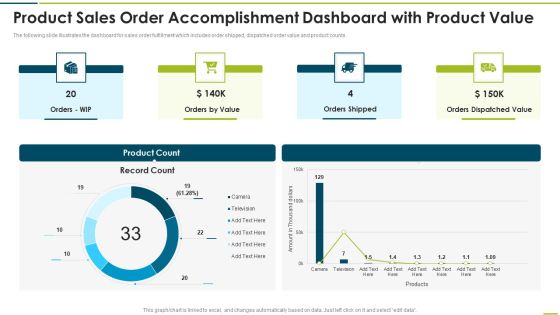
Product Sales Order Accomplishment Dashboard With Product Value Themes PDF
The following slide illustrates the dashboard for sales order fulfillment which includes order shipped, dispatched order value and product counts.Pitch your topic with ease and precision using this Product Sales Order Accomplishment Dashboard With Product Value Themes PDF This layout presents information on Orders Shipped, Dispatched Value, Orders Value It is also available for immediate download and adjustment. So, changes can be made in the color, design, graphics or any other component to create a unique layout.

B2B Sales Representatives Performance Tracking Dashboard Background PDF
This slide provides information regarding B2B sales representatives performance tracking dashboard to measure leads by region, revenue breakdown, top performers by leads, revenues, etc. Deliver and pitch your topic in the best possible manner with this B2B Sales Representatives Performance Tracking Dashboard Background PDF. Use them to share invaluable insights on Individual Performance, Achieved Highest, Revenue Relative and impress your audience. This template can be altered and modified as per your expectations. So, grab it now.

Weekly Sales Performance KPI Dashboard For Revenue Generation Brochure PDF
The following slide exhibits dashboard to maintain revenue and management under control. It presents information related to profits, cross selling, costs, etc. Pitch your topic with ease and precision using this Weekly Sales Performance KPI Dashboard For Revenue Generation Brochure PDF. This layout presents information on Total Sales, Revenue, Profit, Cost. It is also available for immediate download and adjustment. So, changes can be made in the color, design, graphics or any other component to create a unique layout.

Icon For Sales Team Customer Relationship Management Dashboard Diagrams PDF
Persuade your audience using this Icon For Sales Team Customer Relationship Management Dashboard Diagrams PDF. This PPT design covers three stages, thus making it a great tool to use. It also caters to a variety of topics including Icon Sales Team Customer, Relationship Management Dashboard. Download this PPT design now to present a convincing pitch that not only emphasizes the topic but also showcases your presentation skills.
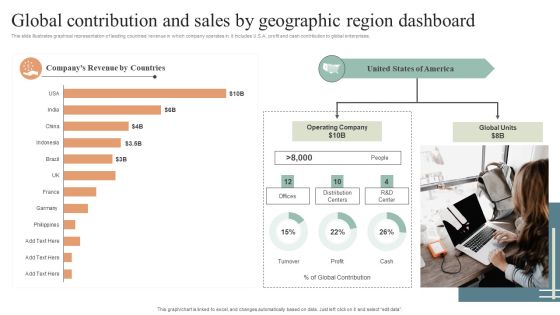
Global Contribution And Sales By Geographic Region Dashboard Diagrams PDF
This slide illustrates graphical representation of leading countries revenue in which company operates in. it includes U.S.A. profit and cash contribution to global enterprises. Pitch your topic with ease and precision using this Global Contribution And Sales By Geographic Region Dashboard Diagrams PDF. This layout presents information on Global Contribution, Sales By Geographic, Region Dashboard. It is also available for immediate download and adjustment. So, changes can be made in the color, design, graphics or any other component to create a unique layout.

Information Security Risk Evaluation Dashboard For Data Privacy Introduction PDF
This slide depicts the risk evaluation dashboard for data privacy based on audits with open findings, GDPR processing per region, control and measure trends, average response time. There are so many reasons you need a Information Security Risk Evaluation Dashboard For Data Privacy Introduction PDF. The first reason is you can not spend time making everything from scratch, Thus, Slidegeeks has made presentation templates for you too. You can easily download these templates from our website easily.
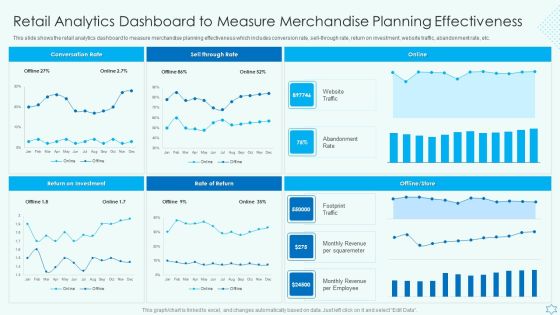
Retail Analytics Dashboard To Measure Merchandise Planning Effectiveness Diagrams PDF
This slide shows the retail analytics dashboard to measure merchandise planning effectiveness which includes conversion rate, sell through rate, return on investment, website traffic, abandonment rate, etc. Are you searching for a Retail Analytics Dashboard To Measure Merchandise Planning Effectiveness Diagrams PDF that is uncluttered, straightforward, and original Its easy to edit, and you can change the colors to suit your personal or business branding. For a presentation that expresses how much effort you have put in, this template is ideal With all of its features, including tables, diagrams, statistics, and lists, its perfect for a business plan presentation. Make your ideas more appealing with these professional slides. Download Retail Analytics Dashboard To Measure Merchandise Planning Effectiveness Diagrams PDF from Slidegeeks today.

B2B Cost Per Lead Dashboard Ppt Gallery Themes PDF
This slide covers the cost per lead dashboard focusing on leads, MQL, SQL, customers, revenues goal and total media spend.Deliver and pitch your topic in the best possible manner with this B2B cost per lead dashboard ppt gallery themes pdf. Use them to share invaluable insights on revenue goal, total media spend and impress your audience. This template can be altered and modified as per your expectations. So, grab it now.
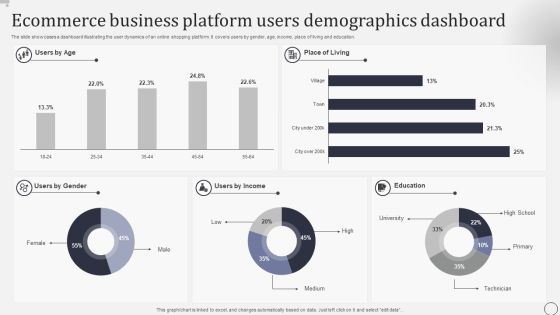
Ecommerce Business Platform Users Demographics Dashboard Rules PDF
The slide showcases a dashboard illustrating the user dynamics of an online shopping platform. It covers users by gender, age, income, place of living and education. Showcasing this set of slides titled Ecommerce Business Platform Users Demographics Dashboard Rules PDF.. The topics addressed in these templates are Users Gender, Users Income, Education. All the content presented in this PPT design is completely editable. Download it and make adjustments in color, background, font etc. as per your unique business setting.

Corporate Governance Impact Assessment Dashboard Ppt Summary Guidelines PDF
This slide provides information regarding dashboard to track impact of corporate governance initiatives on society, community by handling data quality, communities supported such as women and girls, children and youth, etc. There are so many reasons you need a Corporate Governance Impact Assessment Dashboard Ppt Summary Guidelines PDF. The first reason is you can not spend time making everything from scratch, Thus, Slidegeeks has made presentation templates for you too. You can easily download these templates from our website easily.

Corporate Governance Impact Assessment Dashboard Ppt Guide PDF
This slide provides information regarding dashboard to track impact of corporate governance initiatives on society, community by handling data quality, communities supported such as women and girls, children and youth, etc. There are so many reasons you need a Corporate Governance Impact Assessment Dashboard Ppt Guide PDF. The first reason is you can not spend time making everything from scratch, Thus, Slidegeeks has made presentation templates for you too. You can easily download these templates from our website easily.

Monthly Social Media Dashboard Ppt PowerPoint Presentation Model Slide
This is a monthly social media dashboard ppt powerpoint presentation model slide. This is a four stage process. The stages in this process are sales, social events, business, finance, key social metrics.
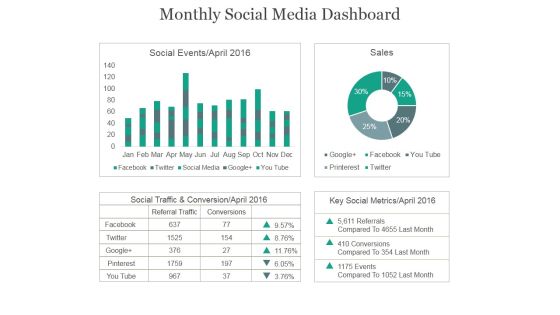
Monthly Social Media Dashboard Ppt PowerPoint Presentation Example 2015
This is a monthly social media dashboard ppt powerpoint presentation example 2015. This is a four stage process. The stages in this process are social events, sales, social traffic, conservation, key social metrics.
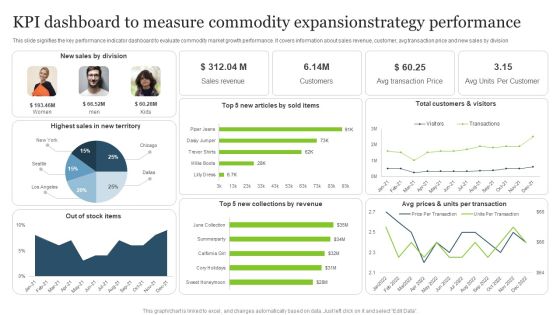
KPI Dashboard To Measure Commodity Expansionstrategy Performance Mockup PDF
This slide signifies the key performance indicator dashboard to evaluate commodity market growth performance. It covers information about sales revenue, customer, avg transaction price and new sales by division.Showcasing this set of slides titled KPI Dashboard To Measure Commodity Expansionstrategy Performance Mockup PDF. The topics addressed in these templates are Highest Sales, Sales Division, New Collections. All the content presented in this PPT design is completely editable. Download it and make adjustments in color, background, font etc. as per your unique business setting.

Marketing And Operations Dashboard To Analyze Performance Infographics PDF
This slide covers sales and operation dashboard to analyze performance. It involves sales, revenue, profit, sale size and monthly productivity. Showcasing this set of slides titled Marketing And Operations Dashboard To Analyze Performance Infographics PDF. The topics addressed in these templates are Monthly Productivity, Sales, Revenue. All the content presented in this PPT design is completely editable. Download it and make adjustments in color, background, font etc. as per your unique business setting.

Google Adwords Strategic Campaign Dashboard For Marketing Department Download PDF
This slide showcases KPI dashboard for real time tracking google adwords campaign metrics. It includes key elements such as impressions, clicks, costs, spend, etc. Pitch your topic with ease and precision using this Google Adwords Strategic Campaign Dashboard For Marketing Department Download PDF. This layout presents information on Impressions, Clicks, Costs. It is also available for immediate download and adjustment. So, changes can be made in the color, design, graphics or any other component to create a unique layout.
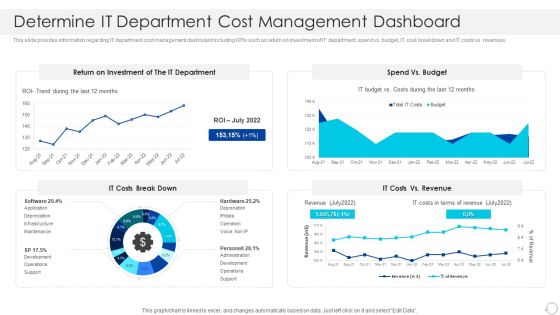
Determine IT Department Cost Management Dashboard Graphics PDF
This slide provides information regarding IT department cost management dashboard including KPIs such as return on investment of IT department, spend vs. budget, IT cost breakdown and IT costs vs. revenues. Deliver and pitch your topic in the best possible manner with this Determine IT Department Cost Management Dashboard Graphics PDF. Use them to share invaluable insights on Investment, Budget, Revenue and impress your audience. This template can be altered and modified as per your expectations. So, grab it now.
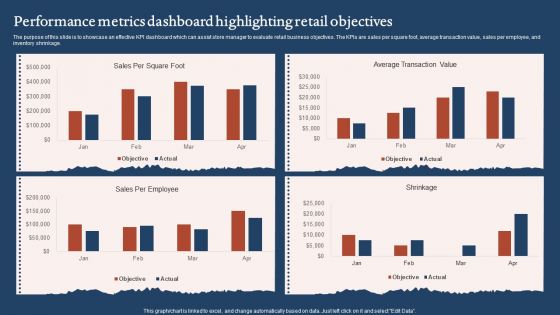
Performance Metrics Dashboard Highlighting Retail Objectives Sample PDF
The purpose of this slide is to showcase an effective KPI dashboard which can assist store manager to evaluate retail business objectives. The KPIs are sales per square foot, average transaction value, sales per employee, and inventory shrinkage. Pitch your topic with ease and precision using this Performance Metrics Dashboard Highlighting Retail Objectives Sample PDF. This layout presents information on Average Transaction Value, Sales Per Employee. It is also available for immediate download and adjustment. So, changes can be made in the color, design, graphics or any other component to create a unique layout.

Performance Strategic Analysis Dashboard For Tactical Management Rules PDF
This slide defines the dashboard for analyzing the sales key performance indicators KPIs. It includes information related to the number of sales, revenue, profit, and cost. Showcasing this set of slides titled Performance Strategic Analysis Dashboard For Tactical Management Rules PDF. The topics addressed in these templates are Revenue, New Customers, Average Revenue, Per Customer. All the content presented in this PPT design is completely editable. Download it and make adjustments in color, background, font etc. as per your unique business setting.

Retail Analytics Dashboard To Measure Merchandise Planning Effectiveness Microsoft PDF
This slide shows the retail analytics dashboard to measure merchandise planning effectiveness which includes conversion rate, sell through rate, return on investment, website traffic, abandonment rate, etc. Make sure to capture your audiences attention in your business displays with our gratis customizable Retail Analytics Dashboard To Measure Merchandise Planning Effectiveness Microsoft PDF. These are great for business strategies, office conferences, capital raising or task suggestions. If you desire to acquire more customers for your tech business and ensure they stay satisfied, create your own sales presentation with these plain slides.
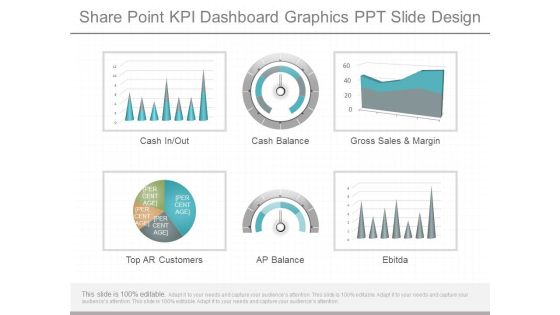
Share Point Kpi Dashboard Graphics Ppt Slide Design
This is a share point kpi dashboard graphics ppt slide design. This is a six stage process. The stages in this process are cash in out, cash balance, gross sales and margin, top ar customers, ap balance, ebitda.

Team Member Professional Skills Dashboard Powerpoint Slide Backgrounds
This is a team member professional skills dashboard powerpoint slide backgrounds. This is a one stage process. The stages in this process are personal skills, sales marketing, business, management, presentation.

Commercial Property Development Vendor Supplier Analysis Dashboard Download PDF
Here in this slide we include dashboard covering supplier order value, defect rate, and quality score for making decisions regarding supplier selection. Deliver an awe inspiring pitch with this creative commercial property development vendor supplier analysis dashboard download pdf bundle. Topics like value ordered, value rejected, vendor rejection rate, spend under management can be discussed with this completely editable template. It is available for immediate download depending on the needs and requirements of the user.
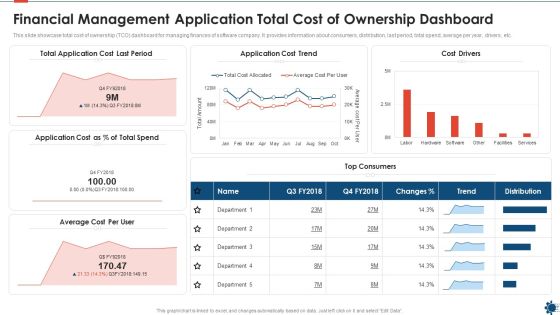
Financial Management Application Total Cost Of Ownership Dashboard Infographics PDF
This slide showcase total cost of ownership TCO dashboard for managing finances of software company. It provides information about consumers, distribution, last period, total spend, average per year, drivers, etc. Showcasing this set of slides titled financial management application total cost of ownership dashboard infographics pdf. The topics addressed in these templates are cost, application. All the content presented in this PPT design is completely editable. Download it and make adjustments in color, background, font etc. as per your unique business setting.
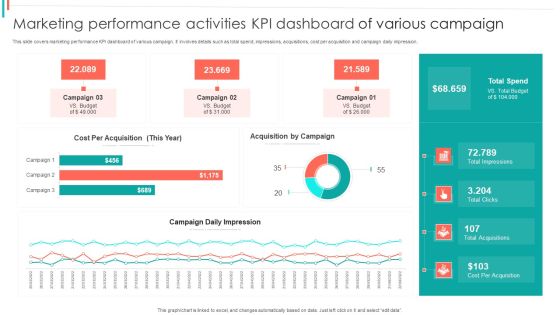
Marketing Performance Activities KPI Dashboard Of Various Campaign Microsoft PDF
This slide covers marketing performance KPI dashboard of various campaign. It involves details such as total spend, impressions, acquisitions, cost per acquisition and campaign daily impression.Showcasing this set of slides titled Marketing Performance Activities KPI Dashboard Of Various Campaign Microsoft PDF. The topics addressed in these templates are Acquisition Campaign, Campaign Impression, Total Impressions. All the content presented in this PPT design is completely editable. Download it and make adjustments in color, background, font etc. as per your unique business setting.

PPC Marketing Activities KPI Dashboard To Improve Efficiency Diagrams PDF
This slide covers PPC marketing dashboard to improve efficiency. It involves total spends, number of clicks, cost per conversion, change in conversion rate and cost per thousand impression.Showcasing this set of slides titled PPC Marketing Activities KPI Dashboard To Improve Efficiency Diagrams PDF. The topics addressed in these templates are Per Conversion, Advertisement Impression, Impressions. All the content presented in this PPT design is completely editable. Download it and make adjustments in color, background, font etc. as per your unique business setting.

Dashboard For Monitoring Snapchat Marketing Performance Slides PDF
This slide shows dashboard for monitoring Snapchat marketing performance. It provides details about ad spends, impressions, cost per thousand eCPM, swipe ups, campaign, delivery status, budget, goal, bid, etc. Deliver and pitch your topic in the best possible manner with this Dashboard For Monitoring Snapchat Marketing Performance Slides PDF. Use them to share invaluable insights on Goal, Lifetime Budget, Monitoring Snapchat Marketing Performance and impress your audience. This template can be altered and modified as per your expectations. So, grab it now.
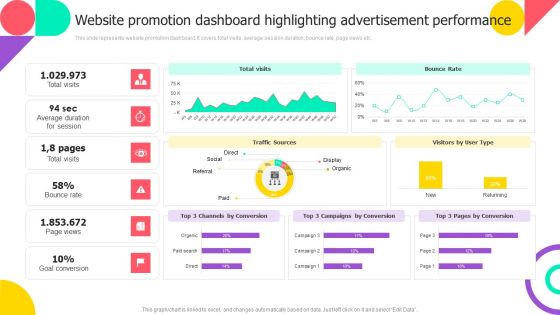
Website Promotion Dashboard Highlighting Advertisement Performance Portrait PDF
This slide represents website promotion dashboard. It covers total visits, average session duration, bounce rate, page views etc. There are so many reasons you need a Website Promotion Dashboard Highlighting Advertisement Performance Portrait PDF. The first reason is you can not spend time making everything from scratch, Thus, Slidegeeks has made presentation templates for you too. You can easily download these templates from our website easily.

Deploying And Managing Recurring Business Performance Dashboard Sample PDF
The following slide display a business performance dashboard that highlights the average revenue per unit, customer Acquisition Cost and profit earned. There are so many reasons you need a Deploying And Managing Recurring Business Performance Dashboard Sample PDF. The first reason is you cant spend time making everything from scratch, Thus, Slidegeeks has made presentation templates for you too. You can easily download these templates from our website easily.
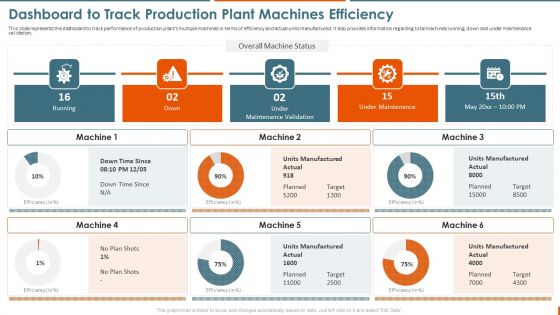
Maintenance Administration Dashboard To Track Production Plant Machines Ideas PDF
This slide represents the dashboard to track performance of production plants multiple machines in terms of efficiency and actual units manufactured. It also provides information regarding total machines running, down and under maintenance validation. There are so many reasons you need a Maintenance Administration Dashboard To Track Production Plant Machines Ideas PDF. The first reason is you cant spend time making everything from scratch, Thus, Slidegeeks has made presentation templates for you too. You can easily download these templates from our website easily.

Membership Based Revenue Plan Business Performance Dashboard Ideas PDF
The following slide display a business performance dashboard that highlights the average revenue per unit, customer Acquisition Cost and profit earned. There are so many reasons you need a Membership Based Revenue Plan Business Performance Dashboard Ideas PDF. The first reason is you cant spend time making everything from scratch, Thus, Slidegeeks has made presentation templates for you too. You can easily download these templates from our website easily.

Comparative Analysis Dashboard For Google Adwords Strategic Campaign Slides PDF
This slide displays dashboard to compare performance of google adwords with other social media marketing campaigns. It includes information about spend, conversations, cost per acquisition, etc. Showcasing this set of slides titled Comparative Analysis Dashboard For Google Adwords Strategic Campaign Slides PDF. The topics addressed in these templates are Google Ads, Cost, Conversions. All the content presented in this PPT design is completely editable. Download it and make adjustments in color, background, font etc. as per your unique business setting.
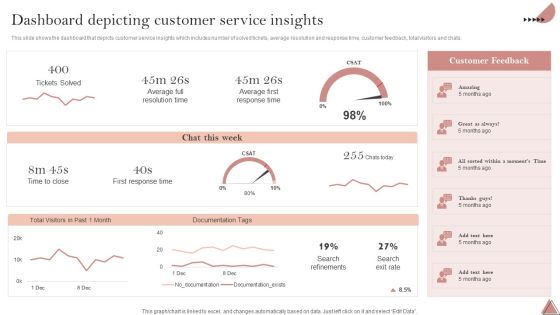
Enhancing Client Engagement Dashboard Depicting Customer Service Insights Structure PDF
This slide shows the dashboard that depicts customer service insights which includes number of solved tickets, average resolution and response time, customer feedback, total visitors and chats. There are so many reasons you need a Enhancing Client Engagement Dashboard Depicting Customer Service Insights Structure PDF. The first reason is you cant spend time making everything from scratch, Thus, Slidegeeks has made presentation templates for you too. You can easily download these templates from our website easily.

 Home
Home