Procurement Dashboard
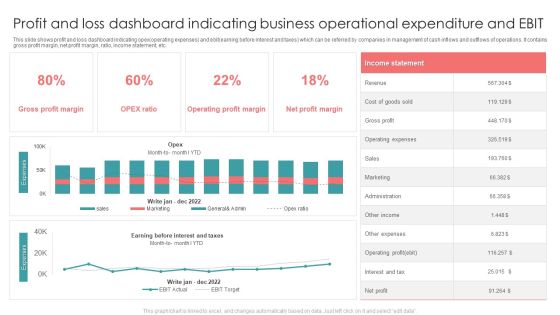
Profit And Loss Dashboard Indicating Business Operational Expenditure And EBIT Formats PDF
This slide shows profit and loss dashboard indicating opex operating expenses and ebit earning before interest and taxes which can be referred by companies in management of cash inflows and outflows of operations. It contains gross profit margin, net profit margin, ratio, income statement, etc. Showcasing this set of slides titled Profit And Loss Dashboard Indicating Business Operational Expenditure And EBIT Formats PDF. The topics addressed in these templates are Revenue, Gross Profit, Sales. All the content presented in this PPT design is completely editable. Download it and make adjustments in color, background, font etc. as per your unique business setting.
HR Induction Dashboard Highlighting Employee Headcount And Turnover Ratio Icons PDF
This slide highlights the HR induction dashboard which includes average salary, headcount, turnover rate, employees hired and employees left rate, average age with employment contract and status. Make sure to capture your audiences attention in your business displays with our gratis customizable HR Induction Dashboard Highlighting Employee Headcount And Turnover Ratio Icons PDF. These are great for business strategies, office conferences, capital raising or task suggestions. If you desire to acquire more customers for your tech business and ensure they stay satisfied, create your own sales presentation with these plain slides.

KPI Dashboard To Track Process Products Sold By Insurance Topics PDF
This slide shows dashboard which can be used to compare insurance sales of current and previous year. It includes metrics such as monthly policy status, quarterly premium revenue, overall policy status, etc. Pitch your topic with ease and precision using this KPI Dashboard To Track Process Products Sold By Insurance Topics PDF. This layout presents information on Overall Policy Status, Quarterly Premium Revenue, Monthly Policy Status. It is also available for immediate download and adjustment. So, changes can be made in the color, design, graphics or any other component to create a unique layout.
KPI Dashboard For Tracking Supply Chain Costs Industry Analysis Of Food Formats PDF
This slide represents the KPI dashboard to track the multiple cost associated with supply chain in food manufacturing industry. It includes information regarding cash to cash cycle in days, carry cost of inventory along with details of net sales.Find a pre-designed and impeccable KPI Dashboard For Tracking Supply Chain Costs Industry Analysis Of Food Formats PDF. The templates can ace your presentation without additional effort. You can download these easy-to-edit presentation templates to make your presentation stand out from others. So, what are you waiting for Download the template from Slidegeeks today and give a unique touch to your presentation.
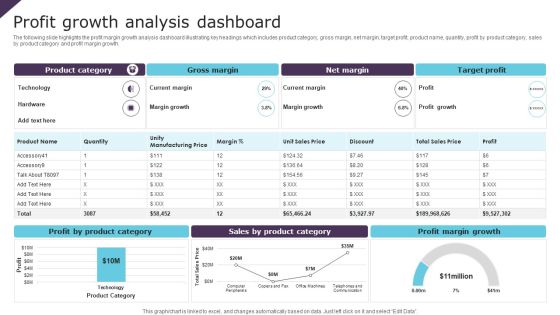
Profit Growth Analysis Dashboard Ppt PowerPoint Presentation File Design Templates PDF
The following slide highlights the profit margin growth analysis dashboard illustrating key headings which includes product category, gross margin, net margin, target profit, product name, quantity, profit by product category, sales by product category and profit margin growth. Showcasing this set of slides titled Profit Growth Analysis Dashboard Ppt PowerPoint Presentation File Design Templates PDF. The topics addressed in these templates are Gross Margin, Net Margin, Target Profit. All the content presented in this PPT design is completely editable. Download it and make adjustments in color, background, font etc. as per your unique business setting.

Customer Acquisition Approaches To Enhance Organization Growth Customer Acquisition Cost Analysis Dashboard Slides PDF
This slide covers the client acquisition cost CAC measurement dashboard with metrics such as total customers, employee satisfaction rate, number of trials, monthly active users, NPS net promoter score, etc. Make sure to capture your audiences attention in your business displays with our gratis customizable Customer Acquisition Approaches To Enhance Organization Growth Customer Acquisition Cost Analysis Dashboard Slides PDF. These are great for business strategies, office conferences, capital raising or task suggestions. If you desire to acquire more customers for your tech business and ensure they stay satisfied, create your own sales presentation with these plain slides.
Efficient Administration Of Product Business And Umbrella Branding Product Branding Performance Tracking Dashboard Background PDF
This slide provides information regarding product branding performance tracking dashboard in terms of revenues, new customers, customer satisfaction rate. Make sure to capture your audiences attention in your business displays with our gratis customizable Efficient Administration Of Product Business And Umbrella Branding Product Branding Performance Tracking Dashboard Background PDF. These are great for business strategies, office conferences, capital raising or task suggestions. If you desire to acquire more customers for your tech business and ensure they stay satisfied, create your own sales presentation with these plain slides.
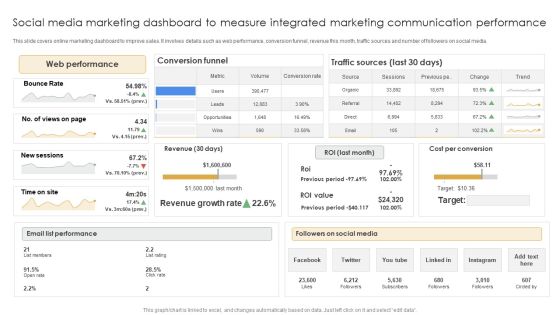
Social Media Marketing Dashboard To Measure Integrated Marketing Communication Performance Clipart PDF
This slide covers online marketing dashboard to improve sales. It involves details such as web performance, conversion funnel, revenue this month, traffic sources and number of followers on social media. Pitch your topic with ease and precision using this Social Media Marketing Dashboard To Measure Integrated Marketing Communication Performance Clipart PDF. This layout presents information on Web Performance, Email List Performance, Followers Social Media. It is also available for immediate download and adjustment. So, changes can be made in the color, design, graphics or any other component to create a unique layout.

Strategic FM Services Facilities Management Dashboard Highlighting Organization Power Consumption Brochure PDF
This slide highlights the dashboard for facilities management which includes HVAC, lighting, power, water, electricity, monthly consumption chart, occupancy rate, and service requests. Make sure to capture your audiences attention in your business displays with our gratis customizable Strategic FM Services Facilities Management Dashboard Highlighting Organization Power Consumption Brochure PDF. These are great for business strategies, office conferences, capital raising or task suggestions. If you desire to acquire more customers for your tech business and ensure they stay satisfied, create your own sales presentation with these plain slides.

Smart Manufacturing Deployment Improve Production Procedures Smart Manufacturing Dashboard Summary PDF
This slide represents smart manufacturing dashboard for inventory management. It includes inventory carrying cost, inventory turnover, inventory to sales ratio etc.Slidegeeks has constructed Smart Manufacturing Deployment Improve Production Procedures Smart Manufacturing Dashboard Summary PDF after conducting extensive research and examination. These presentation templates are constantly being generated and modified based on user preferences and critiques from editors. Here, you will find the most attractive templates for a range of purposes while taking into account ratings and remarks from users regarding the content. This is an excellent jumping-off point to explore our content and will give new users an insight into our top-notch PowerPoint Templates.

Deployment Of Automated Production Technology Smart Manufacturing Dashboard For Inventory Management Brochure PDF
This slide represents smart manufacturing dashboard for inventory management. It includes inventory carrying cost, inventory turnover, inventory to sales ratio etc.Welcome to our selection of the Deployment Of Automated Production Technology Smart Manufacturing Dashboard For Inventory Management Brochure PDF. These are designed to help you showcase your creativity and bring your sphere to life. Planning and Innovation are essential for any business that is just starting out. This collection contains the designs that you need for your everyday presentations. All of our PowerPoints are 100 precent editable, so you can customize them to suit your needs. This multi-purpose template can be used in various situations. Grab these presentation templates today.
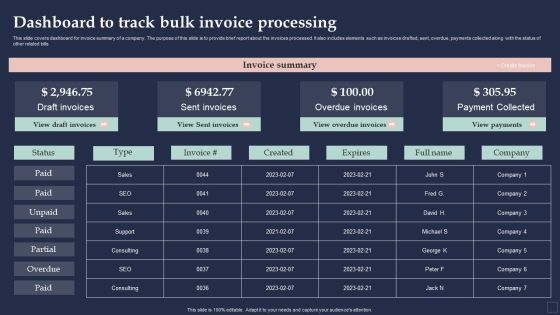
BPM System Methodology Dashboard To Track Bulk Invoice Processing Download PDF
This slide covers dashboard for invoice summary of a company. The purpose of this slide is to provide brief report about the invoices processed. It also includes elements such as invoices drafted, sent, overdue, payments collected along with the status of other related bills. Make sure to capture your audiences attention in your business displays with our gratis customizable BPM System Methodology Dashboard To Track Bulk Invoice Processing Download PDF. These are great for business strategies, office conferences, capital raising or task suggestions. If you desire to acquire more customers for your tech business and ensure they stay satisfied, create your own sales presentation with these plain slides.

System Deployment Project Customer Relationship Management Software Kpi Dashboard Rules PDF
This slide represents the dashboard showing details related to customer relationship management software. It includes details related to outbound sales, contracts closed, average contract value etc. Present like a pro with System Deployment Project Customer Relationship Management Software Kpi Dashboard Rules PDF Create beautiful presentations together with your team, using our easy-to-use presentation slides. Share your ideas in real-time and make changes on the fly by downloading our templates. So whether youre in the office, on the go, or in a remote location, you can stay in sync with your team and present your ideas with confidence. With Slidegeeks presentation got a whole lot easier. Grab these presentations today.

Dashboard To Track Website And Application Traffic Gaining Competitive Advantage And Capturing Guidelines PDF
This slide showcases dashboard that can help organization to evaluate the traffic of website and application after entering into niche market. Its key elements are users, conversions, conversion by event type and engagement rate.Make sure to capture your audiences attention in your business displays with our gratis customizable Dashboard To Track Website And Application Traffic Gaining Competitive Advantage And Capturing Guidelines PDF. These are great for business strategies, office conferences, capital raising or task suggestions. If you desire to acquire more customers for your tech business and ensure they stay satisfied, create your own sales presentation with these plain slides.

B2b Ecommerce Dashboard To Track Website Performance Comprehensive Guide For Developing Sample PDF
This slide represents metric dashboard to track and analyze b2b ecommerce website performance. It covers total user visits, sales, average return per user etc.Find a pre-designed and impeccable B2b Ecommerce Dashboard To Track Website Performance Comprehensive Guide For Developing Sample PDF. The templates can ace your presentation without additional effort. You can download these easy-to-edit presentation templates to make your presentation stand out from others. So, what are you waiting for Download the template from Slidegeeks today and give a unique touch to your presentation.
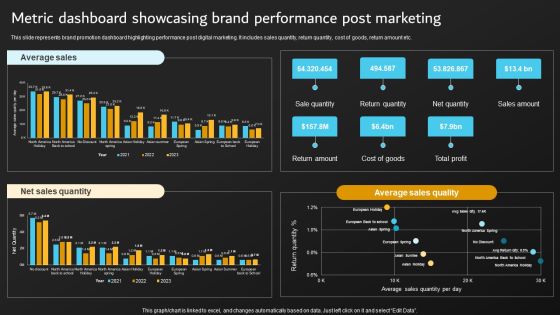
Implementation Of Digital Marketing Metric Dashboard Showcasing Brand Performance Diagrams PDF
This slide represents brand promotion dashboard highlighting performance post digital marketing. It includes sales quantity, return quantity, cost of goods, return amount etc. Slidegeeks has constructed Implementation Of Digital Marketing Metric Dashboard Showcasing Brand Performance Diagrams PDF after conducting extensive research and examination. These presentation templates are constantly being generated and modified based on user preferences and critiques from editors. Here, you will find the most attractive templates for a range of purposes while taking into account ratings and remarks from users regarding the content. This is an excellent jumping-off point to explore our content and will give new users an insight into our top-notch PowerPoint Templates.

Dashboard Highlighting CRM Ticketing Tool Operations Ppt PowerPoint Presentation File Professional PDF
This slide illustrates dashboard showcasing customer relationship management ticketing tool operations. It provides information about satisfaction, new tickets, chats, calls, invoicing, tech support, sales, engineers, replies, etc. Want to ace your presentation in front of a live audience Our Dashboard Highlighting CRM Ticketing Tool Operations Ppt PowerPoint Presentation File Professional PDF can help you do that by engaging all the users towards you. Slidegeeks experts have put their efforts and expertise into creating these impeccable powerpoint presentations so that you can communicate your ideas clearly. Moreover, all the templates are customizable, and easy to edit and downloadable. Use these for both personal and commercial use.
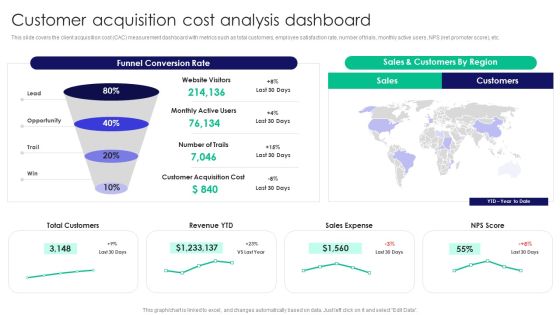
Guide To Business Customer Acquisition Customer Acquisition Cost Analysis Dashboard Download PDF
This slide covers the client acquisition cost CAC measurement dashboard with metrics such as total customers, employee satisfaction rate, number of trials, monthly active users, NPS net promoter score, etc. Make sure to capture your audiences attention in your business displays with our gratis customizable Guide To Business Customer Acquisition Customer Acquisition Cost Analysis Dashboard Download PDF. These are great for business strategies, office conferences, capital raising or task suggestions. If you desire to acquire more customers for your tech business and ensure they stay satisfied, create your own sales presentation with these plain slides.

CRM Administration To Reduce Churn Rate Dashboard Depicting Customer Retention Analytics Themes PDF
This slide shows the dashboard that depicts customer retention analytics which includes net promoter score, customer loyalty rate, customer lifetime value, customer and revenue churn, monthly recurring revenue growth, etc. Make sure to capture your audiences attention in your business displays with our gratis customizable CRM Administration To Reduce Churn Rate Dashboard Depicting Customer Retention Analytics Themes PDF. These are great for business strategies, office conferences, capital raising or task suggestions. If you desire to acquire more customers for your tech business and ensure they stay satisfied, create your own sales presentation with these plain slides.

Integrating Aiops To Enhance Process Effectiveness Customer Service Dashboard Through AI Slides PDF
The following slide highlights the customer service dashboard that shows the use of AI in customer satisfaction Slidegeeks is here to make your presentations a breeze with Integrating Aiops To Enhance Process Effectiveness Customer Service Dashboard Through AI Slides PDF With our easy-to-use and customizable templates, you can focus on delivering your ideas rather than worrying about formatting. With a variety of designs to choose from, youre sure to find one that suits your needs. And with animations and unique photos, illustrations, and fonts, you can make your presentation pop. So whether youre giving a sales pitch or presenting to the board, make sure to check out Slidegeeks first.

Introduction To Artificial Intelligence In Operation Management Industry Customer Service Dashboard Through AI Topics PDF
The following slide highlights the customer service dashboard that shows the use of AI in customer satisfaction. Slidegeeks is here to make your presentations a breeze with Introduction To Artificial Intelligence In Operation Management Industry Customer Service Dashboard Through AI Topics PDF With our easy-to-use and customizable templates, you can focus on delivering your ideas rather than worrying about formatting. With a variety of designs to choose from, you are sure to find one that suits your needs. And with animations and unique photos, illustrations, and fonts, you can make your presentation pop. So whether you are giving a sales pitch or presenting to the board, make sure to check out Slidegeeks first.

Implementing Advanced Service Help Desk Administration Program Dashboard Highlighting CRM Ticketing Tool Operations Mockup PDF
This slide illustrates dashboard showcasing customer relationship management ticketing tool operations. It provides information about satisfaction, new tickets, chats, calls, invoicing, tech support, sales, engineers, replies, etc. Want to ace your presentation in front of a live audience Our Implementing Advanced Service Help Desk Administration Program Dashboard Highlighting CRM Ticketing Tool Operations Mockup PDF can help you do that by engaging all the users towards you.. Slidegeeks experts have put their efforts and expertise into creating these impeccable powerpoint presentations so that you can communicate your ideas clearly. Moreover, all the templates are customizable, and easy-to-edit and downloadable. Use these for both personal and commercial use.

Customer Segmentation Dashboard For Market Research Ppt PowerPoint Presentation File Professional PDF
The following slide presents a customer segmentation dashboard distributing customers on demographics basis. It includes key components such as gender, technology adoption lifecycle, education and brand innovation consent. Make sure to capture your audiences attention in your business displays with our gratis customizable Customer Segmentation Dashboard For Market Research Ppt PowerPoint Presentation File Professional PDF. These are great for business strategies, office conferences, capital raising or task suggestions. If you desire to acquire more customers for your tech business and ensure they stay satisfied, create your own sales presentation with these plain slides.
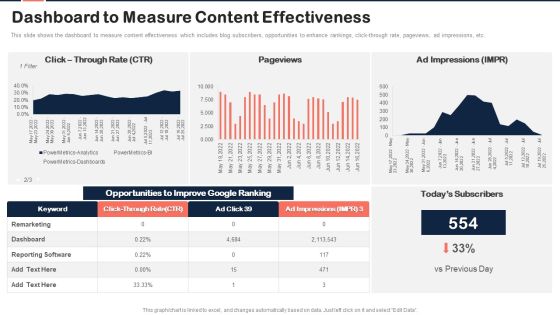
Implementing Content Marketing Plan To Nurture Leads Dashboard To Measure Content Effectiveness Summary PDF
This slide shows the dashboard to measure content effectiveness which includes blog subscribers, opportunities to enhance rankings, click through rate, pageviews, ad impressions, etc. Make sure to capture your audiences attention in your business displays with our gratis customizable Implementing Content Marketing Plan To Nurture Leads Dashboard To Measure Content Effectiveness Summary PDF. These are great for business strategies, office conferences, capital raising or task suggestions. If you desire to acquire more customers for your tech business and ensure they stay satisfied, create your own sales presentation with these plain slides.
Latest Methodologies Of Construction Ongoing Construction Project Progress Tracking Dashboard Formats PDF
This slide provides information regarding ongoing construction project progress tracking dashboard along with details such as project status, project type, project progress, etc. Make sure to capture your audiences attention in your business displays with our gratis customizable Latest Methodologies Of Construction Ongoing Construction Project Progress Tracking Dashboard Formats PDF. These are great for business strategies, office conferences, capital raising or task suggestions. If you desire to acquire more customers for your tech business and ensure they stay satisfied, create your own sales presentation with these plain slides.
Nft Transaction Analysis And Tracking Dashboard Ppt PowerPoint Presentation File Layouts PDF
This slide demonstrates the dashboard for tracking NFT transactions and analysis based on daily sales, ETH volume collections, and so on. Present like a pro with Nft Transaction Analysis And Tracking Dashboard Ppt PowerPoint Presentation File Layouts PDF Create beautiful presentations together with your team, using our easy to use presentation slides. Share your ideas in real time and make changes on the fly by downloading our templates. So whether you are in the office, on the go, or in a remote location, you can stay in sync with your team and present your ideas with confidence. With Slidegeeks presentation got a whole lot easier. Grab these presentations today.
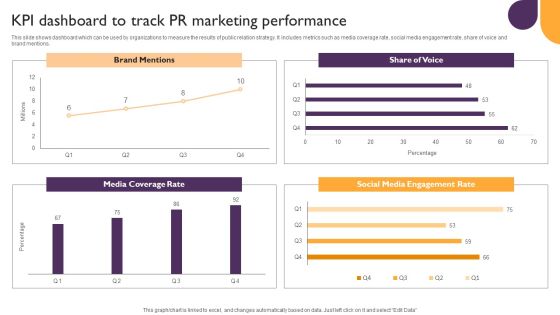
Public Relations Guide To Enhance Brand Credibility KPI Dashboard To Track PR Marketing Performance Diagrams PDF
This slide shows dashboard which can be used by organizations to measure the results of public relation strategy. It includes metrics such as media coverage rate, social media engagement rate, share of voice and brand mentions. Make sure to capture your audiences attention in your business displays with our gratis customizable Public Relations Guide To Enhance Brand Credibility KPI Dashboard To Track PR Marketing Performance Diagrams PDF. These are great for business strategies, office conferences, capital raising or task suggestions. If you desire to acquire more customers for your tech business and ensure they stay satisfied, create your own sales presentation with these plain slides.
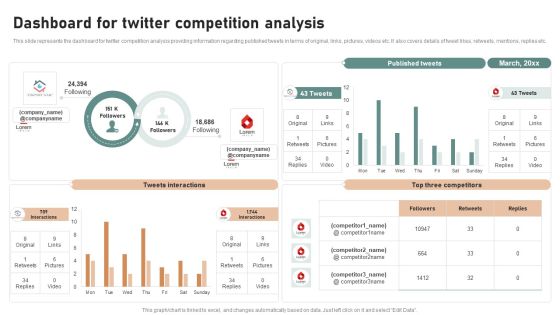
Utilizing Twitter For Social Media Dashboard For Twitter Competition Analysis Structure PDF
This slide represents the dashboard for twitter competition analysis providing information regarding published tweets in terms of original, links, pictures, videos etc. It also covers details of tweet likes, retweets, mentions, replies etc. Make sure to capture your audiences attention in your business displays with our gratis customizable Utilizing Twitter For Social Media Dashboard For Twitter Competition Analysis Structure PDF. These are great for business strategies, office conferences, capital raising or task suggestions. If you desire to acquire more customers for your tech business and ensure they stay satisfied, create your own sales presentation with these plain slides.
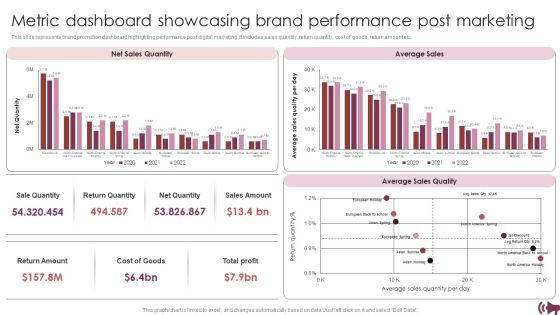
Guide Digital Advertising Optimize Lead Targeting Metric Dashboard Showcasing Brand Performance Post Slides PDF
This slide represents brand promotion dashboard highlighting performance post digital marketing. It includes sales quantity, return quantity, cost of goods, return amount etc. From laying roadmaps to briefing everything in detail, our templates are perfect for you. You can set the stage with your presentation slides. All you have to do is download these easy to edit and customizable templates. Guide Digital Advertising Optimize Lead Targeting Metric Dashboard Showcasing Brand Performance Post Slides PDF will help you deliver an outstanding performance that everyone would remember and praise you for. Do download this presentation today.
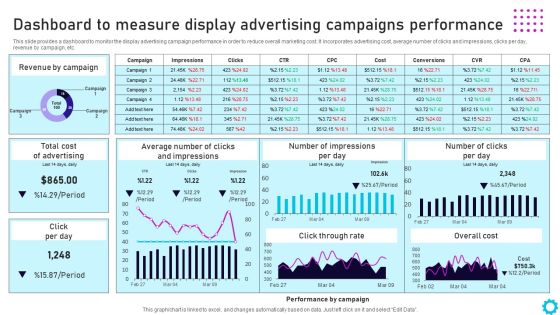
Complete Guide For Display Dashboard To Measure Display Advertising Campaigns Themes PDF
This slide provides a dashboard to monitor the display advertising campaign performance in order to reduce overall marketing cost. It incorporates advertising cost, average number of clicks and impressions, clicks per day, revenue by campaign, etc. Make sure to capture your audiences attention in your business displays with our gratis customizable Complete Guide For Display Dashboard To Measure Display Advertising Campaigns Themes PDF. These are great for business strategies, office conferences, capital raising or task suggestions. If you desire to acquire more customers for your tech business and ensure they stay satisfied, create your own sales presentation with these plain slides.

Online PR Techniques To Boost Brands Online Visibility KPI Dashboard To Track PR Marketing Summary PDF
This slide shows dashboard which can be used by organizations to measure the results of public relation strategy. It includes metrics such as media coverage rate, social media engagement rate, share of voice and brand mentions. Make sure to capture your audiences attention in your business displays with our gratis customizable Online PR Techniques To Boost Brands Online Visibility KPI Dashboard To Track PR Marketing Summary PDF. These are great for business strategies, office conferences, capital raising or task suggestions. If you desire to acquire more customers for your tech business and ensure they stay satisfied, create your own sales presentation with these plain slides.

Strategic Guide For Mastering E Commerce Marketing Dashboard To Evaluate Marketing Campaign Performance Graphics PDF
This slide represents dashboard to evaluate marketing campaign performance. It includes revenue, sales, total orders, order value, conversion rate etc. Slidegeeks is one of the best resources for PowerPoint templates. You can download easily and regulate Strategic Guide For Mastering E Commerce Marketing Dashboard To Evaluate Marketing Campaign Performance Graphics PDF for your personal presentations from our wonderful collection. A few clicks is all it takes to discover and get the most relevant and appropriate templates. Use our Templates to add a unique zing and appeal to your presentation and meetings. All the slides are easy to edit and you can use them even for advertisement purposes.

Project Coordination Plan Project Management Dashboard To Track Essential Activities Rules PDF
This slide provides information about dashboard to track project essential activities by tracking project schedule, budget, risks, etc. Slidegeeks is here to make your presentations a breeze with Project Coordination Plan Project Management Dashboard To Track Essential Activities Rules PDF With our easy to use and customizable templates, you can focus on delivering your ideas rather than worrying about formatting. With a variety of designs to choose from, you are sure to find one that suits your needs. And with animations and unique photos, illustrations, and fonts, you can make your presentation pop. So whether you are giving a sales pitch or presenting to the board, make sure to check out Slidegeeks first.

Dashboard To Evaluate Display Advertising Source Conversion And Cost Designs PDF
This slide provides a dashboard to assess the rate of conversion and cost of display advertising campaign by different sources. It includes source, average cost of marketing, conversion, click, revenue, impression by source. Make sure to capture your audiences attention in your business displays with our gratis customizable Dashboard To Evaluate Display Advertising Source Conversion And Cost Designs PDF. These are great for business strategies, office conferences, capital raising or task suggestions. If you desire to acquire more customers for your tech business and ensure they stay satisfied, create your own sales presentation with these plain slides.
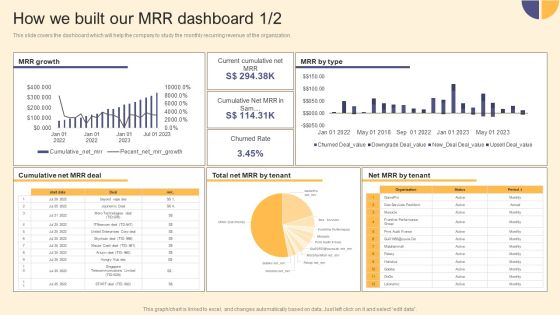
Per Device Pricing Strategy For Managed Solutions How We Built Our MRR Dashboard Infographics PDF
This slide covers the dashboard which will help the company to study the monthly recurring revenue of the organization. Make sure to capture your audiences attention in your business displays with our gratis customizable Per Device Pricing Strategy For Managed Solutions How We Built Our MRR Dashboard Infographics PDF. These are great for business strategies, office conferences, capital raising or task suggestions. If you desire to acquire more customers for your tech business and ensure they stay satisfied, create your own sales presentation with these plain slides.

KPI Dashboard To Track First Time Leads Ppt PowerPoint Presentation File Pictures PDF
The following slide showcases dashboard which can help businesses assess information about newly generated leads. It provides information about leads, permissions gained by source, revenue, sales closed, MailChimp, email, ads, etc. Take your projects to the next level with our ultimate collection of KPI Dashboard To Track First Time Leads Ppt PowerPoint Presentation File Pictures PDF. Slidegeeks has designed a range of layouts that are perfect for representing task or activity duration, keeping track of all your deadlines at a glance. Tailor these designs to your exact needs and give them a truly corporate look with your own brand colors they will make your projects stand out from the rest.
Key Elements Of Strategic Brand Administration Customer Tracking Dashboard To Monitor Brand Loyalty Information PDF
This slide provides information brand loyalty tracking dashboard in order to monitor customer engagement, average revenues, new vs. returning visitors performance, etc. Make sure to capture your audiences attention in your business displays with our gratis customizable Key Elements Of Strategic Brand Administration Customer Tracking Dashboard To Monitor Brand Loyalty Information PDF. These are great for business strategies, office conferences, capital raising or task suggestions. If you desire to acquire more customers for your tech business and ensure they stay satisfied, create your own sales presentation with these plain slides.

Business Vendor Performance Dashboard KPI With Top Supplier For Manufacturing Business Information PDF
Following slide contains executive dashboard which provide managers to track and monitor trends over a period of time. This include elements such as revenue, top products, top supplier, top customer, revenue trends annually, etc. Showcasing this set of slides titled Business Vendor Performance Dashboard KPI With Top Supplier For Manufacturing Business Information PDF. The topics addressed in these templates are Customers, Product, Sales. All the content presented in this PPT design is completely editable. Download it and make adjustments in color, background, font etc. as per your unique business setting.
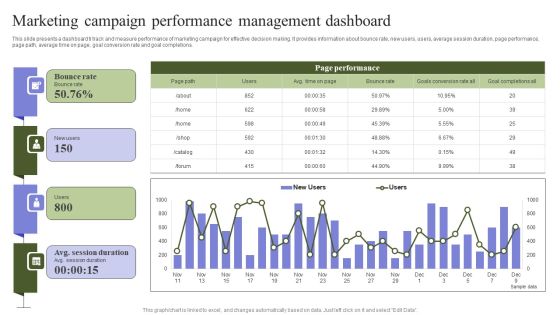
Marketing Mix Strategy Handbook Marketing Campaign Performance Management Dashboard Professional PDF
This slide presents a dashboard ti track and measure performance of marketing campaign for effective decision making. It provides information about bounce rate, new users, users, average session duration, page performance, page path, average time on page, goal conversion rate and goal completions. Make sure to capture your audiences attention in your business displays with our gratis customizable Marketing Mix Strategy Handbook Marketing Campaign Performance Management Dashboard Professional PDF. These are great for business strategies, office conferences, capital raising or task suggestions. If you desire to acquire more customers for your tech business and ensure they stay satisfied, create your own sales presentation with these plain slides.
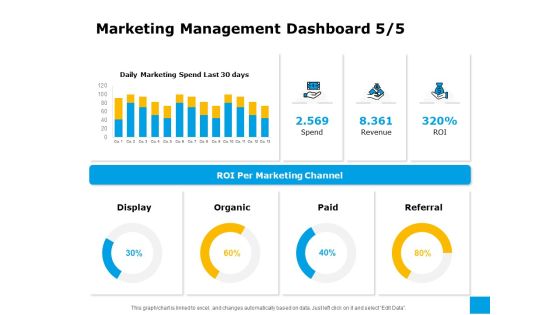
Effective Advertising And Sales Management Marketing Management Dashboard Paid Ppt Professional Graphic Tips PDF
Deliver an awe-inspiring pitch with this creative effective advertising and sales management marketing management dashboard paid ppt professional graphic tips pdf bundle. Topics like display, organic, paid, referral, roi per marketing channel, spend, revenue, roi can be discussed with this completely editable template. It is available for immediate download depending on the needs and requirements of the user.

Dashboard Key Market Players In The Retail Industry Ppt PowerPoint Presentation Gallery PDF
Showcasing this set of slides titled dashboard key market players in the retail industry ppt powerpoint presentation gallery pdf. The topics addressed in these templates are market share, worlds largest retail companies revenue. All the content presented in this PPT design is completely editable. Download it and make adjustments in color, background, font etc. as per your unique business setting.

Retail KPI Dashboard Showing Revenue Vs Units Sold Ppt Pictures Influencers PDF
Deliver and pitch your topic in the best possible manner with this retail KPI dashboard showing revenue vs units sold ppt pictures influencers pdf. Use them to share invaluable insights on revenue vs units sold, revenue by product category and impress your audience. This template can be altered and modified as per your expectations. So, grab it now.

Dashboard To Measure Performance Of Social Media Retail Business Growth Marketing Techniques Ideas PDF
This following slide displays the key metrics that can help an organization to measure effectiveness of social media strategies. These can be leads generated, leads by region, web traffic targets etc If you are looking for a format to display your unique thoughts, then the professionally designed Dashboard To Measure Performance Of Social Media Retail Business Growth Marketing Techniques Ideas PDF is the one for you. You can use it as a Google Slides template or a PowerPoint template. Incorporate impressive visuals, symbols, images, and other charts. Modify or reorganize the text boxes as you desire. Experiment with shade schemes and font pairings. Alter, share or cooperate with other people on your work. Download Dashboard To Measure Performance Of Social Media Retail Business Growth Marketing Techniques Ideas PDF and find out how to give a successful presentation. Present a perfect display to your team and make your presentation unforgettable.

Vendor Relationship Management Strategic Plan KPI Dashboard For Supplier Monitoring Infographics PDF
The slide depicts the KPI dashboard for the supplier monitoring. It provides information regarding the monthly purchase value, number of contracted suppliers, scheduled and completed audits along with vendors quality performance. Coming up with a presentation necessitates that the majority of the effort goes into the content and the message you intend to convey. The visuals of a PowerPoint presentation can only be effective if it supplements and supports the story that is being told. Keeping this in mind our experts created Vendor Relationship Management Strategic Plan KPI Dashboard For Supplier Monitoring Infographics PDF to reduce the time that goes into designing the presentation. This way, you can concentrate on the message while our designers take care of providing you with the right template for the situation.

Dashboard Showing Monthly Sales And Sales Distribution Ppt PowerPoint Presentation Infographic Template Portrait PDF
Presenting this set of slides with name dashboard showing monthly sales and sales distribution ppt powerpoint presentation infographic template portrait pdf. The topics discussed in these slides are monthly sales, sales distribution. This is a completely editable PowerPoint presentation and is available for immediate download. Download now and impress your audience.
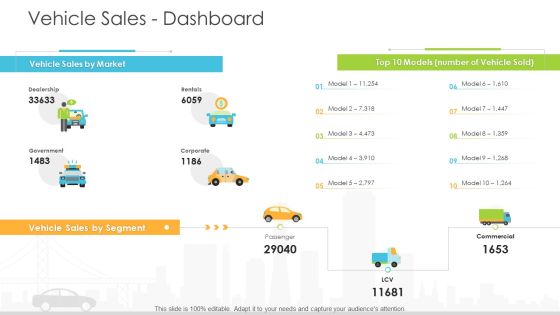
Vehicle Sales Plunge In An Automobile Firm Vehicle Sales Dashboard Demonstration PDF
Deliver an awe inspiring pitch with this creative vehicle sales plunge in an automobile firm vehicle sales dashboard demonstration pdf bundle. Topics like vehicle sales by market, vehicle sales by segment, commercial can be discussed with this completely editable template. It is available for immediate download depending on the needs and requirements of the user.

Performance Assessment Sales Initiative Report Sales KPI Dashboard Ppt Slides Influencers PDF
Presenting this set of slides with name performance assessment sales initiative report sales kpi dashboard ppt slides influencers pdf. The topics discussed in these slides are revenue, profit, cost, incremental, sales. This is a completely editable PowerPoint presentation and is available for immediate download. Download now and impress your audience.

Channel Sales Taking Your Product To Market Channel Sales Plan Financials Dashboard Graphics PDF
Presenting this set of slides with name channel sales taking your product to market channel sales plan financials dashboard graphics pdf. The topics discussed in these slides are distribution, sales, representative, locations, revenue. This is a completely editable PowerPoint presentation and is available for immediate download. Download now and impress your audience.
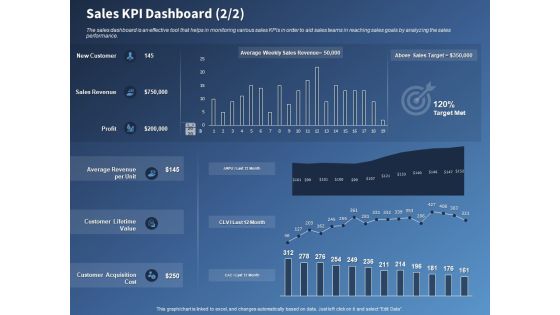
Performance Assessment Sales Initiative Report Sales KPI Dashboard Revenue Ppt Inspiration Slide Portrait PDF
Presenting this set of slides with name performance assessment sales initiative report sales kpi dashboard revenue ppt inspiration slide portrait pdf. The topics discussed in these slides are value, revenue, acquisition, cost. This is a completely editable PowerPoint presentation and is available for immediate download. Download now and impress your audience.
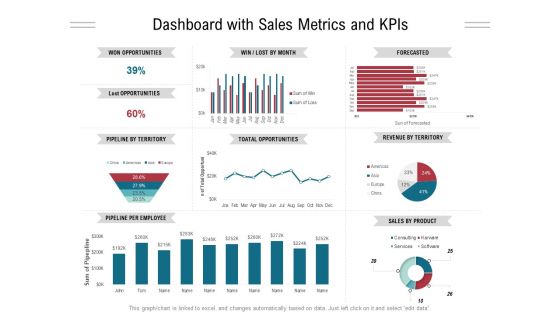
Dashboard With Sales Metrics And Kpis Ppt PowerPoint Presentation Gallery Styles PDF
Presenting this set of slides with name dashboard with sales metrics and kpis ppt powerpoint presentation gallery styles pdf. The topics discussed in these slides are won opportunities, lost opportunities, pipeline by territory, pipeline per employee, forecasted, revenue territory, sales product. This is a completely editable PowerPoint presentation and is available for immediate download. Download now and impress your audience.

Sales KPIS Dashboard With Profit Margin Ppt PowerPoint Presentation Slides Show PDF
Presenting this set of slides with name sales kpis dashboard with profit margin ppt powerpoint presentation slides show pdf. The topics discussed in these slides are new customers, revenue, profit, profit margin. This is a completely editable PowerPoint presentation and is available for immediate download. Download now and impress your audience.

Business Intelligence Report Sales Performance Dashboard Ppt Infographic Template Examples PDF
Presenting this set of slides with name business intelligence report sales performance dashboard ppt infographic template examples pdf. The topics discussed in these slides are new customer, sales revenue, profit, sales target, targeted sales growth. This is a completely editable PowerPoint presentation and is available for immediate download. Download now and impress your audience.
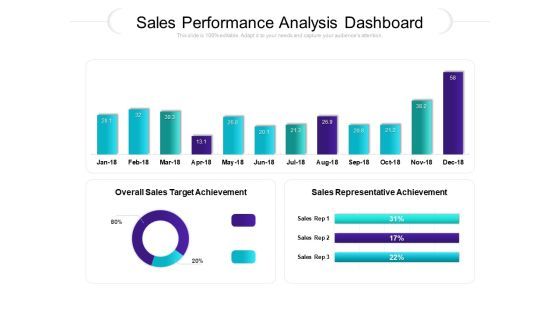
Sales Performance Analysis Dashboard Ppt PowerPoint Presentation Infographic Template Guide PDF
Presenting this set of slides with name sales performance analysis dashboard ppt powerpoint presentation infographic template guide pdf. The topics discussed in these slides are overall sales target achievement, sales representative achievement. This is a completely editable PowerPoint presentation and is available for immediate download. Download now and impress your audience.
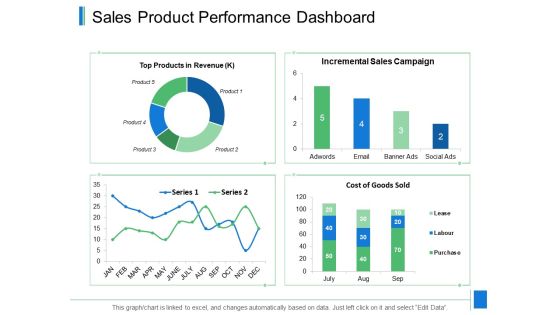
Sales Product Performance Dashboard Ppt PowerPoint Presentation Infographic Template Format Ideas
Presenting this set of slides with name sales product performance dashboard ppt powerpoint presentation infographic template format ideas. The topics discussed in these slides are marketing, business, management, planning, strategy. This is a completely editable PowerPoint presentation and is available for immediate download. Download now and impress your audience.

Product Sales Analysis Dashboard Report Ppt PowerPoint Presentation Infographics Graphics Pictures PDF
Presenting this set of slides with name product sales analysis dashboard report ppt powerpoint presentation infographics graphics pictures pdf. The topics discussed in these slides are average operative costs, product models performance, production last year, sales by month, taxed amount. This is a completely editable PowerPoint presentation and is available for immediate download. Download now and impress your audience.

Vehicle Sales Plunge In An Automobile Firm Advanced Technology Vehicle Dashboard Inspiration PDF
Deliver and pitch your topic in the best possible manner with this vehicle sales plunge in an automobile firm advanced technology vehicle dashboard inspiration pdf. Use them to share invaluable insights on total sales, annual sales, top sales by atv sales, monthly sales and impress your audience. This template can be altered and modified as per your expectations. So, grab it now.

Business Sales Dashboard With Total Costs Ppt PowerPoint Presentation Portfolio Summary PDF
Presenting this set of slides with name business sales dashboard with total costs ppt powerpoint presentation portfolio summary pdf. The topics discussed in these slides are number of orders, total sales, total cost, total profit, sales by regions, sales reps overview, monthly sales overview. This is a completely editable PowerPoint presentation and is available for immediate download. Download now and impress your audience.

Business Sales Dashboard With Product Category Ppt PowerPoint Presentation Model Objects PDF
Presenting this set of slides with name business sales dashboard with product category ppt powerpoint presentation model objects pdf. The topics discussed in these slides are revenue, new costumers, gross profit, costumer satisfaction, sales comparison, sales product category, sales month. This is a completely editable PowerPoint presentation and is available for immediate download. Download now and impress your audience.
Target Vs Actual Sales Comparison Dashboard Ppt PowerPoint Presentation File Icons PDF
Presenting this set of slides with name target vs actual sales comparison dashboard ppt powerpoint presentation file icons pdf. The topics discussed in these slides are sales amount, avg commission rate, total commissions, total deductions, commission payable, top sales manager, top sales person. This is a completely editable PowerPoint presentation and is available for immediate download. Download now and impress your audience.
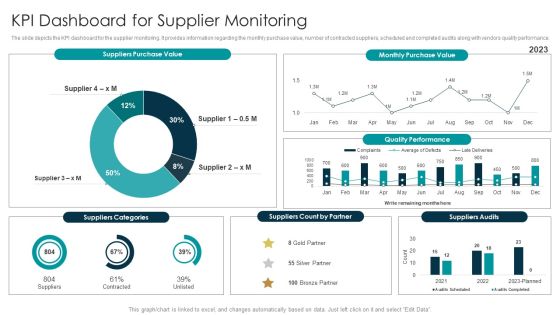
Tactical Approach For Vendor Reskilling KPI Dashboard For Supplier Monitoring Slides PDF
The slide depicts the KPI dashboard for the supplier monitoring. It provides information regarding the monthly purchase value, number of contracted suppliers, scheduled and completed audits along with vendors quality performance. Coming up with a presentation necessitates that the majority of the effort goes into the content and the message you intend to convey. The visuals of a PowerPoint presentation can only be effective if it supplements and supports the story that is being told. Keeping this in mind our experts created Tactical Approach For Vendor Reskilling KPI Dashboard For Supplier Monitoring Slides PDF to reduce the time that goes into designing the presentation. This way, you can concentrate on the message while our designers take care of providing you with the right template for the situation.

 Home
Home