AI PPT Maker
Templates
PPT Bundles
Design Services
Business PPTs
Business Plan
Management
Strategy
Introduction PPT
Roadmap
Self Introduction
Timelines
Process
Marketing
Agenda
Technology
Medical
Startup Business Plan
Cyber Security
Dashboards
SWOT
Proposals
Education
Pitch Deck
Digital Marketing
KPIs
Project Management
Product Management
Artificial Intelligence
Target Market
Communication
Supply Chain
Google Slides
Research Services
 One Pagers
All Categories
-
Home
- Customer Favorites
- Procurement Dashboard
Procurement Dashboard

Business Intelligence Dashboard To Monitor Performance Of Retail Business Infographics PDF
The following slide displays BI dashboard for real time tracking of key business financials. It further includes details about scorecard, sales distribution, supply and demand, etc. Pitch your topic with ease and precision using this Business Intelligence Dashboard To Monitor Performance Of Retail Business Infographics PDF. This layout presents information on Business Intelligence Dashboard, Monitor Performance, Retail Business. It is also available for immediate download and adjustment. So, changes can be made in the color, design, graphics or any other component to create a unique layout.

Competitive Sales Strategy Development Plan For Revenue Growth Dashboard Depicting Product Sales Kpis Elements PDF
This slide shows the dashboard that depicts product sales metrics which focuses on revenue generated from top products, incremental sales by campaign, cost of goods sold, etc. Deliver an awe inspiring pitch with this creative Competitive Sales Strategy Development Plan For Revenue Growth Dashboard Depicting Product Sales Kpis Elements PDF bundle. Topics like Incremental Sales, Cost, Store Purchases can be discussed with this completely editable template. It is available for immediate download depending on the needs and requirements of the user.

Advancement Of Retail Store In Future Tracking Essential Retail Store Activities Dashboard Portrait PDF
This slide provides details regarding the dashboard for tracking retail store activities in terms of customer retention, rate of return, volume sales, etc. Deliver an awe inspiring pitch with this creative advancement of retail store in future tracking essential retail store activities dashboard portrait pdf bundle. Topics like rate of return by category, number of new and returning customers, customer retention can be discussed with this completely editable template. It is available for immediate download depending on the needs and requirements of the user.
Online Customer Interaction Dashboard For Tracking Digital Content Performance Topics PDF
This slide covers the KPI dashboard for analyzing online content. It includes metrics such as blog visitors, pageviews, newsletter conversion rate, new signups, new customers, etc. Deliver an awe inspiring pitch with this creative Online Customer Interaction Dashboard For Tracking Digital Content Performance Topics PDF bundle. Topics like Newsletter Signups, Purchase Amount, Blog Visitors can be discussed with this completely editable template. It is available for immediate download depending on the needs and requirements of the user.

CRM Pipeline Administration Customer Deal Tracking In Sales Pipeline Dashboard Ppt Inspiration Template PDF
This slide covers information regarding dashboard for tracking various customer deals in sales pipeline. From laying roadmaps to briefing everything in detail, our templates are perfect for you. You can set the stage with your presentation slides. All you have to do is download these easy-to-edit and customizable templates. CRM Pipeline Administration Customer Deal Tracking In Sales Pipeline Dashboard Ppt Inspiration Template PDF will help you deliver an outstanding performance that everyone would remember and praise you for. Do download this presentation today.
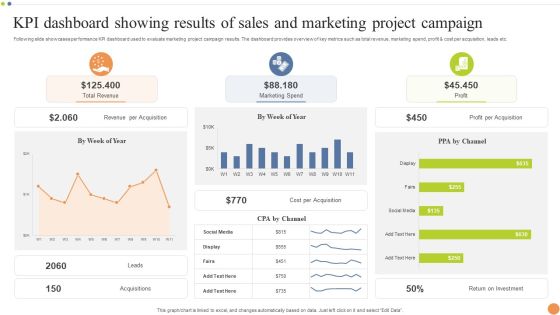
KPI Dashboard Showing Results Of Sales And Marketing Project Campaign Formats PDF
Following slide showcases performance KPI dashboard used to evaluate marketing project campaign results. The dashboard provides overview of key metrics such as total revenue, marketing spend, profit and cost per acquisition, leads etc. Showcasing this set of slides titled KPI Dashboard Showing Results Of Sales And Marketing Project Campaign Formats PDF. The topics addressed in these templates are Marketing Spend, Revenue, Profit Per Acquisition. All the content presented in this PPT design is completely editable. Download it and make adjustments in color, background, font etc. as per your unique business setting.
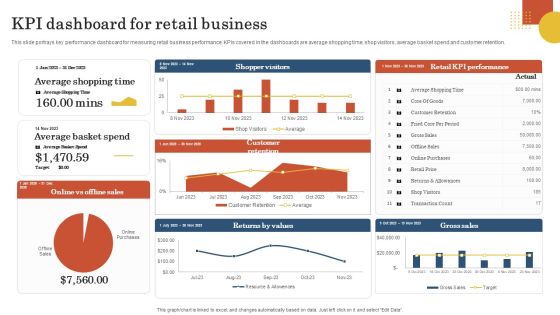
Retail Business Operation Management To Optimize Customer Experience KPI Dashboard For Retail Business Download PDF
This slide portrays key performance dashboard for measuring retail business performance. KPIs covered in the dashboards are average shopping time, shop visitors, average basket spend and customer retention. Are you in need of a template that can accommodate all of your creative concepts This one is crafted professionally and can be altered to fit any style. Use it with Google Slides or PowerPoint. Include striking photographs, symbols, depictions, and other visuals. Fill, move around, or remove text boxes as desired. Test out color palettes and font mixtures. Edit and save your work, or work with colleagues. Download Retail Business Operation Management To Optimize Customer Experience KPI Dashboard For Retail Business Download PDF and observe how to make your presentation outstanding. Give an impeccable presentation to your group and make your presentation unforgettable.
Brand Identity Management Toolkit Overall Brand Performance Tracking Dashboard Diagrams PDF
This slide provides information regarding brand performance tracking dashboard capturing KPIs such as brand metric, brand commitment, advertising metrics, and purchase metrics. Create an editable Brand Identity Management Toolkit Overall Brand Performance Tracking Dashboard Diagrams PDF that communicates your idea and engages your audience. Whether youre presenting a business or an educational presentation, pre-designed presentation templates help save time. Brand Identity Management Toolkit Overall Brand Performance Tracking Dashboard Diagrams PDF is highly customizable and very easy to edit, covering many different styles from creative to business presentations. Slidegeeks has creative team members who have crafted amazing templates. So, go and get them without any delay.
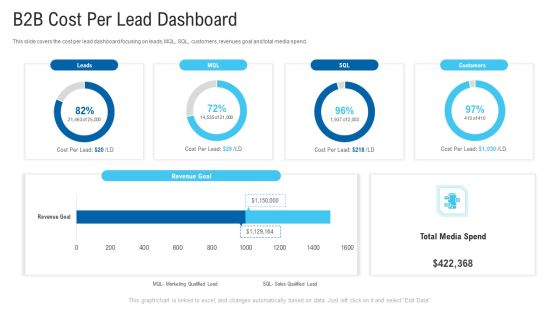
New Era Of B2B Trading B2B Cost Per Lead Dashboard Ppt Gallery Layout PDF
This slide covers the cost per lead dashboard focusing on leads, MQL, SQL, customers, revenues goal and total media spend.Deliver and pitch your topic in the best possible manner with this new era of B2B trading B2B cost per lead dashboard ppt gallery layout pdf. Use them to share invaluable insights on revenue goal, total media spend and impress your audience. This template can be altered and modified as per your expectations. So, grab it now.
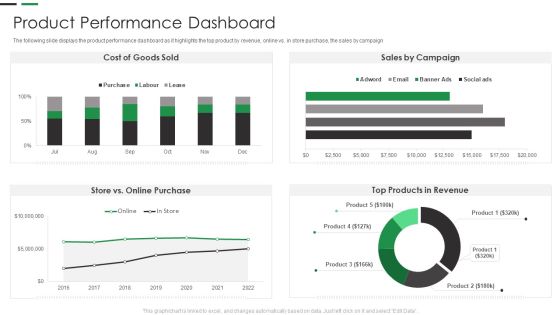
Evaluating New Commodity Impact On Market Product Performance Dashboard Elements PDF
The following slide displays the product performance dashboard as it highlights the top product by revenue, online vs. in store purchase, the sales by campaign Deliver an awe inspiring pitch with this creative Evaluating New Commodity Impact On Market Product Performance Dashboard Elements PDF bundle. Topics like Sales Campaign, Products In Revenue, Online Purchase can be discussed with this completely editable template. It is available for immediate download depending on the needs and requirements of the user.
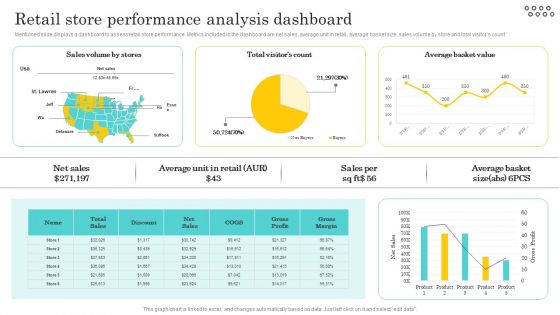
Optimizing And Managing Retail Retail Store Performance Analysis Dashboard Rules PDF
Mentioned slide displays a dashboard to assess retail store performance. Metrics included in the dashboard are net sales, average unit in retail, average basket size, sales volume by store and total visitors count. This Optimizing And Managing Retail Retail Store Performance Analysis Dashboard Rules PDF from Slidegeeks makes it easy to present information on your topic with precision. It provides customization options, so you can make changes to the colors, design, graphics, or any other component to create a unique layout. It is also available for immediate download, so you can begin using it right away. Slidegeeks has done good research to ensure that you have everything you need to make your presentation stand out. Make a name out there for a brilliant performance.
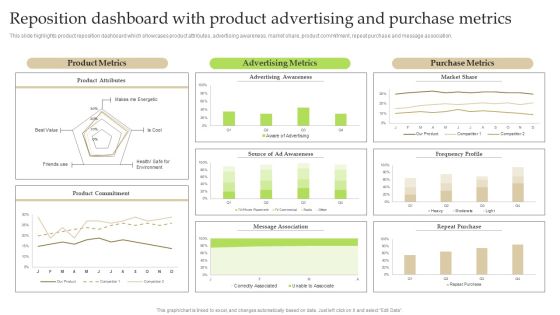
Reposition Dashboard With Product Advertising And Purchase Metrics Ppt PowerPoint Presentation File Show PDF
This slide highlights product reposition dashboard which showcases product attributes, advertising awareness, market share, product commitment, repeat purchase and message association. Formulating a presentation can take up a lot of effort and time, so the content and message should always be the primary focus. The visuals of the PowerPoint can enhance the presenters message, so our Reposition Dashboard With Product Advertising And Purchase Metrics Ppt PowerPoint Presentation File Show PDF was created to help save time. Instead of worrying about the design, the presenter can concentrate on the message while our designers work on creating the ideal templates for whatever situation is needed. Slidegeeks has experts for everything from amazing designs to valuable content, we have put everything into Reposition Dashboard With Product Advertising And Purchase Metrics Ppt PowerPoint Presentation File Show PDF

Business Model Opening Restaurant Coffee Shop Business Dashboard Plan Icons PDF
This slide shows the coffee shop business dashboard which includes sales month, gross margin by category, sales and profit details, etc. Deliver an awe inspiring pitch with this creative business model opening restaurant coffee shop business dashboard plan icons pdf bundle. Topics like gross margin, plan sales, sales and profit can be discussed with this completely editable template. It is available for immediate download depending on the needs and requirements of the user.

CIO For IT Cost Optimization Techniques Determine IT Spending Management Dashboard Infographics PDF
This slide provides information regarding IT spending management dashboard for tracking parameters such as asset controller, cost by service, potential savings, etc. Deliver and pitch your topic in the best possible manner with this CIO For IT Cost Optimization Techniques Determine IT Spending Management Dashboard Infographics PDF. Use them to share invaluable insights on Cost Entity Summary, Potential Savings, Cost By Service and impress your audience. This template can be altered and modified as per your expectations. So, grab it now.
Implementing Fixed Asset Management Fixed Asset Management Dashboard For Tracking Summary PDF
This slide represents fixed asset management dashboard for tracking equipment performance. It includes work management, downtime, work orders etc. Deliver and pitch your topic in the best possible manner with this Implementing Fixed Asset Management Fixed Asset Management Dashboard For Tracking Summary PDF. Use them to share invaluable insights on Data Sets, Asset Details, Labour Analysis, Purchasing Spend and impress your audience. This template can be altered and modified as per your expectations. So, grab it now.

Coffee Shop Business Dashboard Category Business Plan For Opening A Coffeehouse Ppt Slides Graphics Example PDF
This slide shows the coffee shop business dashboard which includes sales month, gross margin by category, sales and profit details, etc. Deliver and pitch your topic in the best possible manner with this coffee shop business dashboard category business plan for opening a coffeehouse ppt slides graphics example pdf. Use them to share invaluable insights on sales, plan, gross margin and impress your audience. This template can be altered and modified as per your expectations. So, grab it now.
IT Spend Management Priorities By Cios Determine IT Project Portfolio Management Tracking Dashboard Icons PDF
This slide provides information regarding IT project portfolio management tracking dashboard including details about allocated budget across portfolios, used budget percentage, estimated vs. actual cost, etc. Deliver an awe inspiring pitch with this creative IT Spend Management Priorities By Cios Determine IT Project Portfolio Management Tracking Dashboard Icons PDF bundle. Topics like Allocated Budget, Across Portfolios, Estimated Cost can be discussed with this completely editable template. It is available for immediate download depending on the needs and requirements of the user.

Building Promotional Campaign Real Estate Sales Real Estate Dashboard To Monitor Sales Team Performance Guidelines PDF
This slide portrays property management dashboard with KPIs namely, average days on market, properties for sale, properties for rent, sales vs. target and sales by region. Deliver and pitch your topic in the best possible manner with this building promotional campaign real estate sales real estate dashboard to monitor sales team performance guidelines pdf. Use them to share invaluable insights on property management kpi dashboard and impress your audience. This template can be altered and modified as per your expectations. So, grab it now.
Forecasting And Managing Consumer Attrition For Business Advantage Dashboard Customer Purchase Tracking Repeat Structure PDF
The firm is looking forward to track customer experience by tracking various touchpoints in order to handle issues such customer churn. KPIs mentioned in the dashboard are measured regularly across the organization. Deliver and pitch your topic in the best possible manner with this forecasting and managing consumer attrition for business advantage dashboard customer purchase tracking repeat structure pdf. Use them to share invaluable insights on total repeat sales after coupon, total repeat sales after reward, total cart value per month and impress your audience. This template can be altered and modified as per your expectations. So, grab it now.

Retail KPI Dashboard Showing Sales Revenue Customers Ppt PowerPoint Presentation Show Background Designs
This is a retail kpi dashboard showing sales revenue customers ppt powerpoint presentation show background designs. This is a six stage process. The stages in this process are finance, analysis, business, investment, marketing.
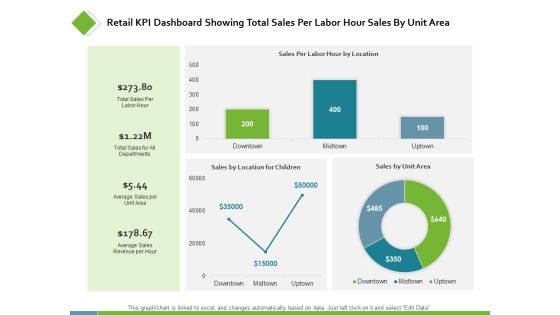
Retail KPI Dashboard Showing Total Sales Per Labor Ppt PowerPoint Presentation Styles Examples
This is a retail kpi dashboard showing total sales per labor ppt powerpoint presentation styles examples. This is a three stage process. The stages in this process are finance, analysis, business, investment, marketing.

New Product Sales Strategy And Marketing KPI Dashboard To Monitor Sales Performance Information PDF
This slide shows sales performance monitoring dashboard. Metrics included in the dashboard are sales revenue, sales growth, average revenue per unit, customer lifetime value and customer acquisition cost. Deliver an awe inspiring pitch with this creative New Product Sales Strategy And Marketing KPI Dashboard To Monitor Sales Performance Information PDF bundle. Topics like Sales Revenue, Monthly Sales Growth, Sales Country Performance can be discussed with this completely editable template. It is available for immediate download depending on the needs and requirements of the user.

Business To Business Sales Playbook Sales Management Activities Tracking Dashboard Icons PDF
This slide provides information regarding sales management activities tracking dashboard to measure closed business, sales pipeline, sales activity by sales rep, month over month growth, forecast by month, etc. Deliver and pitch your topic in the best possible manner with this business to business sales playbook sales management activities tracking dashboard icons pdf. Use them to share invaluable insights on sales management activities tracking dashboard and impress your audience. This template can be altered and modified as per your expectations. So, grab it now.
Key Practices To Create Sales Playbook Sales Management Activities Tracking Dashboard Mockup PDF
This slide provides information regarding sales management activities tracking dashboard to measure closed business, sales pipeline, sales activity by sales rep, month over month growth, forecast by month, etc. Deliver and pitch your topic in the best possible manner with this key practices to create sales playbook sales management activities tracking dashboard mockup pdf Use them to share invaluable insights on sales management activities tracking dashboard and impress your audience. This template can be altered and modified as per your expectations. So, grab it now.

Tracking Sales Pipeline And Lead Activity Dashboard Managing Sales Pipeline Health Professional PDF
This slide covers information regarding dashboard associated to tracking lead activity across sales pipeline. Explore a selection of the finest Tracking Sales Pipeline And Lead Activity Dashboard Managing Sales Pipeline Health Professional PDF here. With a plethora of professionally designed and pre-made slide templates, you can quickly and easily find the right one for your upcoming presentation. You can use our Tracking Sales Pipeline And Lead Activity Dashboard Managing Sales Pipeline Health Professional PDF to effectively convey your message to a wider audience. Slidegeeks has done a lot of research before preparing these presentation templates. The content can be personalized and the slides are highly editable. Grab templates today from Slidegeeks.
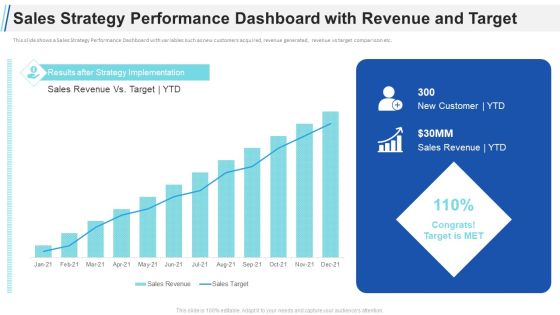
Maximizing Profitability Earning Through Sales Initiatives Sales Strategy Performance Dashboard With Revenue And Target Elements PDF
This slide shows a Sales Strategy Performance Dashboard with variables such as new customers acquired, revenue generated, revenue vs target comparison etc. Deliver and pitch your topic in the best possible manner with this maximizing profitability earning through sales initiatives sales strategy performance dashboard with revenue and target elements pdf. Use them to share invaluable insights on sales strategy performance dashboard with revenue and target and impress your audience. This template can be altered and modified as per your expectations. So, grab it now.

Launch New Sales Enablement Program Lead Generation KPI Dashboard To Monitor Sales Topics PDF
Mentioned slide shows the KPI dashboard that can be used to track win and lost sales opportunities. It includes metrics namely won opportunities, lost opportunities, pipeline by territory, total opportunities. Deliver and pitch your topic in the best possible manner with this launch new sales enablement program lead generation kpi dashboard to monitor sales topics pdf. Use them to share invaluable insights on kpi dashboard to monitor sales opportunities and impress your audience. This template can be altered and modified as per your expectations. So, grab it now.

Business Platform Dashboard With Retail KPI Performance Ppt PowerPoint Presentation Slides Diagrams PDF
Pitch your topic with ease and precision using this business platform dashboard with retail kpi performance ppt powerpoint presentation slides diagrams pdf. This layout presents information on retail kpi performance, business platform dashboard with retail kpi performance, online vs offline sales, shop visitors. It is also available for immediate download and adjustment. So, changes can be made in the color, design, graphics or any other component to create a unique layout.

Crm Dashboard Lead Acquisition And Deal Acquisition Ppt PowerPoint Presentation Backgrounds
This is a crm dashboard lead acquisition and deal acquisition ppt powerpoint presentation backgrounds. This is a two stage process. The stages in this process are lead acquisition, deal acquisition, touched leads, new deals.

Crm Dashboard Lead Acquisition And Deal Acquisition Ppt PowerPoint Presentation Tips
This is a crm dashboard lead acquisition and deal acquisition ppt powerpoint presentation tips. This is a two stage process. The stages in this process are lead acquisition, deal acquisition, touched leads, new deals.

Crm Dashboard Lead Acquisition And Deal Acquisition Ppt PowerPoint Presentation Inspiration
This is a crm dashboard lead acquisition and deal acquisition ppt powerpoint presentation inspiration. This is a five stage process. The stages in this process are touched leads, lead acquisition, deal acquisition, time duration.

Crm Dashboard Deals By Expected Close Date Ppt PowerPoint Presentation Icon
This is a crm dashboard deals by expected close date ppt powerpoint presentation icon. This is a three stage process. The stages in this process are deals by expected close date, years, planning, business, growth.

Crm Dashboard Deals By Expected Close Date Ppt PowerPoint Presentation Styles
This is a crm dashboard deals by expected close date ppt powerpoint presentation styles. This is a three stage process. The stages in this process are deals by expected close date, business, marketing, strategy, success.

Crm Dashboard Lead Acquisition And Deal Acquisition Ppt PowerPoint Presentation Professional File Formats
This is a crm dashboard lead acquisition and deal acquisition ppt powerpoint presentation professional file formats. This is a two stage process. The stages in this process are lead acquisition, deal acquisition.

Crm Dashboard Deals By Expected Close Date Ppt PowerPoint Presentation Show Information
This is a crm dashboard deals by expected close date ppt powerpoint presentation show information. This is a three stage process. The stages in this process are deals by expected close date, percentage, business, finance, success.

Crm Dashboard Lead Acquisition And Deal Acquisition Ppt PowerPoint Presentation Model Designs
This is a crm dashboard lead acquisition and deal acquisition ppt powerpoint presentation model designs. This is a two stage process. The stages in this process are lead acquisition, deal acquisition.

Crm Dashboard Deals By Expected Close Date Ppt PowerPoint Presentation Background Images
This is a crm dashboard deals by expected close date ppt powerpoint presentation background images. This is a five stage process. The stages in this process are bar graph, aug, sep, oct, growth.

Crm Dashboard Deals By Expected Close Date Ppt PowerPoint Presentation Portfolio Icons
This is a crm dashboard deals by expected close date ppt powerpoint presentation portfolio icons. This is a three stage process. The stages in this process are bar graph, finance, marketing, strategy, business, analysis, growth.
Remodeling Experiential Departmental Store Ecosystem Dashboard To Track Retail Store Performance Icons PDF
This slide provides information regarding the dashboard to track retail store performance in terms of sales revenues, customers, sales by division, top collections generating revenues, etc. Here you can discover an assortment of the finest PowerPoint and Google Slides templates. With these templates, you can create presentations for a variety of purposes while simultaneously providing your audience with an eye catching visual experience. Download Remodeling Experiential Departmental Store Ecosystem Dashboard To Track Retail Store Performance Icons PDF to deliver an impeccable presentation. These templates will make your job of preparing presentations much quicker, yet still, maintain a high level of quality. Slidegeeks has experienced researchers who prepare these templates and write high quality content for you. Later on, you can personalize the content by editing the Remodeling Experiential Departmental Store Ecosystem Dashboard To Track Retail Store Performance Icons PDF.

Branches For Visualization Research And Development Sales Performance Dashboard After Infographics PDF
This slide depicts the dashboard for sales performance after the implementation of visualization research based on revenue, quantity, regional sales. Crafting an eye-catching presentation has never been more straightforward. Let your presentation shine with this tasteful yet straightforward Branches For Visualization Research And Development Sales Performance Dashboard After Infographics PDF template. It offers a minimalistic and classy look that is great for making a statement. The colors have been employed intelligently to add a bit of playfulness while still remaining professional. Construct the ideal Branches For Visualization Research And Development Sales Performance Dashboard After Infographics PDF that effortlessly grabs the attention of your audience Begin now and be certain to wow your customers.

Risk Assessment And Mitigation Plan Vendor Supplier Analysis Dashboard Clipart PDF
Here in this slide we include Dashboard covering supplier order value, defect rate, and quality score for making decisions regarding supplier selection. Deliver an awe inspiring pitch with this creative risk assessment and mitigation plan vendor supplier analysis dashboard clipart pdf bundle. Topics like return cost analysis, project analyses, value ordered, emergency purchase ratio, spend under management can be discussed with this completely editable template. It is available for immediate download depending on the needs and requirements of the user.

Fixed Asset Management Framework Implementation Fixed Asset Management Dashboard Demonstration PDF
This slide represents fixed asset management dashboard for tracking equipment performance. It includes work management, downtime, work orders etc.Deliver an awe inspiring pitch with this creative Fixed Asset Management Framework Implementation Fixed Asset Management Dashboard Demonstration PDF bundle. Topics like Labour Analysis, Purchasing Spend, Asset Details can be discussed with this completely editable template. It is available for immediate download depending on the needs and requirements of the user.
Fixed Asset Management Dashboard For Implementing Fixed Asset Tracking Solution Topics PDF
This slide represents fixed asset management dashboard for tracking equipment performance. It includes work management, downtime, work orders etc.Deliver an awe inspiring pitch with this creative Fixed Asset Management Dashboard For Implementing Fixed Asset Tracking Solution Topics PDF bundle. Topics like Asset Comparison, Review Labor, Purchasing Spend can be discussed with this completely editable template. It is available for immediate download depending on the needs and requirements of the user.

New Era Of B2B Trading B2B Conversion Velocity Dashboard Ppt Show Information PDF
This slide covers the conversion velocity dashboard wherein the lead count is calculated based on marketing qualified and sales qualified lead.Deliver an awe-inspiring pitch with this creative new era of B2B trading B2B conversion velocity dashboard ppt show information pdf. bundle. Topics like trending leads and cpl, leads can be discussed with this completely editable template. It is available for immediate download depending on the needs and requirements of the user.
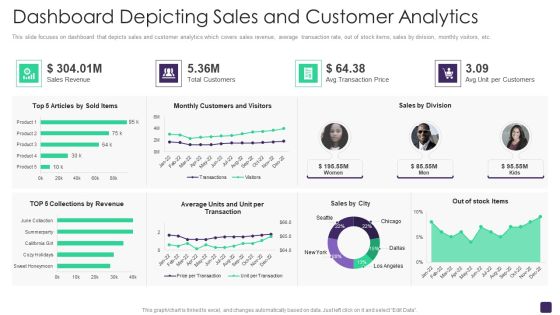
Retail Merchandising Program Dashboard Depicting Sales And Customer Analytics Topics PDF
This slide focuses on dashboard that depicts sales and customer analytics which covers sales revenue, average transaction rate, out of stock items, sales by division, monthly visitors, etc. Deliver an awe inspiring pitch with this creative Retail Merchandising Program Dashboard Depicting Sales And Customer Analytics Topics PDF bundle. Topics like Sales Revenue, Total Customers, Avg Transaction Price, Sales Division can be discussed with this completely editable template. It is available for immediate download depending on the needs and requirements of the user.
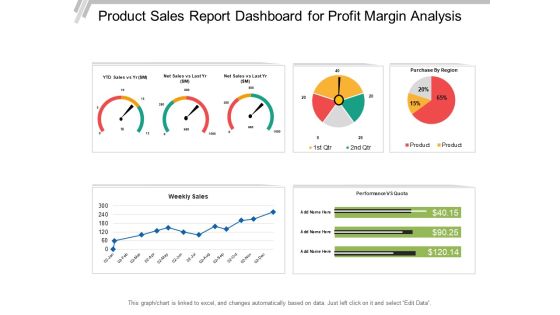
Product Sales Report Dashboard For Profit Margin Analysis Ppt PowerPoint Presentation Ideas Slide Portrait
This is a product sales report dashboard for profit margin analysis ppt powerpoint presentation ideas slide portrait. This is a four stage process. The stages in this process are business analytics, ba, organizations data.

Go To Market Approach For New Product Dashboard To Measure Sales Rep Performance Formats PDF
This slide illustrates sales representative performance measurement dashboard with key metrics such as average first contact resolution rate, occupancy rate, NPS and top agents by solved tickets.Deliver and pitch your topic in the best possible manner with this Go To Market Approach For New Product Dashboard To Measure Sales Rep Performance Formats PDF Use them to share invaluable insights on Dashboard To Measure Sales Rep Performance and impress your audience. This template can be altered and modified as per your expectations. So, grab it now.

Maintaining Partner Relationships KPI Dashboard To Measure Sales Performance Rules PDF
Following slide illustrates sales performance monitoring dashboard. KPIs included in the dashboard are sales revenue, sales growth, average revenue per unit, customer lifetime value and customer acquisition cost. Deliver and pitch your topic in the best possible manner with this Maintaining Partner Relationships KPI Dashboard To Measure Sales Performance Rules PDF. Use them to share invaluable insights on Sales Country Performance, Above Sales Target, YTD, Customer Lifetime Value, Customer Acquisition Cost and impress your audience. This template can be altered and modified as per your expectations. So, grab it now.
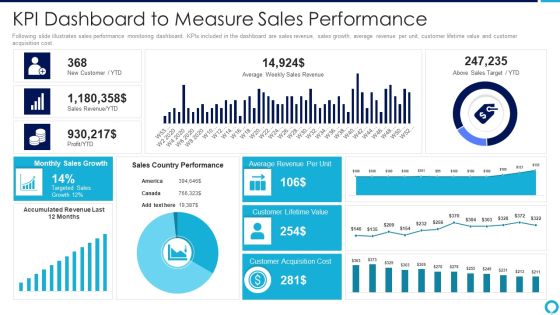
Partnership Management Strategies Kpi Dashboard To Measure Sales Performance Introduction PDF
Following slide illustrates sales performance monitoring dashboard. KPIs included in the dashboard are sales revenue, sales growth, average revenue per unit, customer lifetime value and customer acquisition cost.Deliver and pitch your topic in the best possible manner with this partnership management strategies kpi dashboard to measure sales performance introduction pdf Use them to share invaluable insights on average revenue, monthly sales growth, customer acquisition cost and impress your audience. This template can be altered and modified as per your expectations. So, grab it now.

Food Service Delivery And Management Dashboard With Annual Sales Brochure PDF
This slide shows a food delivery company dashboard keeping track of all the orders or services delivered. Moreover, it covers KPIs such as total restaurants, registered users, weekly sales, total orders etc. Showcasing this set of slides titled Food Service Delivery And Management Dashboard With Annual Sales Brochure PDF. The topics addressed in these templates are Food Service Delivery, Management Dashboard, Annual Sales. All the content presented in this PPT design is completely editable. Download it and make adjustments in color, background, font etc. as per your unique business setting.

Creating Successful Advertising Campaign Shopping Cart Conversion Rate Dashboard Ideas PDF
This slide shows shopping cart conversion rate dashboard. It includes details of online revenue share, shipping error rate, shopping cart conversion rate, coupon conversion, product views per session and revenue per visitors. Deliver an awe inspiring pitch with this creative Creating Successful Advertising Campaign Shopping Cart Conversion Rate Dashboard Ideas PDF bundle. Topics like target, revenue per visitors, conversion rate can be discussed with this completely editable template. It is available for immediate download depending on the needs and requirements of the user.

Field Marketing Strategies To Boost Product Sales Dashboard To Track Retail Store Marketing Download PDF
This slide showcases dashboard that can help organization to evaluate the performance of retail outlet after implementing in store promotional campaign. Its key elements are sales revenue, customers, average transaction value, sales by city etc. Do you have an important presentation coming up Are you looking for something that will make your presentation stand out from the rest Look no further than Field Marketing Strategies To Boost Product Sales Dashboard To Track Retail Store Marketing Download PDF. With our professional designs, you can trust that your presentation will pop and make delivering it a smooth process. And with Slidegeeks, you can trust that your presentation will be unique and memorable. So why wait Grab Field Marketing Strategies To Boost Product Sales Dashboard To Track Retail Store Marketing Download PDF today and make your presentation stand out from the rest.

Monthly Sales Reporting And Projections Dashboard Icon Ppt Icon Clipart Images PDF
Persuade your audience using this Monthly Sales Reporting And Projections Dashboard Icon Ppt Icon Clipart Images PDF. This PPT design covers three stages, thus making it a great tool to use. It also caters to a variety of topics including Monthly Sale,s Reporting And Projections, Dashboard Icon. Download this PPT design now to present a convincing pitch that not only emphasizes the topic but also showcases your presentation skills.

Customer Relationship Management Marketing Dashboard With Revenue Graph And Deals Funnel Ideas PDF
The following slides highlights the CRM marketing dashboard with provides key details about new contacts, campaign email sent, revenue graph and worth of new deals. Showcasing this set of slides titled customer relationship management marketing dashboard with revenue graph and deals funnel ideas pdf. The topics addressed in these templates are funnel, revenue graph, campaign. All the content presented in this PPT design is completely editable. Download it and make adjustments in color, background, font etc. as per your unique business setting.
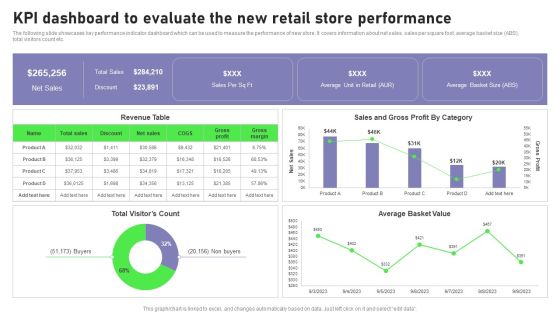
Retail Outlet Opening To Enhance Product Sale Kpi Dashboard To Evaluate The New Retail Guidelines PDF
The following slide showcases key performance indicator dashboard which can be used to measure the performance of new store. It covers information about net sales, sales per square foot, average basket size ABS, total visitors count etc. There are so many reasons you need a Retail Outlet Opening To Enhance Product Sale Kpi Dashboard To Evaluate The New Retail Guidelines PDF. The first reason is you can not spend time making everything from scratch, Thus, Slidegeeks has made presentation templates for you too. You can easily download these templates from our website easily.
Developing Excellence In Logistics Operations Supply Chain Activity Tracking Dashboard Elements PDF
This slide shows the dashboard that depicts supply chain management which includes retailer and warehouse capacity, delivery status from supplier to warehouse, time to reach there, etc.Deliver and pitch your topic in the best possible manner with this Developing Excellence In Logistics Operations Supply Chain Activity Tracking Dashboard Elements PDF Use them to share invaluable insights on Reach Warehouse, Warehouse Capacity, Supplier To Warehouse and impress your audience. This template can be altered and modified as per your expectations. So, grab it now.

CRM Team Dashboard Highlighting Major Web Based Platform Kpis Template PDF
This slide showcases customer relationship management CRM team dashboard indicating web portal KPIs. It provides information about cost per acquisition CPA, signups, channel, spend, etc. Pitch your topic with ease and precision using this CRM Team Dashboard Highlighting Major Web Based Platform Kpis Template PDF. This layout presents information on CRM Team Dashboard Highlighting, Web Based Platform Kpis. It is also available for immediate download and adjustment. So, changes can be made in the color, design, graphics or any other component to create a unique layout.

Foreign Exchange Stock Trading Dashboard Showing Market Fluctuations Ppt PowerPoint Presentation Portfolio Mockup PDF
Persuade your audience using this foreign exchange stock trading dashboard showing market fluctuations ppt powerpoint presentation portfolio mockup pdf. This PPT design covers one stages, thus making it a great tool to use. It also caters to a variety of topics including foreign exchange stock trading dashboard showing market fluctuations. Download this PPT design now to present a convincing pitch that not only emphasizes the topic but also showcases your presentation skills.

Business Sales Dashboard Revenue Summary Report Ppt PowerPoint Presentation Pictures Structure
This is a business sales dashboard revenue summary report ppt powerpoint presentation pictures structure. This is a two stage process. The stages in this process are business analytics, ba, organizations data.
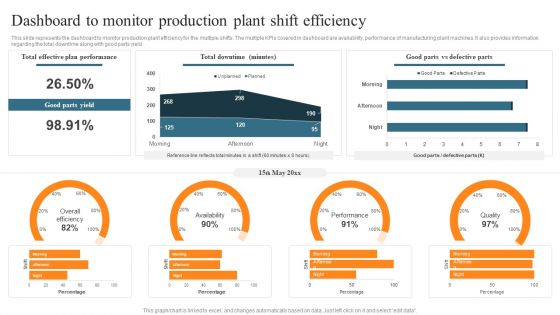
Leveraging Predictive Maintenance To Enhance Production Process Dashboard To Monitor Production Plant Shift Efficiency Structure PDF
This slide represents the dashboard to monitor production plant efficiency for the multiple shifts. The multiple KPIs covered in dashboard are availability, performance of manufacturing plant machines. It also provides information regarding the total downtime along with good parts yield. There are so many reasons you need a Leveraging Predictive Maintenance To Enhance Production Process Dashboard To Monitor Production Plant Shift Efficiency Structure PDF. The first reason is you cant spend time making everything from scratch, Thus, Slidegeeks has made presentation templates for you too. You can easily download these templates from our website easily.
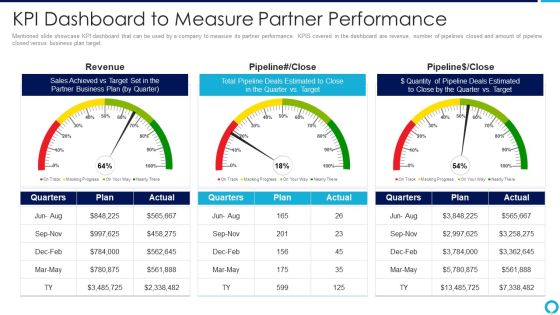
Partnership Management Strategies Kpi Dashboard To Measure Partner Performance Elements PDF
Mentioned slide showcase KPI dashboard that can be used by a company to measure its partner performance. KPIS covered in the dashboard are revenue, number of pipelines closed and amount of pipeline closed versus business plan target.Deliver an awe inspiring pitch with this creative partnership management strategies kpi dashboard to measure partner performance elements pdf bundle. Topics like sales achieved, partner business plan, total pipeline deals estimated can be discussed with this completely editable template. It is available for immediate download depending on the needs and requirements of the user.

Dashboard To Track Activities Associated With B2B Buyer Journey Portrait PDF
This slide provides information regarding marketing activities dashboard across B2B buyer journey. The dashboard caters KPIs related to revenue generated, won and lost deals count, conversion percentage, etc. Make sure to capture your audiences attention in your business displays with our gratis customizable Dashboard To Track Activities Associated With B2B Buyer Journey Portrait PDF. These are great for business strategies, office conferences, capital raising or task suggestions. If you desire to acquire more customers for your tech business and ensure they stay satisfied, create your own sales presentation with these plain slides.
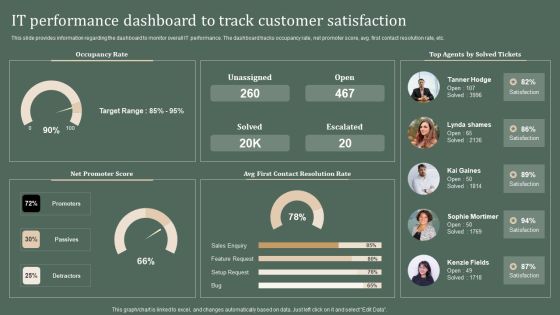
Deploying Corporate Aligned IT Strategy IT Performance Dashboard To Track Customer Satisfaction Clipart PDF
This slide provides information regarding the dashboard to monitor overall IT performance. The dashboard tracks occupancy rate, net promoter score, avg. first contact resolution rate, etc. Boost your pitch with our creative Deploying Corporate Aligned IT Strategy IT Performance Dashboard To Track Customer Satisfaction Clipart PDF. Deliver an awe inspiring pitch that will mesmerize everyone. Using these presentation templates you will surely catch everyones attention. You can browse the ppts collection on our website. We have researchers who are experts at creating the right content for the templates. So you do not have to invest time in any additional work. Just grab the template now and use them.

Real Time Analytics Dashboard To Measure Marketing Campaign Performance Information PDF
The purpose of this slide is to outline analytics dashboard to evaluate the success rate of marketing campaign performance. It provides information about metrics such as clicks, impressions, spend, conversions, site audit score, audience growth, etc. Pitch your topic with ease and precision using this Real Time Analytics Dashboard To Measure Marketing Campaign Performance Information PDF. This layout presents information on Real Time Analytics Dashboard To Measure Marketing Campaign Performance. It is also available for immediate download and adjustment. So, changes can be made in the color, design, graphics or any other component to create a unique layout.

Quarterly Budget Analysis Of Business Organization Dashboard To Monitor Department Demonstration PDF
This slide highlights the dashboard to monitor the department wise budget allocation and usage. It provides information regarding the total budget allocated and actual amount spent by multiple organization silos such as marketing, finance, HR. It also contains details of each departments average employee spending,Deliver and pitch your topic in the best possible manner with this Quarterly Budget Analysis Of Business Organization Dashboard To Monitor Department Demonstration PDF Use them to share invaluable insights on Dashboard To Monitor Department Wise Budget Allocation And Usage and impress your audience. This template can be altered and modified as per your expectations. So, grab it now.

Building Market Brand Leadership Strategies Kpi Dashboard To Track Brand Performance Designs PDF
Mentioned slide showcases KPI dashboard that can be used to check the financial performance of a brand. Metrics covered in the dashboard are return on assets, working capital ratio, return on equity etc. There are so many reasons you need a Building Market Brand Leadership Strategies Kpi Dashboard To Track Brand Performance Designs PDF. The first reason is you cannot spend time making everything from scratch, Thus, Slidegeeks has made presentation templates for you too. You can easily download these templates from our website easily.

KPI Dashboard To Track Effectiveness Of Real Estate Business Performance Slides PDF
The following slide exhibits key performance indicator KPI dashboard which can be used to measure the financial performance of the real estate company. It covers various kpis such as sales vs target per agent, top 10 projects, top 5 agencies etc. Deliver an awe inspiring pitch with this creative KPI Dashboard To Track Effectiveness Of Real Estate Business Performance Slides PDF bundle. Topics like KPI Dashboard, Track Effectiveness, Real Estate Business Performance can be discussed with this completely editable template. It is available for immediate download depending on the needs and requirements of the user.

Crm Dashboard Pipeline By Sales Stage Ppt PowerPoint Presentation Outline Outfit
This is a crm dashboard pipeline by sales stage ppt powerpoint presentation outline outfit. This is a five stage process. The stages in this process are blank, quality, develop, propose, close.
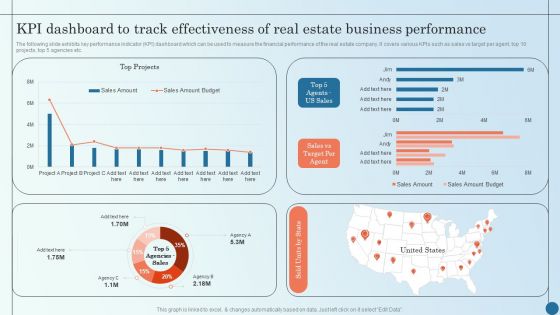
KPI Dashboard To Track Effectiveness Of Real Estate Business Managing Commercial Property Risks Demonstration PDF
The following slide exhibits key performance indicator KPI dashboard which can be used to measure the financial performance of the real estate company. It covers various KPIs such as sales vs target per agent, top 10 projects, top 5 agencies etc.Deliver an awe inspiring pitch with this creative KPI Dashboard To Track Effectiveness Of Real Estate Business Managing Commercial Property Risks Demonstration PDF bundle. Topics like Kpi Dashboard, Track Effectiveness, Estate Business can be discussed with this completely editable template. It is available for immediate download depending on the needs and requirements of the user.

Consumer Complaint Procedure Complaint Handling System Dashboard Ppt Ideas Example File PDF
This slide has cover the dashboard including complaint by type, complaints by priority and complaint by cities. Deliver and pitch your topic in the best possible manner with this consumer complaint procedure complaint handling system dashboard ppt ideas example file pdf. Use them to share invaluable insights on commercial, investor relations, property purchase, cases by priority, property rent and impress your audience. This template can be altered and modified as per your expectations. So, grab it now.

Robotization In Issues Management Complaint Handling System Dashboard Ppt Infographics Slides PDF
This slide has cover the dashboard including complaint by type, complaints by priority and complaint by cities. Deliver and pitch your topic in the best possible manner with this robotization in issues management complaint handling system dashboard ppt infographics slides pdf. Use them to share invaluable insights on property purchase, cases by priority, category and impress your audience. This template can be altered and modified as per your expectations. So, grab it now.
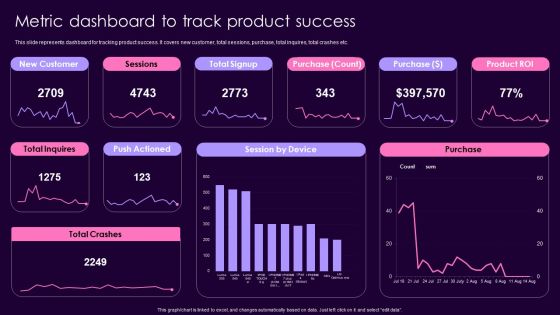
Product Management Techniques Metric Dashboard To Track Product Success Ideas PDF
This slide represents dashboard for tracking product success. It covers new customer, total sessions, purchase, total inquires, total crashes etc. Deliver an awe inspiring pitch with this creative Product Management Techniques Metric Dashboard To Track Product Success Ideas PDF bundle. Topics like New Customer, Sessions, Total Signup can be discussed with this completely editable template. It is available for immediate download depending on the needs and requirements of the user.

Project Budget Management And Monitoring Dashboard Ppt Portfolio Infographic Template PDF
This slide showcases project budget management and controls dashboard. It provides information about project cost, revenue trend along with invoice status and purchase order. Showcasing this set of slides titled Project Budget Management And Monitoring Dashboard Ppt Portfolio Infographic Template PDF. The topics addressed in these templates are Project Cost Trend, Project Revenue Trend, Invoice Status. All the content presented in this PPT design is completely editable. Download it and make adjustments in color, background, font etc. as per your unique business setting.

Retail KPI Dashboard Showing Revenue Vs Units Sold Ppt PowerPoint Presentation Professional Smartart
This is a retail kpi dashboard showing revenue vs units sold ppt powerpoint presentation professional smartart. This is a four stage process. The stages in this process are finance, analysis, business, investment, marketing.

Retail Kpi Dashboard Showing Revenue Vs Units Sold Ppt PowerPoint Presentation File Formats
This is a retail kpi dashboard showing revenue vs units sold ppt powerpoint presentation file formats. This is a three stage process. The stages in this process are finance, marketing, management, investment, analysis.
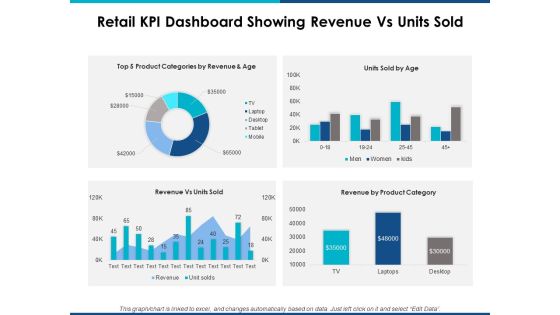
Retail Kpi Dashboard Showing Revenue Vs Units Sold Ppt Powerpoint Presentation Layouts Show
This is a retail kpi dashboard showing revenue vs units sold ppt powerpoint presentation layouts show. This is a four stage process. The stages in this process are finance, marketing, management, investment, analysis.

Retail Ecommerce Merchandising Tactics For Boosting Revenue KPI Dashboard To Analyze In Store Merchandising Rules PDF
The following slide outlines a performance key performance indicator KPI dashboard used to evaluate the effectiveness of in-store merchandising strategy. The KPIs covered in the slide are total sales, average inventory, active stores, distinct products sold, etc. Crafting an eye catching presentation has never been more straightforward. Let your presentation shine with this tasteful yet straightforward Retail Ecommerce Merchandising Tactics For Boosting Revenue KPI Dashboard To Analyze In Store Merchandising Rules PDF template. It offers a minimalistic and classy look that is great for making a statement. The colors have been employed intelligently to add a bit of playfulness while still remaining professional. Construct the ideal Retail Ecommerce Merchandising Tactics For Boosting Revenue KPI Dashboard To Analyze In Store Merchandising Rules PDF that effortlessly grabs the attention of your audience. Begin now and be certain to wow your customers.
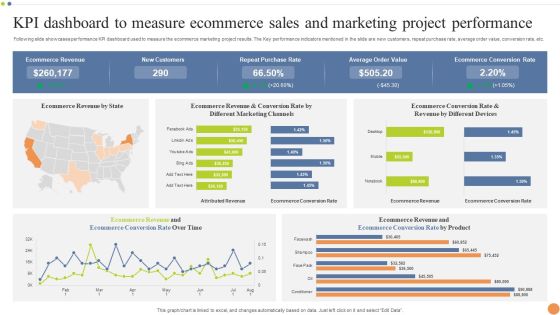
KPI Dashboard To Measure Ecommerce Sales And Marketing Project Performance Portrait PDF
Following slide showcases performance KPI dashboard used to measure the ecommerce marketing project results. The Key performance indicators mentioned in the slide are new customers, repeat purchase rate, average order value, conversion rate, etc. Pitch your topic with ease and precision using this KPI Dashboard To Measure Ecommerce Sales And Marketing Project Performance Portrait PDF. This layout presents information on Purchase Rate, Average Order Value, Ecommerce Conversion Rate. It is also available for immediate download and adjustment. So, changes can be made in the color, design, graphics or any other component to create a unique layout.

B2B Sales Techniques Playbook B2B Prospects Performance Measurement Dashboard Guidelines PDF
This slide provides information regarding B2B performance tracking dashboard to measure leads, MQL, SQL, customers, revenue goals, total media spend.Deliver an awe inspiring pitch with this creative B2B Sales Techniques Playbook B2B Prospects Performance Measurement Dashboard Guidelines PDF bundle. Topics like Revenue Goal, Total Media, Spend Customers can be discussed with this completely editable template. It is available for immediate download depending on the needs and requirements of the user.

Enhancing Stp Strategies For A Successful Market Promotion Kpi Dashboard To Monitor Diagrams PDF
Mentioned slide shows the KPI dashboard that can be used to track win and lost sales opportunities. It includes metrics namely won opportunities, lost opportunities, pipeline by territory, total opportunities. Deliver and pitch your topic in the best possible manner with this enhancing stp strategies for a successful market promotion kpi dashboard to monitor diagrams pdf. Use them to share invaluable insights on kpi dashboard to monitor sales opportunities and impress your audience. This template can be altered and modified as per your expectations. So, grab it now.
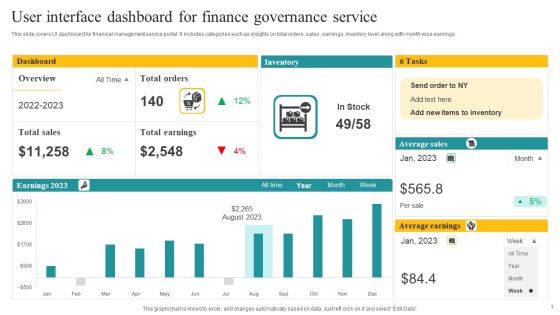
User Interface Dashboard For Finance Governance Service Ppt Outline Graphics Tutorials PDF
This slide covers UI dashboard for financial management service portal. It includes categories such as insights on total orders, sales , earnings, inventory level along with month wise earnings. Showcasing this set of slides titled User Interface Dashboard For Finance Governance Service Ppt Outline Graphics Tutorials PDF. The topics addressed in these templates are Dashboard, Inventory, Average Sales. All the content presented in this PPT design is completely editable. Download it and make adjustments in color, background, font etc. as per your unique business setting.

Kpi Metrics Dashboard To Measure Online Merchandising Strategy Effectiveness Retail Merchandising Techniques Sample PDF
The following slide outlines KPI metrics dashboard which can be used to measure the effectiveness of online marketing on retail store. The metrics covered in the slide are new orders, total income, expense, new users, best selling products, etc.Are you searching for a Kpi Metrics Dashboard To Measure Online Merchandising Strategy Effectiveness Retail Merchandising Techniques Sample PDF that is uncluttered, straightforward, and original Its easy to edit, and you can change the colors to suit your personal or business branding. For a presentation that expresses how much effort you ve put in, this template is ideal With all of its features, including tables, diagrams, statistics, and lists, its perfect for a business plan presentation. Make your ideas more appealing with these professional slides. Download Kpi Metrics Dashboard To Measure Online Merchandising Strategy Effectiveness Retail Merchandising Techniques Sample PDF from Slidegeeks today.

Comprehensive Promotion Guidelines To Administer Brand Overall Brand Performance Tracking Dashboard Mockup PDF
This slide provides information regarding brand performance tracking dashboard capturing KPIs such as brand metric, brand commitment, advertising metrics, and purchase metrics. Presenting this PowerPoint presentation, titled Comprehensive Promotion Guidelines To Administer Brand Overall Brand Performance Tracking Dashboard Mockup PDF, with topics curated by our researchers after extensive research. This editable presentation is available for immediate download and provides attractive features when used. Download now and captivate your audience. Presenting this Comprehensive Promotion Guidelines To Administer Brand Overall Brand Performance Tracking Dashboard Mockup PDF. Our researchers have carefully researched and created these slides with all aspects taken into consideration. This is a completely customizable Comprehensive Promotion Guidelines To Administer Brand Overall Brand Performance Tracking Dashboard Mockup PDF that is available for immediate downloading. Download now and make an impact on your audience. Highlight the attractive features available with our PPTs.
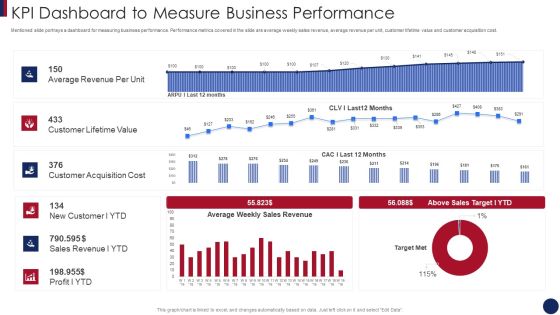
Post Merger Information Technology Service Delivery Amalgamation KPI Dashboard To Measure Business Template PDF
Mentioned slide portrays a dashboard for measuring business performance. Performance metrics covered in the slide are average weekly sales revenue, average revenue per unit, customer lifetime value and customer acquisition cost. Deliver an awe inspiring pitch with this creative post merger information technology service delivery amalgamation kpi dashboard to measure business template pdf bundle. Topics like kpi dashboard to measure business performance can be discussed with this completely editable template. It is available for immediate download depending on the needs and requirements of the user.

Customer Order Management Web Based Platform With Invoices Dashboard Clipart PDF
This slide showcase customer order handling web panel with billing dashboard. It provides information about past due, total outstanding, sales, deliveries, payments, status, shipped, open, dispatched, etc. Showcasing this set of slides titled Customer Order Management Web Based Platform With Invoices Dashboard Clipart PDF. The topics addressed in these templates are Customer Order Management, Web Based Platform, Invoices Dashboard. All the content presented in this PPT design is completely editable. Download it and make adjustments in color, background, font etc. as per your unique business setting.
Non Fungible Token Methodology IT NFT Transaction Analysis And Tracking Dashboard Brochure PDF
This slide demonstrates the dashboard for tracking NFT transactions and analysis based on daily sales, ETH volume collections, and so on. Create an editable Non Fungible Token Methodology IT NFT Transaction Analysis And Tracking Dashboard Brochure PDF that communicates your idea and engages your audience. Whether youre presenting a business or an educational presentation, pre-designed presentation templates help save time. Non Fungible Token Methodology IT NFT Transaction Analysis And Tracking Dashboard Brochure PDF is highly customizable and very easy to edit, covering many different styles from creative to business presentations. Slidegeeks has creative team members who have crafted amazing templates. So, go and get them without any delay.
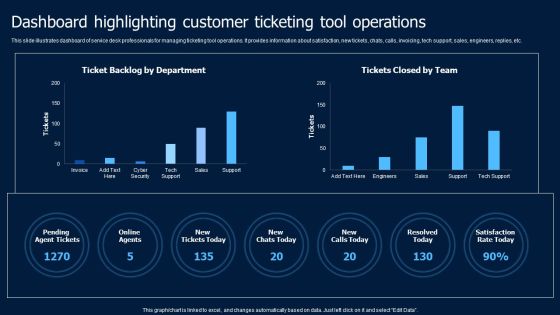
Help Desk Ticketing Dashboard Highlighting Customer Ticketing Tool Operations Introduction PDF
This slide illustrates dashboard of service desk professionals for managing ticketing tool operations. It provides information about satisfaction, new tickets, chats, calls, invoicing, tech support, sales, engineers, replies, etc. Crafting an eye-catching presentation has never been more straightforward. Let your presentation shine with this tasteful yet straightforward Help Desk Ticketing Dashboard Highlighting Customer Ticketing Tool Operations Introduction PDF maining professional. Construct the ideal Help Desk Ticketing Dashboard Highlighting Customer Ticketing Tool Operations Introduction PDF that effortlessly grabs the attention of your audience Begin now and be certain to wow your customers.

KPI Dashboard For Software Product Promotion Strategy With Various Tools Portrait PDF
Following slide depicts the KPI dashboard with numerous tools for software product marketing plan In order to locate prospects and close sales, agile lead generation and marketing techniques are needed. Pitch your topic with ease and precision using this KPI Dashboard For Software Product Promotion Strategy With Various Tools Portrait PDF. This layout presents information on KPI Dashboard, Software Product Promotion, Strategy With Various Tools. It is also available for immediate download and adjustment. So, changes can be made in the color, design, graphics or any other component to create a unique layout.
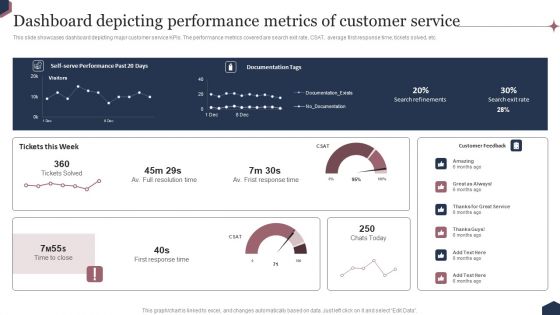
Enhance Customer Engagement Through After Sales Activities Dashboard Depicting Performance Metrics Formats PDF
This slide showcases dashboard depicting major customer service KPIs. The performance metrics covered are search exit rate, CSAT, average first response time, tickets solved, etc. There are so many reasons you need a Enhance Customer Engagement Through After Sales Activities Dashboard Depicting Performance Metrics Formats PDF. The first reason is you can not spend time making everything from scratch, Thus, Slidegeeks has made presentation templates for you too. You can easily download these templates from our website easily.
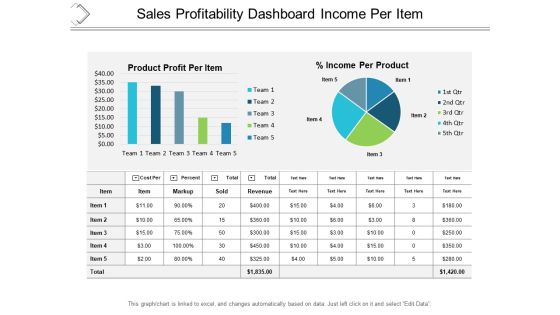
Sales Profitability Dashboard Income Per Item Ppt PowerPoint Presentation Professional Graphic Images
This is a sales profitability dashboard income per item ppt powerpoint presentation professional graphic images. This is a five stage process. The stages in this process are business analytics, ba, organizations data.

Crm Dashboard This Year Sales Vs Last Year Sales Ppt PowerPoint Presentation Layouts Outline
This is a crm dashboard this year sales vs last year sales ppt powerpoint presentation layouts outline. This is a two stage process. The stages in this process are sales given in fiscal month, this year sales, last year sales.

Crm Dashboard This Year Sales Vs Last Year Sales Ppt PowerPoint Presentation Information
This is a crm dashboard this year sales vs last year sales ppt powerpoint presentation information. This is a five stage process. The stages in this process are this year sales and last year sales by given in fiscal month.

Crm Dashboard This Year Sales Vs Last Year Sales Ppt PowerPoint Presentation Styles
This is a crm dashboard this year sales vs last year sales ppt powerpoint presentation styles. This is a two stage process. The stages in this process are sales given in fiscal month, business, marketing, presentation, growth.

Crm Dashboard This Year Sales Vs Last Year Sales Ppt PowerPoint Presentation Deck
This is a crm dashboard this year sales vs last year sales ppt powerpoint presentation deck. This is a two stage process. The stages in this process are business, marketing, success, growth, finance.

Crm Dashboard This Year Sales Vs Last Year Sales Ppt PowerPoint Presentation Professional Display
This is a crm dashboard this year sales vs last year sales ppt powerpoint presentation professional display. This is a two stage process. The stages in this process are area chart, growth, management, marketing, business, strategy.

B2B Sales Framework Playbook B2B Prospects Performance Measurement Dashboard Professional PDF
This slide provides information regarding B2B performance tracking dashboard to measure leads, MQL, SQL, customers, revenue goals, total media spend. Deliver an awe inspiring pitch with this creative B2B Sales Framework Playbook B2B Prospects Performance Measurement Dashboard Professional PDF bundle. Topics like Cost Per Lead, Customers, Revenue Goal can be discussed with this completely editable template. It is available for immediate download depending on the needs and requirements of the user.
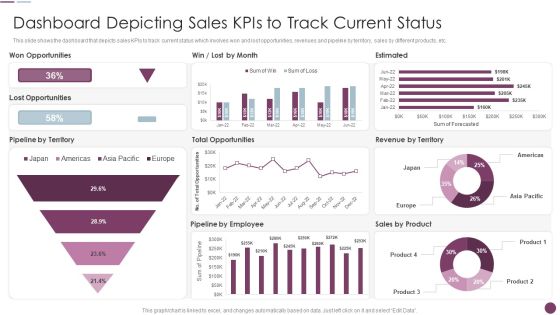
Sales Automation Procedure Dashboard Depicting Sales Kpis To Track Current Status Sample PDF
This slide shows the dashboard that depicts sales KPIs to track current status which involves won and lost opportunities, revenues and pipeline by territory, sales by different products, etc. Deliver an awe inspiring pitch with this creative Sales Automation Procedure Dashboard Depicting Sales Kpis To Track Current Status Sample PDF bundle. Topics like Estimated, Pipeline Employee, Pipeline Territory can be discussed with this completely editable template. It is available for immediate download depending on the needs and requirements of the user.

Crm Dashboard Pipeline By Sales Stage Ppt PowerPoint Presentation Infographic Template Slides
This is a crm dashboard pipeline by sales stage ppt powerpoint presentation infographic template slides. This is a five stage process. The stages in this process are total, quality, develop, propose, close.

Enhancing B2B Demand Creation And Sales Growth Determine B2B Account Management Dashboard Template PDF
This slide provides information regarding B2B account management dashboard catering KPIs related to pipeline deals, landing page completion, email engagement, etc. Deliver and pitch your topic in the best possible manner with this enhancing b2b demand creation and sales growth determine b2b account management dashboard template pdf. Use them to share invaluable insights on pipeline deals, email engagement, revenue by campaign, landing page completion and impress your audience. This template can be altered and modified as per your expectations. So, grab it now.
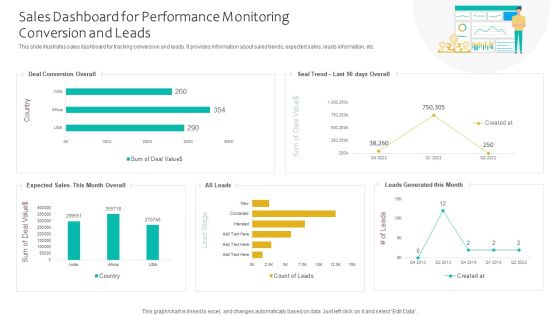
Sales Dashboard For Performance Monitoring Conversion And Leads Ppt Infographics Smartart PDF
This slide illustrates sales dashboard for tracking conversion and leads. It provides information about sales trends, expected sales, leads information, etc. Showcasing this set of slides titled Sales Dashboard For Performance Monitoring Conversion And Leads Ppt Infographics Smartart PDF. The topics addressed in these templates are Deal Conversion Overall, Expected Sales, Leads Generated. All the content presented in this PPT design is completely editable. Download it and make adjustments in color, background, font etc. as per your unique business setting.

Decrease Cost And Income Growth Dashboard Ppt PowerPoint Presentation Inspiration Guide
This is a decrease cost and income growth dashboard ppt powerpoint presentation inspiration guide. This is a three stage process. The stages in this process are growth, increase sales, increase revenue.

Sales Performance Dashboard Template 2 Ppt PowerPoint Presentation Infographic Template Clipart
This is a sales performance dashboard template 2 ppt powerpoint presentation infographic template clipart. This is a six stage process. The stages in this process are top sales reps, new customer, sales funnel, top selling plans, top opportunities.
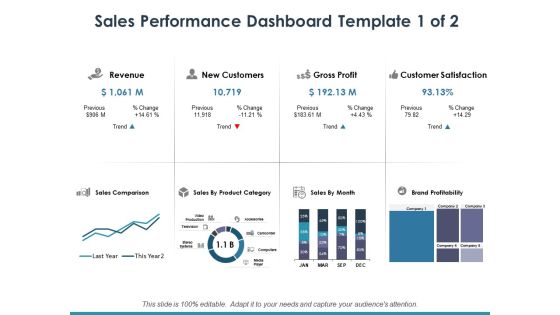
Sales Performance Dashboard Template 1 Ppt PowerPoint Presentation Infographic Template Maker
This is a sales performance dashboard template 1 ppt powerpoint presentation infographic template maker. This is a eight stage process. The stages in this process are dollar, business, finance, marketing.

Company Sales And Performance Dashboard Ppt PowerPoint Presentation Pictures Infographic Template
This is a company sales and performance dashboard ppt powerpoint presentation pictures infographic template. This is a four stage process. The stages in this process are business, finance, analysis, management, marketing.

Sales Performance Dashboard Template 2 Of 2 Ppt PowerPoint Presentation Infographics Design Inspiration
This is a sales performance dashboard template 2 of 2 ppt powerpoint presentation infographics design inspiration. This is a three stage process. The stages in this process are finance, management, strategy, analysis, marketing.

Sales Assistance Boost Overall Efficiency Sales KPI Dashboard Ppt Pictures File Formats PDF
The sales dashboard is an effective tool that helps in monitoring various sales KPIs in order to aid sales teams in reaching sales goals by analyzing the sales performance. Deliver an awe-inspiring pitch with this creative sales assistance boost overall efficiency sales kpi dashboard ppt pictures file formats pdf bundle. Topics like sales revenue, cost breakdown, incremental sales can be discussed with this completely editable template. It is available for immediate download depending on the needs and requirements of the user.

Sales Department Strategies Increase Revenues Sales KPI Dashboard Email Ppt Outline Microsoft PDF
The sales dashboard is an effective tool that helps in monitoring various sales KPIs in order to aid sales teams in reaching sales goals by analyzing the sales performance. Deliver an awe-inspiring pitch with this creative sales department strategies increase revenues sales kpi dashboard email ppt outline microsoft pdf bundle. Topics like sales revenue, cost breakdown, marketing can be discussed with this completely editable template. It is available for immediate download depending on the needs and requirements of the user.

Defined Sales Assistance For Business Clients Determine B2B Account Management Dashboard Summary PDF
This slide provides information regarding B2B account management dashboard catering KPIs related to pipeline deals, landing page completion, email engagement, etc. Deliver an awe inspiring pitch with this creative Defined Sales Assistance For Business Clients Determine B2B Account Management Dashboard Summary PDF bundle. Topics like Marketing Pipeline Health, Engagement Health, Landing Page Completion can be discussed with this completely editable template. It is available for immediate download depending on the needs and requirements of the user.
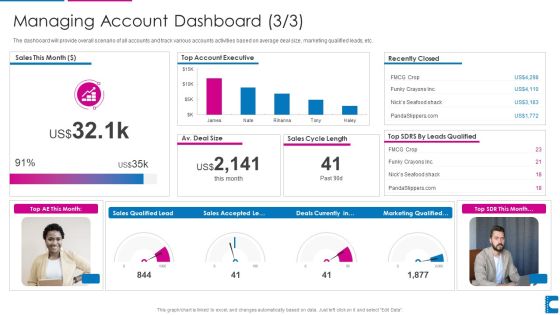
How To Administer Accounts To Increase Sales Revenue Managing Account Dashboard Executive Infographics PDF
The dashboard will provide overall scenario of all accounts and track various accounts activities based on average deal size, marketing qualified leads, etc. Deliver and pitch your topic in the best possible manner with this how to administer accounts to increase sales revenue managing account dashboard executive infographics pdf. Use them to share invaluable insights on account executive, sales, marketing and impress your audience. This template can be altered and modified as per your expectations. So, grab it now.
Tracking Essential Retail Store Activities Dashboard Incorporation Of Experience Information PDF
This slide provides details regarding the dashboard for tracking retail store activities in terms of customer retention, rate of return, volume sales, etc. Deliver and pitch your topic in the best possible manner with this tracking essential retail store activities dashboard incorporation of experience information pdf. Use them to share invaluable insights on total volume sales, rate of return, customer retention, number of new and returning customers and impress your audience. This template can be altered and modified as per your expectations. So, grab it now.

CRM Implementation Dashboard With Sales Pipeline And Revenue By Products Mockup PDF
The following slide showcases the CRM dashboard which includes leads, deals, sales revenue, revenue by products, total leads by source, total leads by status and lead distribution.Deliver an awe inspiring pitch with this creative CRM Implementation Dashboard With Sales Pipeline And Revenue By Products Mockup PDF bundle. Topics like Lead Distribution, Revenue By Products, Total Leads can be discussed with this completely editable template. It is available for immediate download depending on the needs and requirements of the user.
Sales Funnel Management For Revenue Generation Tracking Customer Sales Funnel Dashboard Information PDF
This slide covers information regarding the customer sales funnel tracking with sales volume and total market. Deliver an awe inspiring pitch with this creative sales funnel management for revenue generation tracking customer sales funnel dashboard information pdf bundle. Topics like tracking customer sales funnel dashboard can be discussed with this completely editable template. It is available for immediate download depending on the needs and requirements of the user.

Tools For Improving Sales Plan Effectiveness Sales Strategy Performance Dashboard With Revenue And Target Professional PDF
This slide shows a Sales Strategy Performance Dashboard with variables such as new customers acquired, revenue generated, revenue vs target comparison etc. Deliver and pitch your topic in the best possible manner with this tools for improving sales plan effectiveness sales strategy performance dashboard with revenue and target professional pdf. Use them to share invaluable insights on sales, revenue, target and impress your audience. This template can be altered and modified as per your expectations. So, grab it now.

B2B Sales Techniques Playbook B2B Sales Representatives Performance Tracking Dashboard Diagrams PDF
This slide provides information regarding B2B sales representatives performance tracking dashboard to measure leads by region, revenue breakdown, top performers by leads, revenues, etc. Deliver and pitch your topic in the best possible manner with this B2B Sales Techniques Playbook B2B Sales Representatives Performance Tracking Dashboard Diagrams PDF. Use them to share invaluable insights on Combine Sales, Individual Performance, Achieved Highest and impress your audience. This template can be altered and modified as per your expectations. So, grab it now.
Sales Funnel Management For Revenue Generation Tracking Sales Pipeline And Lead Activity Dashboard Background PDF
This slide covers information regarding dashboard associated to tracking lead activity across sales pipeline. Deliver and pitch your topic in the best possible manner with this sales funnel management for revenue generation tracking sales pipeline and lead activity dashboard background pdf. Use them to share invaluable insights on team matterhorn, expansion opportunity, estimated value and impress your audience. This template can be altered and modified as per your expectations. So, grab it now.

Porters Strategies For Targeted Client Segment Dashboard To Track Product Sales Performance Clipart PDF
This slide showcases dashboard that can help organization to analyse the sales of product after entering into niche market. Its key elements are sales, sales target, sales growth, sales by channel, inventory days outstanding etc. Presenting this PowerPoint presentation, titled Porters Strategies For Targeted Client Segment Dashboard To Track Product Sales Performance Clipart PDF, with topics curated by our researchers after extensive research. This editable presentation is available for immediate download and provides attractive features when used. Download now and captivate your audience. Presenting this Porters Strategies For Targeted Client Segment Dashboard To Track Product Sales Performance Clipart PDF. Our researchers have carefully researched and created these slides with all aspects taken into consideration. This is a completely customizable Porters Strategies For Targeted Client Segment Dashboard To Track Product Sales Performance Clipart PDF that is available for immediate downloading. Download now and make an impact on your audience. Highlight the attractive features available with our PPTs.

Price Leadership Technique Dashboard To Track Product Sales Performance Professional PDF
This slide showcases dashboard that can help organization to analyse the sales of product after entering into niche market. Its key elements are sales, sales target, sales growth, sales by channel, inventory days outstanding etc. Presenting this PowerPoint presentation, titled Price Leadership Technique Dashboard To Track Product Sales Performance Professional PDF, with topics curated by our researchers after extensive research. This editable presentation is available for immediate download and provides attractive features when used. Download now and captivate your audience. Presenting this Price Leadership Technique Dashboard To Track Product Sales Performance Professional PDF. Our researchers have carefully researched and created these slides with all aspects taken into consideration. This is a completely customizable Price Leadership Technique Dashboard To Track Product Sales Performance Professional PDF that is available for immediate downloading. Download now and make an impact on your audience. Highlight the attractive features available with our PPTs.

Strategic Global Expansion Business Plan Dashboard To Analyse Sales Post Global Expansion Diagrams PDF
This slide showcase dashboard that can help organization track sales after global expansion. Its key components are sales target, target achievement, sales by channel, inventory days outstanding, sales growth, gross profit, gross profit margin etc. Presenting this PowerPoint presentation, titled Strategic Global Expansion Business Plan Dashboard To Analyse Sales Post Global Expansion Diagrams PDF, with topics curated by our researchers after extensive research. This editable presentation is available for immediate download and provides attractive features when used. Download now and captivate your audience. Presenting this Strategic Global Expansion Business Plan Dashboard To Analyse Sales Post Global Expansion Diagrams PDF. Our researchers have carefully researched and created these slides with all aspects taken into consideration. This is a completely customizable Strategic Global Expansion Business Plan Dashboard To Analyse Sales Post Global Expansion Diagrams PDF that is available for immediate downloading. Download now and make an impact on your audience. Highlight the attractive features available with our PPTs.

Retail Store Data Map Dashboard Ppt PowerPoint Presentation Gallery Display PDF
This slide shows retail store data inventory dashboard. It provides information such as units sold, on hand, stock availability, top selling items, average inventory value by product category, etc. Pitch your topic with ease and precision using this Retail Store Data Map Dashboard Ppt PowerPoint Presentation Gallery Display PDF. This layout presents information on Inventory Turn, Over Ratio, Gross Margin ROI. It is also available for immediate download and adjustment. So, changes can be made in the color, design, graphics or any other component to create a unique layout.

Building Innovation Capabilities And USP Detection Marketing KPI And Dashboard Ppt Infographic Template Pictures PDF
Show your sale and financial highlights of through our dashboard. Deliver an awe-inspiring pitch with this creative building innovation capabilities and usp detection marketing kpi and dashboard ppt infographic template pictures pdf bundle. Topics like revenue per acquisition, per acquisition, marketing spend, total revenu, leads, acquisitions, profit, return on investment can be discussed with this completely editable template. It is available for immediate download depending on the needs and requirements of the user.
