AI PPT Maker
Templates
PPT Bundles
Design Services
Business PPTs
Business Plan
Management
Strategy
Introduction PPT
Roadmap
Self Introduction
Timelines
Process
Marketing
Agenda
Technology
Medical
Startup Business Plan
Cyber Security
Dashboards
SWOT
Proposals
Education
Pitch Deck
Digital Marketing
KPIs
Project Management
Product Management
Artificial Intelligence
Target Market
Communication
Supply Chain
Google Slides
Research Services
 One Pagers
All Categories
-
Home
- Customer Favorites
- Process Loop
Process Loop

Comparison Based On Criteria Ppt PowerPoint Presentation Show Background Image
This is a comparison based on criteria ppt powerpoint presentation show background image. This is a seven stage process. The stages in this process are revenue, market share, main activity, number of employees, product quality, insert your own text.
Our Offerings To Company Xx Ppt PowerPoint Presentation Icon Background Images
This is a our offerings to company xx ppt powerpoint presentation icon background images. This is a four stage process. The stages in this process are business, new product launch deck, buyer personal, market sizing, investor pitch deck.

Column Chart Ppt PowerPoint Presentation Styles Graphics Design
This is a column chart ppt powerpoint presentation styles graphics design. This is a two stage process. The stages in this process are expenditure in, product, years, growth, success.
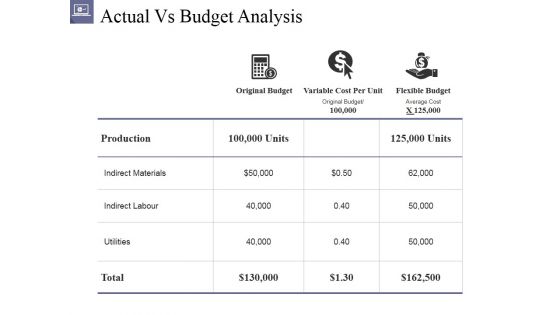
Actual Vs Budget Analysis Ppt PowerPoint Presentation Layouts Slide Download
This is a actual vs budget analysis ppt powerpoint presentation layouts slide download. This is a three stage process. The stages in this process are production, utilities, original budget, indirect labour, total.

Column Chart Ppt PowerPoint Presentation File Summary
This is a column chart ppt powerpoint presentation file summary. This is a two stage process. The stages in this process are product, dollars, in years, bar graph, growth.
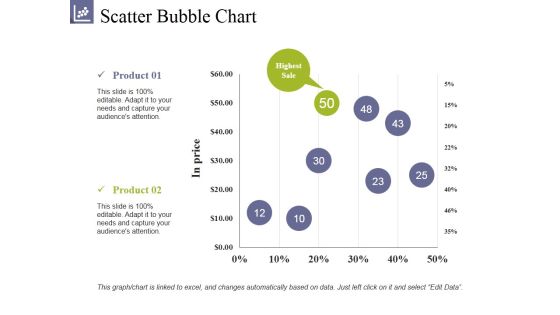
Scatter Bubble Chart Ppt PowerPoint Presentation Summary Clipart
This is a scatter bubble chart ppt powerpoint presentation summary clipart. This is a two stage process. The stages in this process are product, highest sale, in prices, growth, success.

Comparison Based On Criteria Ppt PowerPoint Presentation File Templates
This is a comparison based on criteria ppt powerpoint presentation file templates. This is a seven stage process. The stages in this process are revenue, market share, main activity, number of employees, product quality, insert your own text.

Competitor Description Ppt PowerPoint Presentation Infographics Good
This is a competitor description ppt powerpoint presentation infographics good. This is a four stage process. The stages in this process are business, turnover, top product, employees, main competitors.
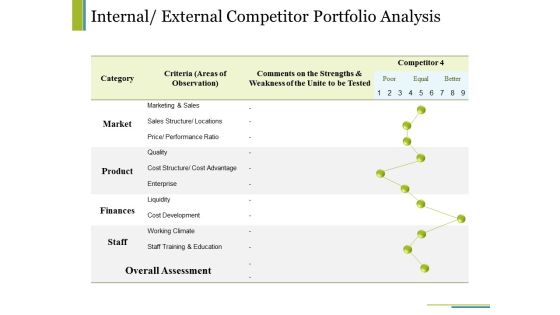
Internal External Competitor Portfolio Analysis Ppt PowerPoint Presentation Infographic Template Example
This is a internal external competitor portfolio analysis ppt powerpoint presentation infographic template example. This is a three stage process. The stages in this process are market, product, finances, staff, category.

Activity Analysis Ppt PowerPoint Presentation Gallery Guide
This is a activity analysis ppt powerpoint presentation gallery guide. This is a two stage process. The stages in this process are survey, customer surveys, product testers, acquisition, monitoring.

Comparison Based On Criteria Ppt PowerPoint Presentation Model Layouts
This is a comparison based on criteria ppt powerpoint presentation model layouts. This is a seven stage process. The stages in this process are revenue, profit, market share, main activity, product quality.
Internal External Competitor Portfolio Analysis Ppt PowerPoint Presentation Icon Background
This is a internal external competitor portfolio analysis ppt powerpoint presentation icon background. This is a three stage process. The stages in this process are category, market, product, finances, staff.

Column Chart Ppt PowerPoint Presentation Ideas Vector
This is a column chart ppt powerpoint presentation ideas vector. This is a two stage process. The stages in this process are column chart, product, financial years, sales in percentage, growth.

High Low Close Chart Ppt PowerPoint Presentation Portfolio Topics
This is a high low close chart ppt powerpoint presentation portfolio topics. This is a three stage process. The stages in this process are product, market size, in years, success, bar graph.

Radar Chart Ppt PowerPoint Presentation Inspiration Infographic Template
This is a radar chart ppt powerpoint presentation inspiration infographic template. This is a two stage process. The stages in this process are radar chart, product, business, finance, marketing.
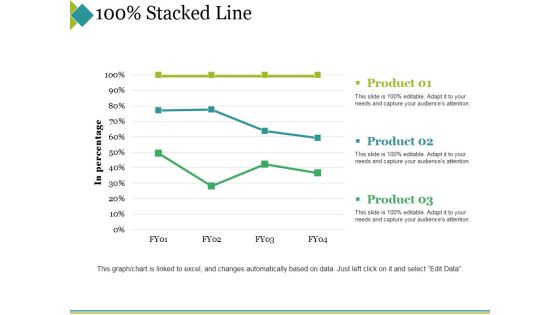
Stacked Line Ppt PowerPoint Presentation Professional Background Designs
This is a stacked line ppt powerpoint presentation professional background designs. This is a three stage process. The stages in this process are product, in percentage, stacked line, finance, business.

Column Chart Ppt PowerPoint Presentation Pictures Graphic Images
This is a column chart ppt powerpoint presentation pictures graphic images. This is a two stage process. The stages in this process are product, years, growth, success, bar graph.

Scatter Line Ppt PowerPoint Presentation Professional Design Inspiration
This is a scatter line ppt powerpoint presentation professional design inspiration. This is a one stage process. The stages in this process are product, sales in percentage, dollar in millions.

Revenue Streams Ppt PowerPoint Presentation Portfolio Slide Download
This is a revenue streams ppt powerpoint presentation portfolio slide download. This is a four stage process. The stages in this process are partner commission, selling in house products, supplier commission, later, revenue streams.

Actual Vs Budget Analysis Ppt PowerPoint Presentation Slides Templates
This is a actual vs budget analysis ppt powerpoint presentation slides templates. This is a three stage process. The stages in this process are production, original budget, variable cost per unit, flexible budget, business.

Actual Vs Budget Analysis Ppt PowerPoint Presentation Gallery Master Slide
This is a actual vs budget analysis ppt powerpoint presentation gallery master slide. This is a three stage process. The stages in this process are original budget, flexible cost, indirect labour, utilities, production.

Area Chart Ppt PowerPoint Presentation Infographics Good
This is a area chart ppt powerpoint presentation infographics good. This is a two stage process. The stages in this process are sales in percentage, product, area chart, business, percentage.

Column Chart Ppt PowerPoint Presentation Gallery Portfolio
This is a column chart ppt powerpoint presentation gallery portfolio. This is a two stage process. The stages in this process are in months, product, column chart, growth, success.

Line Chart Ppt PowerPoint Presentation Slides Mockup
This is a line chart ppt powerpoint presentation slides mockup. This is a two stage process. The stages in this process are in percentage, in years, product, growth, success.

Radar Chart Ppt PowerPoint Presentation Infographics Visual Aids
This is a radar chart ppt powerpoint presentation infographics visual aids. This is a two stage process. The stages in this process are radar chart, product, finance, business, marketing.
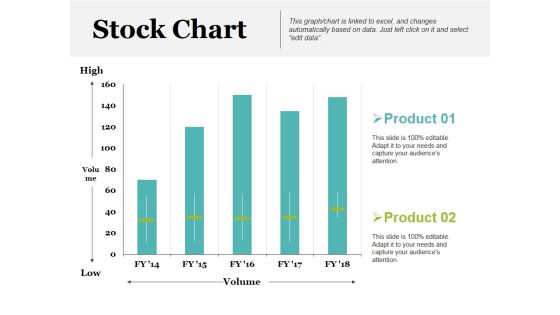
Stock Chart Ppt PowerPoint Presentation Inspiration Example Introduction
This is a stock chart ppt powerpoint presentation inspiration example introduction. This is a two stage process. The stages in this process are product, high, volume, low, stock chart.

Bar Chart Ppt PowerPoint Presentation Model Picture
This is a bar chart ppt powerpoint presentation model picture. This is a two stage process. The stages in this process are product, sales in percentage, financial years, bar chart.
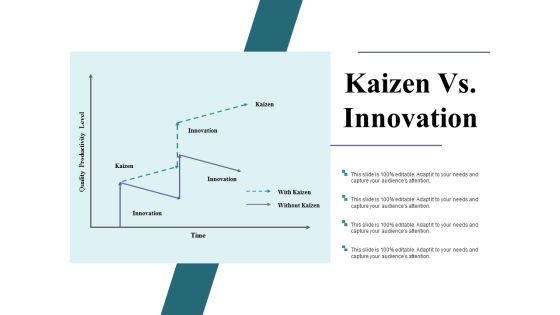
Kaizen Vs Innovation Ppt PowerPoint Presentation Slides Download
This is a kaizen vs innovation ppt powerpoint presentation slides download. This is a four stage process. The stages in this process are kaizen, innovation, time, quality productivity level, without kaizen.
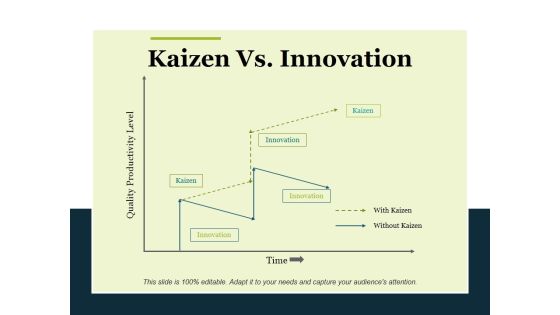
Kaizen Vs Innovation Ppt PowerPoint Presentation Model Graphic Images
This is a kaizen vs innovation ppt powerpoint presentation model graphic images. This is a five stage process. The stages in this process are quality productivity level, kaizen, innovation, time, business.

Donut Pie Chart Ppt PowerPoint Presentation Visual Aids Model
This is a donut pie chart ppt powerpoint presentation visual aids model. This is a four stage process. The stages in this process are product, percentage, finance, donut, business.
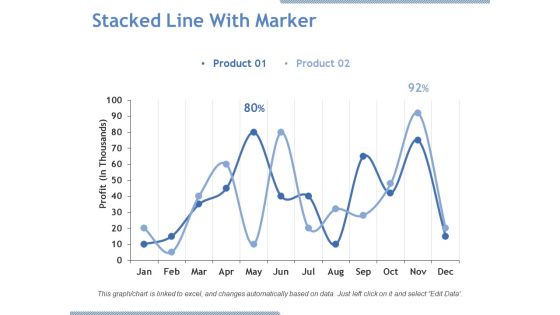
Stacked Line With Marker Ppt PowerPoint Presentation Pictures Graphics Download
This is a stacked line with marker ppt powerpoint presentation pictures graphics download. This is a two stage process. The stages in this process are product, profit, line chart, business, growth.

Area Chart Ppt PowerPoint Presentation Infographic Template Model
This is a area chart ppt powerpoint presentation infographic template model. This is a two stage process. The stages in this process are product, area chart, growth, percentage, success.

Bar Chart Ppt PowerPoint Presentation Ideas Deck
This is a bar chart ppt powerpoint presentation ideas deck. This is a two stage process. The stages in this process are product, in percentage, in years, financial, business.

Clustered Column Ppt PowerPoint Presentation Pictures Graphics Template
This is a clustered column ppt powerpoint presentation pictures graphics template. This is a two stage process. The stages in this process are product, growth, success, business, bar graph.

Clustered Column Line Ppt PowerPoint Presentation Topics
This is a clustered column line ppt powerpoint presentation topics. This is a three stage process. The stages in this process are product, in percentage, growth, bar graph, business.

Column Chart Ppt PowerPoint Presentation Infographics Guidelines
This is a column chart ppt powerpoint presentation infographics guidelines. This is a two stage process. The stages in this process are product, expenditure in, years, business, bar graph.
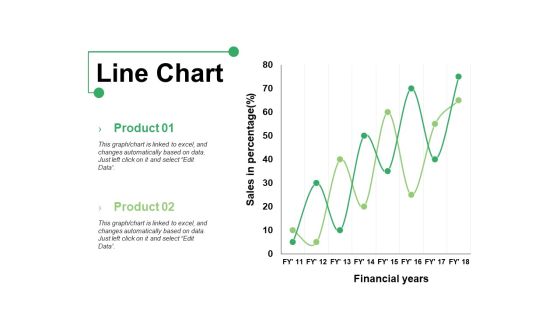
Line Chart Ppt PowerPoint Presentation Show Graphics Example
This is a line chart ppt powerpoint presentation show graphics example. This is a two stage process. The stages in this process are product, line chart, financial years, sales in percentage.

Bar Chart Ppt PowerPoint Presentation Infographics Format Ideas
This is a bar chart ppt powerpoint presentation infographics format ideas. This is a two stage process. The stages in this process are bar graph, product, financial year, sales in percentage.

Stacked Line Ppt PowerPoint Presentation Pictures Example Topics
This is a stacked line ppt powerpoint presentation pictures example topics. This is a three stage process. The stages in this process are product, in percentage, stacked line, business, marketing.

Column Chart Ppt PowerPoint Presentation Layouts Vector
This is a column chart ppt powerpoint presentation layouts vector. This is a two stage process. The stages in this process are product, column chart, bar graph, percentage, finance.

Line Chart Ppt PowerPoint Presentation Professional Grid
This is a line chart ppt powerpoint presentation professional grid. This is a two stage process. The stages in this process are sales in percentage, financial years, product, line chart.

Area Chart Ppt PowerPoint Presentation Show Professional
This is a area chart ppt powerpoint presentation show professional. This is a two stage process. The stages in this process are product, in percentage, area chart, growth, success.

Business Performance Ppt PowerPoint Presentation File Graphics
This is a business performance ppt powerpoint presentation file graphics. This is a four stage process. The stages in this process are business highlights, financial summary, revenue split by geography, revenue split by products.

Clustered Bar Ppt PowerPoint Presentation File Display
This is a clustered bar ppt powerpoint presentation file display. This is a three stage process. The stages in this process are product, clustered bar, unit count, business, marketing.

Combo Chart Ppt PowerPoint Presentation Pictures Summary
This is a combo chart ppt powerpoint presentation pictures summary. This is a three stage process. The stages in this process are product, market size, growth rate, bar graph, success.

Line Chart Ppt PowerPoint Presentation Infographic Template Design Ideas
This is a line chart ppt powerpoint presentation infographic template design ideas. This is a two stage process. The stages in this process are product, in millions, percentage, line chart, success.

Comparison Based On Criteria Ppt PowerPoint Presentation Infographic Template Graphic Tips
This is a comparison based on criteria ppt powerpoint presentation infographic template graphic tips. This is a seven stage process. The stages in this process are revenue, market share, main activity, number of employee, product quality.

Area Chart Ppt PowerPoint Presentation Inspiration Graphics
This is a area chart ppt powerpoint presentation inspiration graphics. This is a two stage process. The stages in this process are product, area chart, business, growth, sales in percentage.

Brand Position Ppt PowerPoint Presentation Infographic Template Layout
This is a brand position ppt powerpoint presentation infographic template layout. This is a five stage process. The stages in this process are own product, quality, competitor, value proposition.

Establish Brand Positioning Ppt PowerPoint Presentation Show Infographic Template
This is a establish brand positioning ppt powerpoint presentation show infographic template. This is a four stage process. The stages in this process are target customers, key benefits, price, value proposition, company and product.
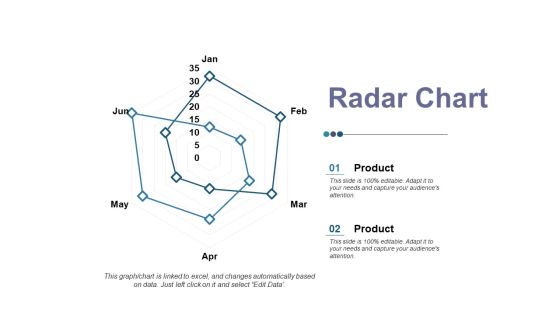
Radar Chart Ppt PowerPoint Presentation Professional Master Slide
This is a radar chart ppt powerpoint presentation professional master slide. This is a two stage process. The stages in this process are product, radar chart, financial, business, shape.
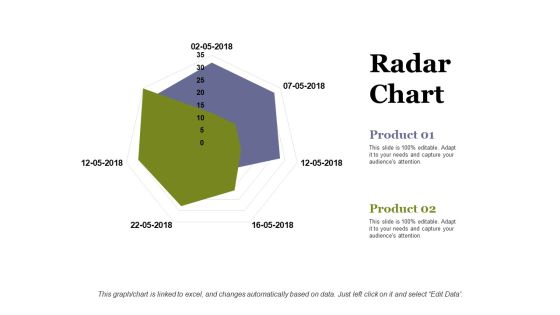
Radar Chart Ppt PowerPoint Presentation Infographic Template Information
This is a radar chart ppt powerpoint presentation infographic template information. This is a two stage process. The stages in this process are radar chart, product, business, marketing, shape.

Stacked Line Template 1 Ppt PowerPoint Presentation Infographic Template Graphics
This is a stacked line template 1 ppt powerpoint presentation infographic template graphics. This is a three stage process. The stages in this process are product, unit count, in years, business, marketing.

Stacked Line Ppt PowerPoint Presentation Infographics Vector
This is a stacked line ppt powerpoint presentation infographics vector. This is a three stage process. The stages in this process are product, stacked line, business, marketing, in percentage.
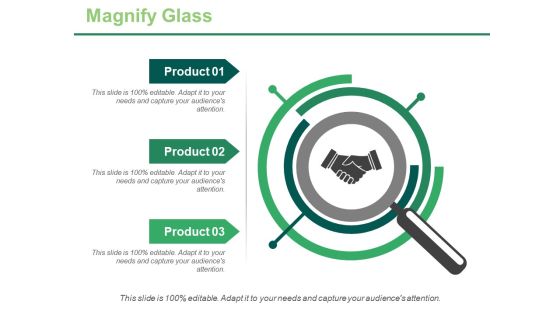
Magnify Glass Ppt PowerPoint Presentation Professional Example Topics
This is a magnify glass ppt powerpoint presentation professional example topics. This is a three stage process. The stages in this process are magnifier glass, research, business, focus, product.

Radar Chart Ppt PowerPoint Presentation Portfolio Graphics Template
This is a radar chart ppt powerpoint presentation portfolio graphics template. This is a two stage process. The stages in this process are product, finance, shape, radar chart, business.

Demand Acceleration Framework Ppt PowerPoint Presentation Pictures Background Images
This is a demand acceleration framework ppt powerpoint presentation pictures background images. This is a three stage process. The stages in this process are paid acquisition, product marketing, marketing operation.

Stacked Area Clustered Column Ppt PowerPoint Presentation Gallery Gridlines
This is a stacked area clustered column ppt powerpoint presentation gallery gridlines. This is a three stage process. The stages in this process are bar graph, product, in percentage.

Donut Pie Chart Ppt PowerPoint Presentation Pictures Layout Ideas
This is a donut pie chart ppt powerpoint presentation pictures layout ideas. This is a four stage process. The stages in this process are percentage, finance, donut, business, product.

Line Chart Ppt PowerPoint Presentation Infographic Template Master Slide
This is a line chart ppt powerpoint presentation infographic template master slide. This is a two stage process. The stages in this process are product, financial years, sales in percentage.

Bar Chart Ppt PowerPoint Presentation Slides Example File
This is a bar chart ppt powerpoint presentation slides example file. This is a two stage process. The stages in this process are product, financial years, sales in percentage.

Bar Graph Ppt PowerPoint Presentation Portfolio Slide Portrait
This is a bar graph ppt powerpoint presentation portfolio slide portrait. This is a three stage process. The stages in this process are product, sales in percentage, bar graph, growth, success.

Segmentation Evaluation Segment Size And Growth Potential Ppt PowerPoint Presentation Pictures Microsoft
This is a segmentation evaluation segment size and growth potential ppt powerpoint presentation pictures microsoft. This is a four stage process. The stages in this process are nutrition and healthcare, beverages, milk products, confectionary.
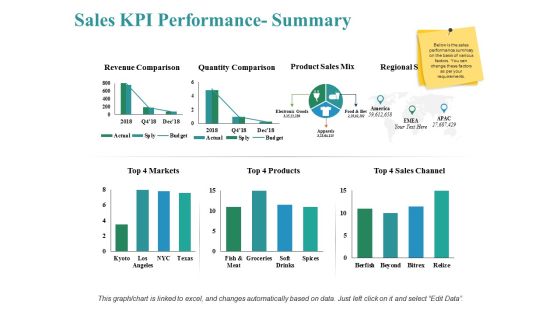
Sales Kpi Performance Summary Ppt PowerPoint Presentation Show Themes
This is a sales kpi performance summary ppt powerpoint presentation show themes. This is a three stage process. The stages in this process are revenue comparison, quantity comparison, product sales mix, markets, sales channel.
Sales Kpi Tracker Ppt PowerPoint Presentation Pictures Layout Ideas
This is a sales kpi tracker ppt powerpoint presentation pictures layout ideas. This is a four stage process. The stages in this process are opportunities won, top products in revenue, leads created, win ratio vs last yr, open deals vs.
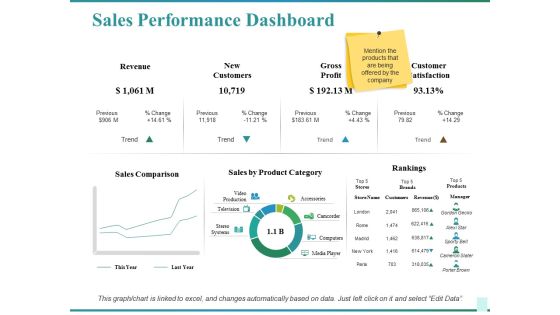
Sales Performance Dashboard Ppt PowerPoint Presentation Show Graphics Design
This is a sales performance dashboard ppt powerpoint presentation show graphics design. This is a two stage process. The stages in this process are sales comparison, sales by product category, rankings, customer satisfaction, revenue.
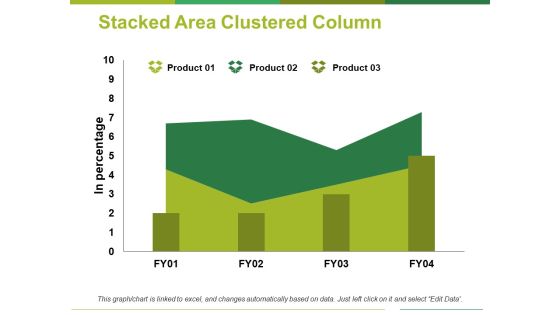
Stacked Area Clustered Column Ppt PowerPoint Presentation Professional Clipart
This is a stacked area clustered column ppt powerpoint presentation professional clipart. This is a three stage process. The stages in this process are product, in percentage, area chart.

Customer Success Vs Customer Service Ppt PowerPoint Presentation Summary Objects
This is a customer success vs customer service ppt powerpoint presentation summary objects. This is a two stage process. The stages in this process are proactive, customer goal achievement, driving customer value from product, long term perspective, revenue generating.

Clustered Column Ppt PowerPoint Presentation Infographic Template Backgrounds
This is a clustered column ppt powerpoint presentation infographic template backgrounds. This is a two stage process. The stages in this process are sales in percentage, financial year, product.

Market Analysis Summary Ppt PowerPoint Presentation Inspiration
This is a market analysis summary ppt powerpoint presentation inspiration. This is a three stage process. The stages in this process are to frame your idea or product, to illuminate the environmental factors.

Deadly Wastes Lean Downtime Ppt PowerPoint Presentation Slides Objects
This is a deadly wastes lean downtime ppt powerpoint presentation slides objects. This is a eight stage process. The stages in this process are waiting, over production, transport, inventory, motion.

Deadly Wastes Lean Manufacturing Ppt PowerPoint Presentation Professional Structure
This is a deadly wastes lean manufacturing ppt powerpoint presentation professional structure. This is a eight stage process. The stages in this process are waiting, over production, transport, inventory, motion.

Scatter Line Ppt PowerPoint Presentation Styles Graphics Pictures
This is a scatter line ppt powerpoint presentation styles graphics pictures. This is a one stage process. The stages in this process are product, dollar in millions, sales in percentage.
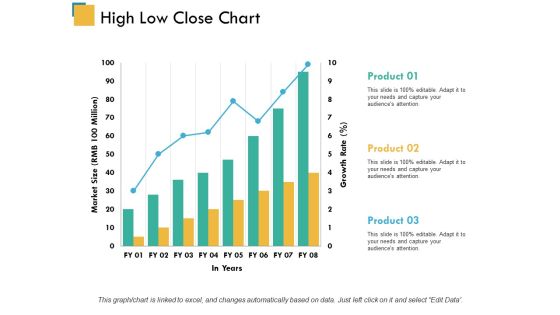
High Low Close Chart Ppt PowerPoint Presentation Model Inspiration
This is a high low close chart ppt powerpoint presentation model inspiration. This is a three stage process. The stages in this process are product, market size, in years.

Performance Evaluation Parameters Ppt PowerPoint Presentation Ideas Inspiration
This is a performance evaluation parameters ppt powerpoint presentation ideas inspiration. This is a two stage process. The stages in this process are dependability, productivity, service rating, evaluation item, personality.

Radar Chart Ppt PowerPoint Presentation Professional Infographic Template
This is a radar chart ppt powerpoint presentation professional infographic template. This is a two stage process. The stages in this process are product, finance, shape, radar chart, business.
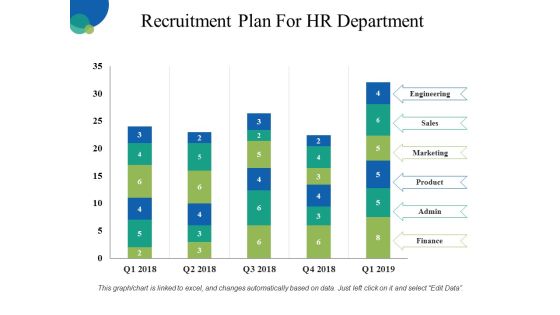
Recruitment Plan For HR Department Ppt PowerPoint Presentation Inspiration Layout Ideas
This is a recruitment plan for hr department ppt powerpoint presentation inspiration layout ideas. This is a five stage process. The stages in this process are engineering, sales, marketing, product, finance.

Deadly Wastes Lean Downtime Ppt PowerPoint Presentation Layout
This is a deadly wastes lean downtime ppt powerpoint presentation layout. This is a eight stage process. The stages in this process are over production, waiting, inventory, motion, transport.
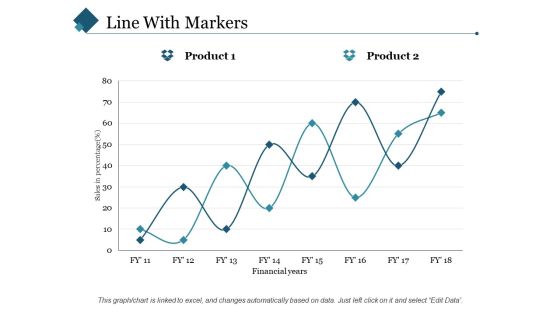
Line With Markers Ppt PowerPoint Presentation Styles Slide Portrait
This is a line with markers ppt powerpoint presentation styles slide portrait. This is a two stage process. The stages in this process are sales in percentage, financial years, product.

Stacked Area Clustered Column Ppt PowerPoint Presentation Layouts Templates
This is a stacked area clustered column ppt powerpoint presentation layouts templates. This is a three stage process. The stages in this process are product, in percentage, area chart.

Combo Chart Ppt PowerPoint Presentation Pictures Objects
This is a combo chart ppt powerpoint presentation pictures objects. This is a three stage process. The stages in this process are product, combo chart, in years, market size.

Scatter Line Ppt PowerPoint Presentation Infographics Background Images
This is a scatter line ppt powerpoint presentation infographics background images. This is a one stage process. The stages in this process are dollar in millions, product, sales in percentage.
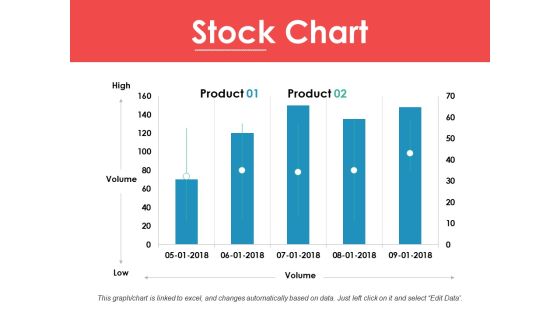
Stock Chart Ppt PowerPoint Presentation Ideas Infographic Template
This is a stock chart ppt powerpoint presentation ideas infographic template. This is a two stage process. The stages in this process are high, volume, low, product, stock chart.

Company Sales And Performance Dashboard Ppt PowerPoint Presentation Show Structure
This is a company sales and performance dashboard ppt powerpoint presentation show structure. This is a four stage process. The stages in this process are year product sales, month growth in revenue, profit margins graph, year profits.
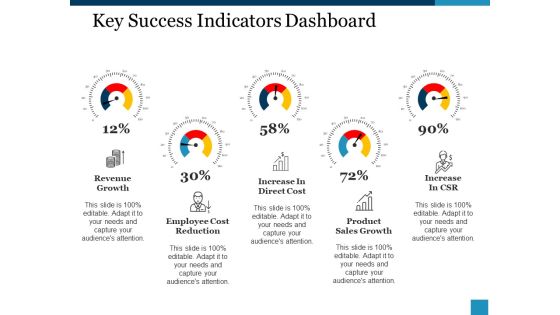
Key Success Indicators Dashboard Ppt PowerPoint Presentation Inspiration Guide
This is a key success indicators dashboard ppt powerpoint presentation inspiration guide. This is a five stage process. The stages in this process are revenue growth, increase in direct cost, increase in csr, employee cost reduction, product, sales growth.

Recruitment Plan For Hr Department Ppt PowerPoint Presentation Show
This is a recruitment plan for hr department ppt powerpoint presentation show. This is a five stage process. The stages in this process are engineering, sales, marketing, product, finance.

Targets For The Next Business Quarter Ppt PowerPoint Presentation Layouts Objects
This is a targets for the next business quarter ppt powerpoint presentation layouts objects. This is a four stage process. The stages in this process are expand in a new location, increase core product sales by, our goals, achievement.

Area Chart Ppt PowerPoint Presentation Icon Summary
This is a area chart ppt powerpoint presentation icon summary. This is a two stage process. The stages in this process are financial year, area chart, in percentage, product.

Combo Chart Ppt PowerPoint Presentation Model Microsoft
This is a combo chart ppt powerpoint presentation model microsoft. This is a three stage process. The stages in this process are combo chart, product, market size, growth rate.

Area Stacked Ppt PowerPoint Presentation Infographics Shapes
This is a area stacked ppt powerpoint presentation infographics shapes. This is a two stage process. The stages in this process are product, area stacked, sales in percentage, financial year.

Bar Graph Ppt PowerPoint Presentation Infographic Template Demonstration
This is a bar graph ppt powerpoint presentation infographic template demonstration. This is a two stage process. The stages in this process are bar graph, product, sales, percentage, financial.
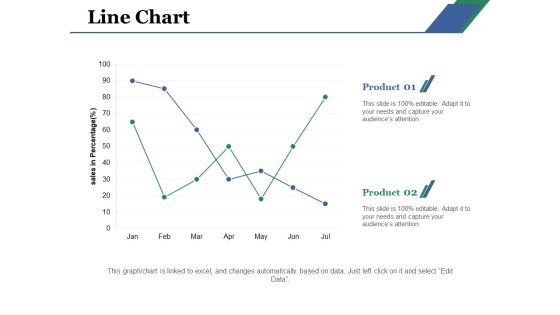
Line Chart Ppt PowerPoint Presentation Layouts Example File
This is a line chart ppt powerpoint presentation layouts example file. This is a two stage process. The stages in this process are line chart, product, business, sales, analysis.
Stacked Column Ppt PowerPoint Presentation Icon Inspiration
This is a stacked column ppt powerpoint presentation icon inspiration. This is a two stage process. The stages in this process are stacked column, product, sales, growth, sales in percentage.

Clustered Column Ppt PowerPoint Presentation Icon Objects
This is a clustered column ppt powerpoint presentation icon objects. This is a two stage process. The stages in this process are clustered column, product, growth, finance, bar graph.
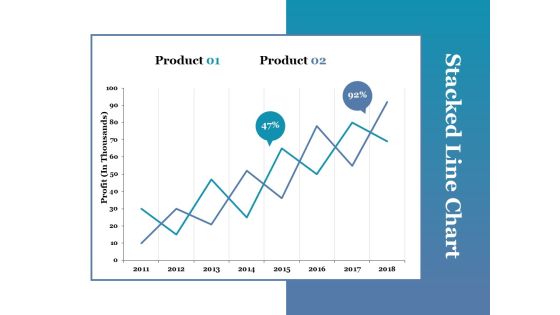
Stacked Line Chart Ppt PowerPoint Presentation Portfolio Picture
This is a stacked line chart ppt powerpoint presentation portfolio picture. This is a two stage process. The stages in this process are stacked line chart, product, profit, growth.
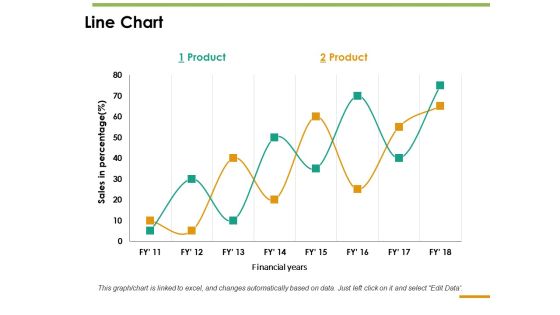
Line Chart Ppt PowerPoint Presentation Inspiration Guide
This is a line chart ppt powerpoint presentation inspiration guide. This is a two stage process. The stages in this process are line chart, sales in percentage, product, financial years.

Area Chart Ppt PowerPoint Presentation Icon Show
This is a area chart ppt powerpoint presentation icon show. This is a two stage process. The stages in this process are product, financial year, in percentage, area chart.

Combo Chart Ppt PowerPoint Presentation Gallery Diagrams
This is a combo chart ppt powerpoint presentation gallery diagrams. This is a three stage process. The stages in this process are combo chart, market size, product, in years, growth rate.

Stacked Area Clustered Column Ppt PowerPoint Presentation Summary Slides
This is a stacked area clustered column ppt powerpoint presentation summary slides. This is a three stage process. The stages in this process are product, in percentage, financial year, bar graph.

Open High Low Close Ppt PowerPoint Presentation Layouts Summary
This is a open high low close ppt powerpoint presentation layouts summary. This is a two stage process. The stages in this process are high, low, close, product, open.

Column Chart Ppt PowerPoint Presentation Portfolio Example Topics
This is a column chart ppt powerpoint presentation portfolio example topics. This is a two stage process. The stages in this process are product, financial year, sales in percentage, column chart.
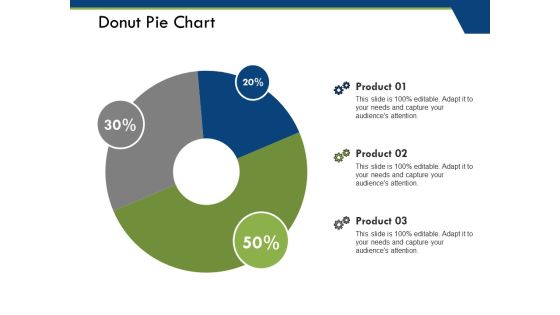
Donut Pie Chart Ppt PowerPoint Presentation Pictures File Formats
This is a donut pie chart ppt powerpoint presentation pictures file formats. This is a three stage process. The stages in this process are product, donut pie chart, percentage, business, marketing.
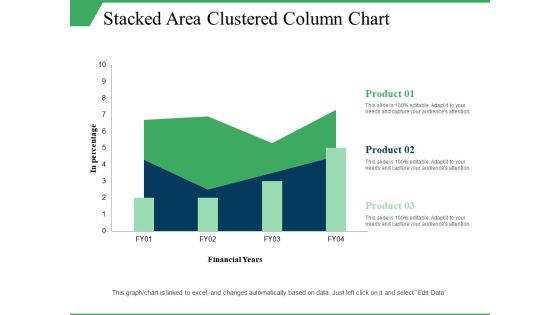
Stacked Area Clustered Column Chart Ppt PowerPoint Presentation Visual Aids Model
This is a stacked area clustered column chart ppt powerpoint presentation visual aids model. This is a three stage process. The stages in this process are in percentage, product, financial years, growth, column chart.
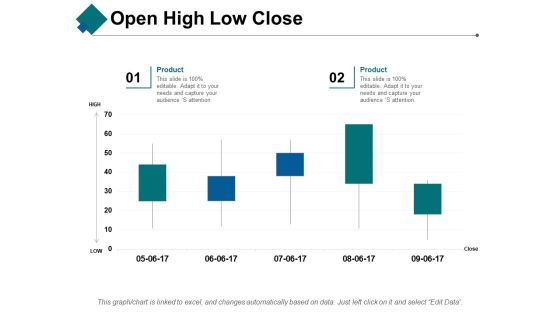
Open High Low Close Ppt PowerPoint Presentation Show Aids
This is a open high low close ppt powerpoint presentation show aids. This is a two stage process. The stages in this process are open, high, low, close, product.

Area Chart Ppt PowerPoint Presentation Inspiration Icons Ppt PowerPoint Presentation Professional File Formats
This is a area chart ppt powerpoint presentation inspiration icons ppt powerpoint presentation professional file formats. This is a two stage process. The stages in this process are area chart, product, percentage, business, growth.

Column Chart Ppt PowerPoint Presentation Icon Show
This is a column chart ppt powerpoint presentation icon show. This is a two stage process. The stages in this process are column chart, product, years, bar graph, growth.

Volume Open High Low Close Ppt PowerPoint Presentation Slides Maker
This is a volume open high low close ppt powerpoint presentation slides maker. This is a two stage process. The stages in this process are volume, open, high, low, close, product.
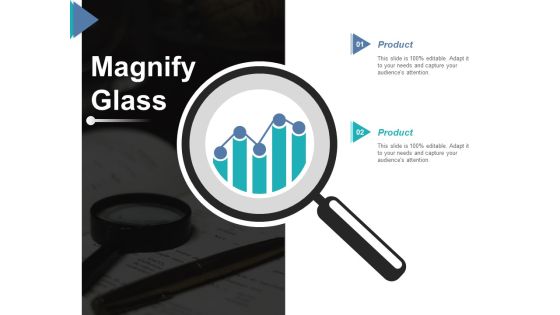
Magnify Glass Ppt PowerPoint Presentation Summary Example Topics
This is a magnify glass ppt powerpoint presentation summary example topics. This is a two stage process. The stages in this process are magnify glass, product, technology, business, marketing.

Open High Low Close Ppt PowerPoint Presentation Model Good
This is a open high low close ppt powerpoint presentation model good. This is a two stage process. The stages in this process are open, high, low, close, product.
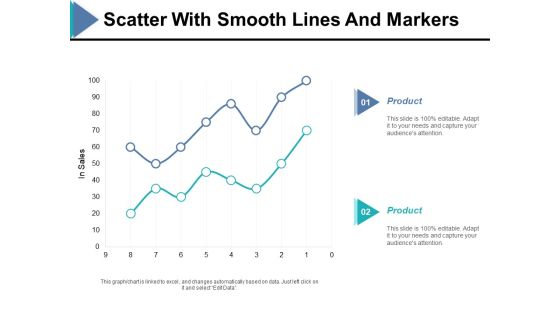
Scatter With Smooth Lines And Markers Ppt PowerPoint Presentation Ideas Example
This is a scatter with smooth lines and markers ppt powerpoint presentation ideas example. This is a two stage process. The stages in this process are in sales, finance, bar graph, product, business.

Stacked Bar Ppt PowerPoint Presentation Model Graphics
This is a stacked bar ppt powerpoint presentation model graphics. This is a two stage process. The stages in this process are stacked bar, product, chart and graph, finance, business.

Clustered Column Chart Ppt PowerPoint Presentation Model Deck
This is a clustered column chart ppt powerpoint presentation model deck. This is a three stage process. The stages in this process are clustered column chart, product, finance, profit, business.

Clustered Bar Ppt PowerPoint Presentation Gallery Inspiration
This is a clustered bar ppt powerpoint presentation gallery inspiration. This is a four stage process. The stages in this process are clustered bar, product, profit, business, bar graph.

Stacked Line Chart Ppt PowerPoint Presentation Model Show
This is a stacked line chart ppt powerpoint presentation model show. This is a two stage process. The stages in this process are stacked line chart, product, profit, percentage, growth.

Combo Chart Ppt PowerPoint Presentation Summary Graphic Images
This is a combo chart ppt powerpoint presentation summary graphic images. This is a three stage process. The stages in this process are combo chart, product, growth, marketing, business.
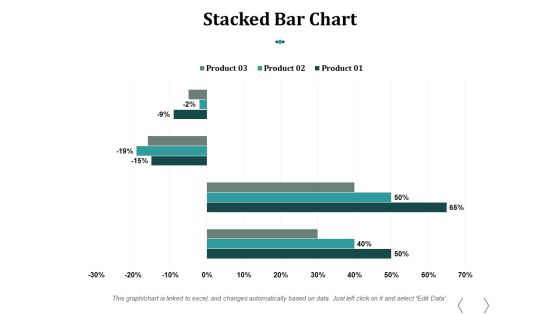
Stacked Bar Chart Ppt PowerPoint Presentation Influencers
This is a stacked bar chart ppt powerpoint presentation influencers. This is a three stage process. The stages in this process are stacked bar chart, product, percentage, finance, business.

Bar Graph Ppt PowerPoint Presentation Styles Skills
This is a bar graph ppt powerpoint presentation styles skills. This is a two stage process. The stages in this process are bar graph, product, in year, in percentage, business.

Stacked Column Chart Ppt PowerPoint Presentation Summary Gallery
This is a stacked column chart ppt powerpoint presentation summary gallery. This is a two stage process. The stages in this process are stacked column chart, product, in years, growth, percentage.

Column Chart Ppt PowerPoint Presentation Layouts File Formats
This is a column chart ppt powerpoint presentation layouts file formats. This is a three stage process. The stages in this process are column chart, product, in percentage, year, finance.
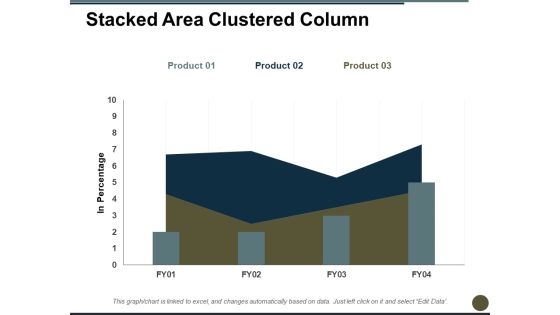
Stacked Area Clustered Column Ppt PowerPoint Presentation Professional Graphics
This is a stacked area clustered column ppt powerpoint presentation professional graphics. This is a three stage process. The stages in this process are in percentage, bar chart, product, growth, year.
