Process Flowchart

5X5 Puzzle Matrix For Competitive Analysis Ppt PowerPoint Presentation Summary Microsoft
This is a 5x5 puzzle matrix for competitive analysis ppt powerpoint presentation summary microsoft. This is a five stage process. The stages in this process are 2x2 matrix, 2x2 table.

6X6 Puzzle Matrix For Competitive Analysis Ppt PowerPoint Presentation Infographic Template Format
This is a 6x6 puzzle matrix for competitive analysis ppt powerpoint presentation infographic template format. This is a six stage process. The stages in this process are 2x2 matrix, 2x2 table.

7X7 Puzzle Matrix For Competitive Analysis Ppt PowerPoint Presentation Inspiration Template
This is a 7x7 puzzle matrix for competitive analysis ppt powerpoint presentation inspiration template. This is a seven stage process. The stages in this process are 2x2 matrix, 2x2 table.

Cost Effectiveness Analysis Coins With Clock Ppt PowerPoint Presentation Summary Design Inspiration
This is a cost effectiveness analysis coins with clock ppt powerpoint presentation summary design inspiration. This is a two stage process. The stages in this process are cost planning, cost efficiency, cost organization.

Steps In Cost Effectiveness Analysis Ppt PowerPoint Presentation Summary Example File
This is a steps in cost effectiveness analysis ppt powerpoint presentation summary example file. This is a three stage process. The stages in this process are cost planning, cost efficiency, cost organization.

Six Steps For Business Growth Analysis Ppt Powerpoint Presentation Model Deck
This is a six steps for business growth analysis ppt powerpoint presentation model deck. This is a six stage process. The stages in this process are growth opportunity, growth drivers, market drivers.

Computer Screen With Pie Chart For Data Analysis Ppt PowerPoint Presentation Show Picture
This is a computer screen with pie chart for data analysis ppt powerpoint presentation show picture. This is a six stage process. The stages in this process are computer icon, desktop icon, laptop screen icon.

Business Environmental Analysis For Competitive Rivalry Ppt PowerPoint Presentation Layouts Designs
This is a business environmental analysis for competitive rivalry ppt powerpoint presentation layouts designs. This is a four stage process. The stages in this process are environmental scan, environmental study, environmental examine.

Business Environmental Analysis For Strategic Decision Making Ppt PowerPoint Presentation Professional Visuals
This is a business environmental analysis for strategic decision making ppt powerpoint presentation professional visuals. This is a two stage process. The stages in this process are environmental scan, environmental study, environmental examine.
Environmental Analysis For Strategy Formulation And Implementation Ppt PowerPoint Presentation Inspiration Icons
This is a environmental analysis for strategy formulation and implementation ppt powerpoint presentation inspiration icons. This is a three stage process. The stages in this process are environmental scan, environmental study, environmental examine.

Learning Curve Equation Knowledge Application Analysis Ppt PowerPoint Presentation Model Format
This is a learning curve equation knowledge application analysis ppt powerpoint presentation model format. This is a five stage process. The stages in this process are experience curve, learning curve.
Data Research And Analysis For Mobile Users Ppt PowerPoint Presentation Icon Inspiration
This is a data research and analysis for mobile users ppt powerpoint presentation icon inspiration. This is a four stage process. The stages in this process are mobile analytics, mobile tracking, mobile web analytics.
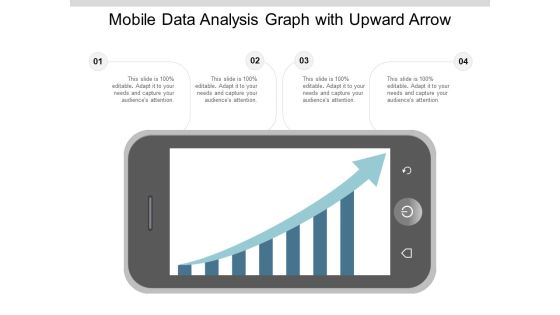
Mobile Data Analysis Graph With Upward Arrow Ppt PowerPoint Presentation Summary Styles
This is a mobile data analysis graph with upward arrow ppt powerpoint presentation summary styles. This is a four stage process. The stages in this process are mobile analytics, mobile tracking, mobile web analytics.

Smartphone Growth Trends Analysis Vector Ppt PowerPoint Presentation Summary Master Slide
This is a smartphone growth trends analysis vector ppt powerpoint presentation summary master slide. This is a four stage process. The stages in this process are mobile analytics, mobile tracking, mobile web analytics.
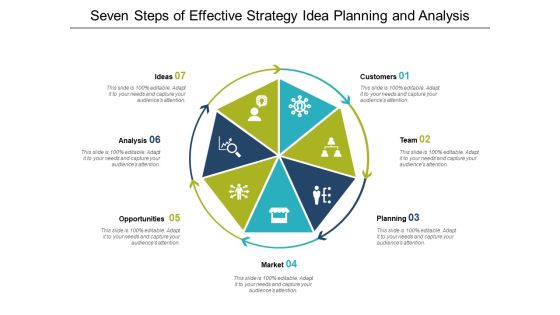
Seven Steps Of Effective Strategy Idea Planning And Analysis Ppt Powerpoint Presentation Ideas Deck
This is a seven steps of effective strategy idea planning and analysis ppt powerpoint presentation ideas deck. This is a seven stage process. The stages in this process are executive plan, executive strategy, executive approach.

Product Idea Analysis And Design Phases Ppt Powerpoint Presentation Infographics Show
This is a product idea analysis and design phases ppt powerpoint presentation infographics show. This is a seven stage process. The stages in this process are product development pipeline, product development line, product development channel.
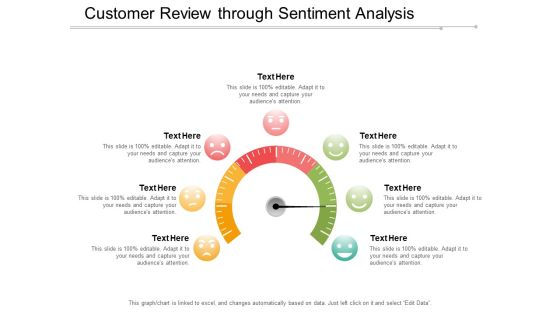
Customer Review Through Sentiment Analysis Ppt Powerpoint Presentation Show Design Templates
This is a customer review through sentiment analysis ppt powerpoint presentation show design templates. This is a six stage process. The stages in this process are feeling, emotion, sentiment.

Customer Sentiment Analysis Green Red And Yellow Faces Ppt Powerpoint Presentation Ideas Layout
This is a customer sentiment analysis green red and yellow faces ppt powerpoint presentation ideas layout. This is a three stage process. The stages in this process are feeling, emotion, sentiment.
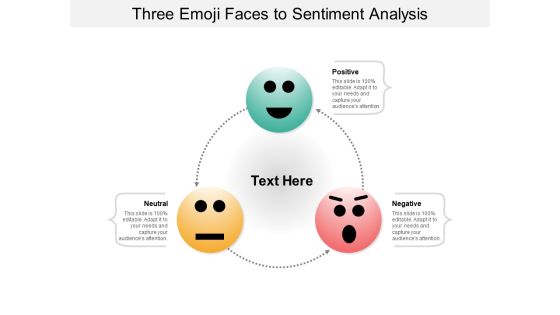
Three Emoji Faces To Sentiment Analysis Ppt Powerpoint Presentation Inspiration Gallery
This is a three emoji faces to sentiment analysis ppt powerpoint presentation inspiration gallery. This is a three stage process. The stages in this process are feeling, emotion, sentiment.

Bar Chart With Magnifying Glass For Financial Analysis Ppt Powerpoint Presentation Infographics Designs Download
This is a bar chart with magnifying glass for financial analysis ppt powerpoint presentation infographics designs download. This is a three stage process. The stages in this process are business metrics, business kpi, business dashboard.

Business Analysis Data Charts And Reports Ppt Powerpoint Presentation Ideas Portrait
This is a business analysis data charts and reports ppt powerpoint presentation ideas portrait. This is a three stage process. The stages in this process are business metrics, business kpi, business dashboard.

Financial Charts And Graphs For Statistical Analysis Ppt Powerpoint Presentation Show Layout
This is a financial charts and graphs for statistical analysis ppt powerpoint presentation show layout. This is a four stage process. The stages in this process are business metrics, business kpi, business dashboard.

Cluster Analysis Circles Connected With Centre Point Ppt Powerpoint Presentation Professional Slides
This is a cluster analysis circles connected with centre point ppt powerpoint presentation professional slides. This is a three stage process. The stages in this process are circle cluster, cyclic cluster, circular cluster.

Cluster Analysis Showing Interlinked Circles Ppt Powerpoint Presentation Gallery Design Templates
This is a cluster analysis showing interlinked circles ppt powerpoint presentation gallery design templates. This is a two stage process. The stages in this process are circle cluster, cyclic cluster, circular cluster.

Four Steps Of Market Research And Analysis Ppt PowerPoint Presentation Portfolio Visuals
This is a four steps of market research and analysis ppt powerpoint presentation portfolio visuals. This is a four stage process. The stages in this process are market size, market forecast, market potential.
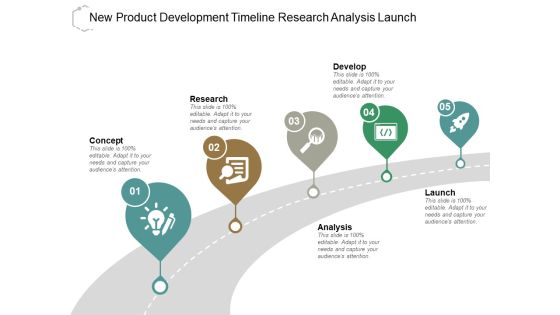
New Product Development Timeline Research Analysis Launch Ppt PowerPoint Presentation Layouts Skills
This is a new product development timeline research analysis launch ppt powerpoint presentation layouts skills. This is a five stage process. The stages in this process are product launch roadmap, introducing new product roadmap, product launch timeline.
Economic Trends Analysis Dollar Sign With Four Arrows Ppt PowerPoint Presentation Layouts Icons
This is a economic trends analysis dollar sign with four arrows ppt powerpoint presentation layouts icons. This is a four stage process. The stages in this process are stock market, financial markets, bull market.
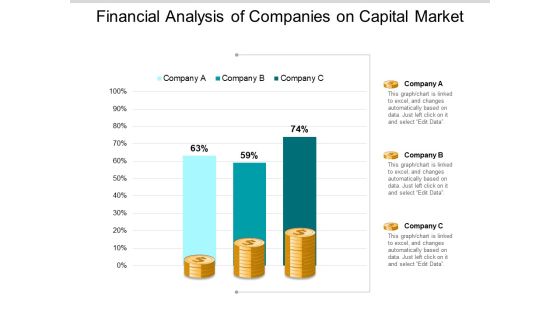
Financial Analysis Of Companies On Capital Market Ppt PowerPoint Presentation Show Background
This is a financial analysis of companies on capital market ppt powerpoint presentation show background. This is a three stage process. The stages in this process are stock market, financial markets, bull market.
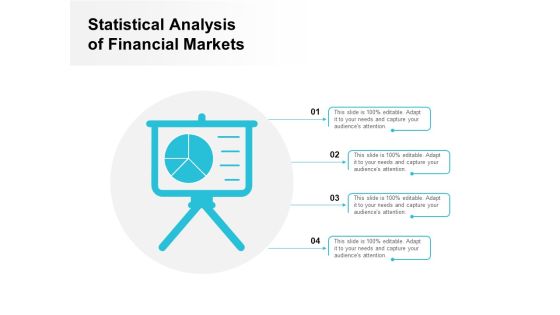
Statistical Analysis Of Financial Markets Ppt PowerPoint Presentation Model Graphic Images
This is a statistical analysis of financial markets ppt powerpoint presentation model graphic images. This is a four stage process. The stages in this process are stock market, financial markets, bull market.
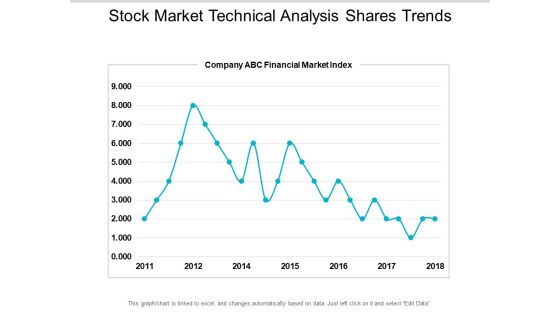
Stock Market Technical Analysis Shares Trends Ppt PowerPoint Presentation Portfolio Introduction
This is a stock market technical analysis shares trends ppt powerpoint presentation portfolio introduction. This is a seven stage process. The stages in this process are stock market, financial markets, bull market.

Financial Analysis Vector Bar Graph With Magnifying Glass Ppt PowerPoint Presentation Gallery Design Ideas
This is a financial analysis vector bar graph with magnifying glass ppt powerpoint presentation gallery design ideas. This is a four stage process. The stages in this process are marketing analytics, marketing performance, marketing discovery.
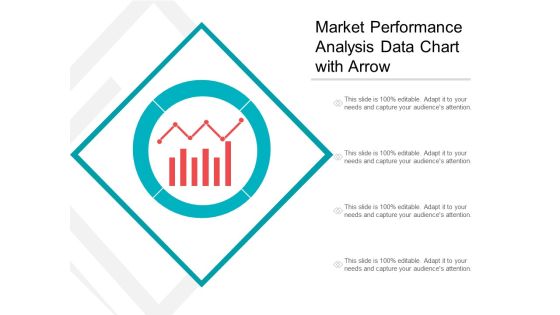
Market Performance Analysis Data Chart With Arrow Ppt PowerPoint Presentation Inspiration Graphics
This is a market performance analysis data chart with arrow ppt powerpoint presentation inspiration graphics. This is a four stage process. The stages in this process are marketing analytics, marketing performance, marketing discovery.

Business Failure Analysis Four Steps With Icons Ppt PowerPoint Presentation File Visuals
This is a business failure analysis four steps with icons ppt powerpoint presentation file visuals. This is a four stage process. The stages in this process are business failure, unsuccessful business, business non success.
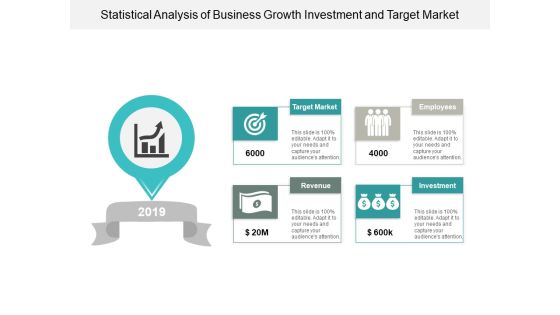
Statistical Analysis Of Business Growth Investment And Target Market Ppt PowerPoint Presentation Infographics Professional
This is a statistical analysis of business growth investment and target market ppt powerpoint presentation infographics professional. This is a four stage process. The stages in this process are year in review, yearly highlights, countdowns.
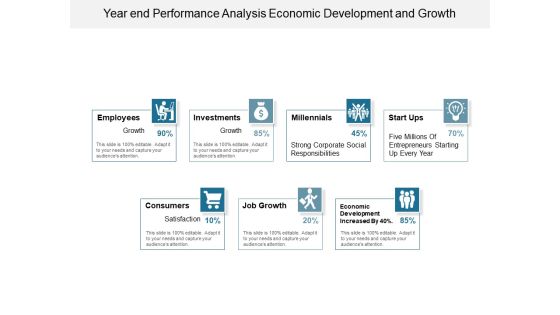
Year End Performance Analysis Economic Development And Growth Ppt PowerPoint Presentation Infographic Template Shapes
This is a year end performance analysis economic development and growth ppt powerpoint presentation infographic template shapes. This is a seven stage process. The stages in this process are year in review, yearly highlights, countdowns.

Product Performance And Profitability Report Unit Costs Sales And Revenues Analysis Ppt PowerPoint Presentation Model Show
This is a product performance and profitability report unit costs sales and revenues analysis ppt powerpoint presentation model show. This is a five stage process. The stages in this process are business unit profitability, profitable organization, corporate unit profitability.
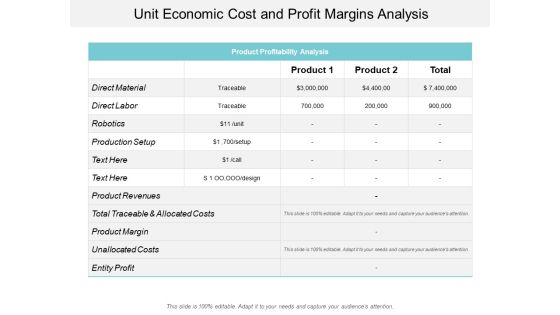
Unit Economic Cost And Profit Margins Analysis Ppt PowerPoint Presentation Pictures Demonstration
This is a unit economic cost and profit margins analysis ppt powerpoint presentation pictures demonstration. This is a two stage process. The stages in this process are business unit profitability, profitable organization, corporate unit profitability.

Unit Economic Profitability Cost Volume Analysis Chart Ppt PowerPoint Presentation Styles Graphics Design
This is a unit economic profitability cost volume analysis chart ppt powerpoint presentation styles graphics design. This is a five stage process. The stages in this process are business unit profitability, profitable organization, corporate unit profitability.
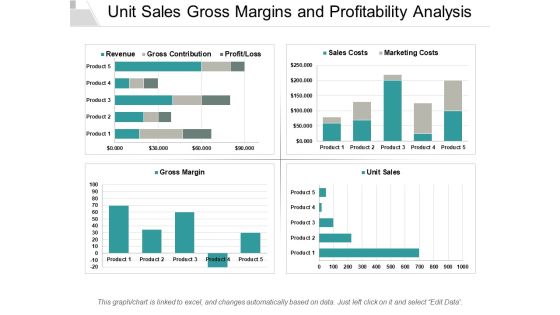
Unit Sales Gross Margins And Profitability Analysis Ppt PowerPoint Presentation Ideas Outfit
This is a unit sales gross margins and profitability analysis ppt powerpoint presentation ideas outfit. This is a four stage process. The stages in this process are business unit profitability, profitable organization, corporate unit profitability.

Project Phases Timeline Analysis Testing Deployment Ppt PowerPoint Presentation Styles Topics
This is a project phases timeline analysis testing deployment ppt powerpoint presentation styles topics. This is a two stage process. The stages in this process are office timeline, office roadmap, office schedule.
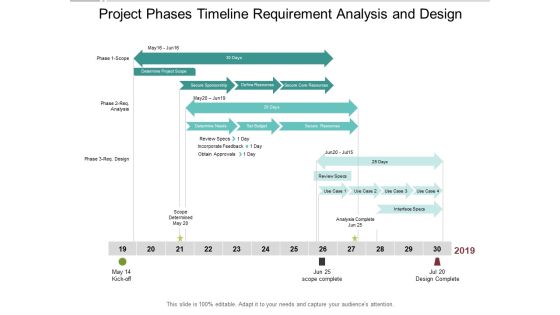
Project Phases Timeline Requirement Analysis And Design Ppt PowerPoint Presentation Inspiration Brochure
This is a project phases timeline requirement analysis and design ppt powerpoint presentation inspiration brochure. This is a three stage process. The stages in this process are office timeline, office roadmap, office schedule.
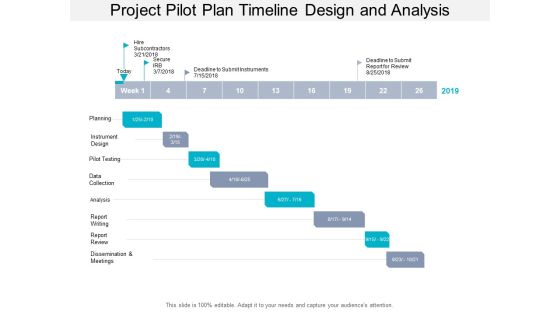
Project Pilot Plan Timeline Design And Analysis Ppt PowerPoint Presentation Slides Display
This is a project pilot plan timeline design and analysis ppt powerpoint presentation slides display. This is a eight stage process. The stages in this process are office timeline, office roadmap, office schedule.
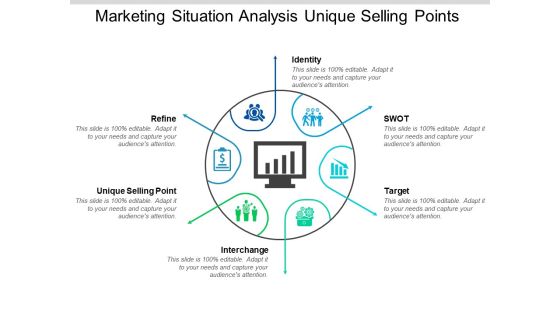
Marketing Situation Analysis Unique Selling Points Ppt PowerPoint Presentation Inspiration Slide Portrait
This is a marketing situation analysis unique selling points ppt powerpoint presentation inspiration slide portrait. This is a six stage process. The stages in this process are business marketing plan, business marketing strategies, business marketing approach.
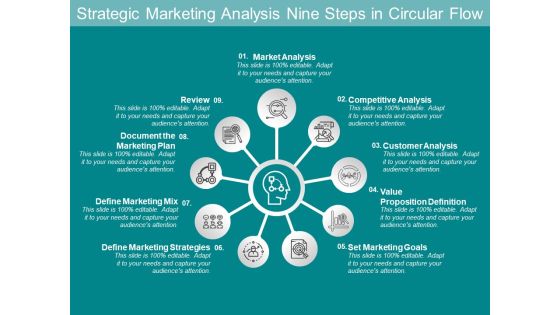
Strategic Marketing Analysis Nine Steps In Circular Flow Ppt PowerPoint Presentation Pictures Backgrounds
This is a strategic marketing analysis nine steps in circular flow ppt powerpoint presentation pictures backgrounds. This is a nine stage process. The stages in this process are business marketing plan, business marketing strategies, business marketing approach.
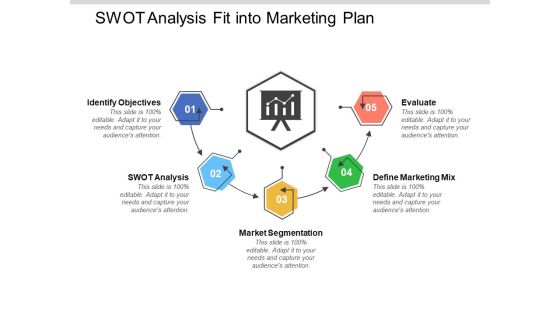
Swot Analysis Fit Into Marketing Plan Ppt PowerPoint Presentation Styles Tips
This is a swot analysis fit into marketing plan ppt powerpoint presentation styles tips. This is a five stage process. The stages in this process are business marketing plan, business marketing strategies, business marketing approach.
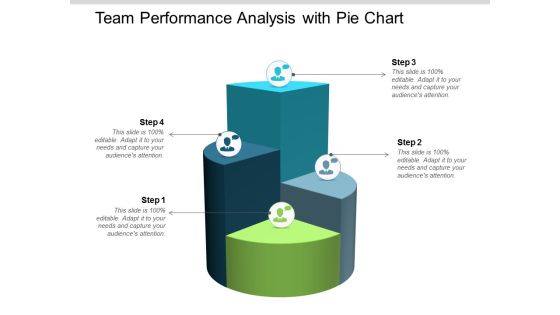
Team Performance Analysis With Pie Chart Ppt Powerpoint Presentation Infographic Template Slideshow
This is a team performance analysis with pie chart ppt powerpoint presentation infographic template slideshow. This is a four stage process. The stages in this process are team performance, member performance, group performance.
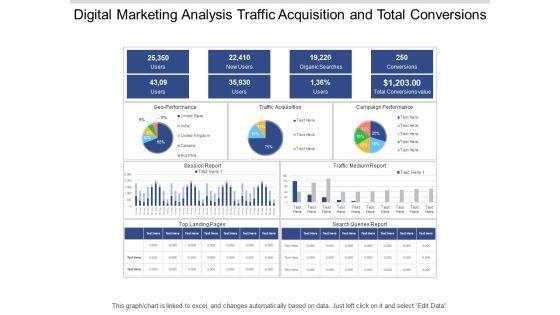
Digital Marketing Analysis Traffic Acquisition And Total Conversions Ppt PowerPoint Presentation Pictures Layouts
This is a digital marketing analysis traffic acquisition and total conversions ppt powerpoint presentation pictures layouts. This is a three stage process. The stages in this process are digital analytics, digital dashboard, marketing.
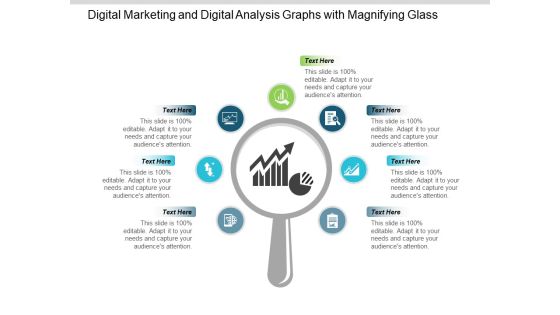
Digital Marketing And Digital Analysis Graphs With Magnifying Glass Ppt PowerPoint Presentation Portfolio Show
This is a digital marketing and digital analysis graphs with magnifying glass ppt powerpoint presentation portfolio show. This is a seven stage process. The stages in this process are digital analytics, digital dashboard, marketing.
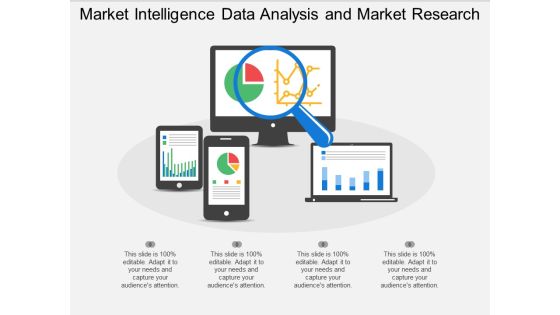
Market Intelligence Data Analysis And Market Research Ppt PowerPoint Presentation Professional Templates
This is a market intelligence data analysis and market research ppt powerpoint presentation professional templates. This is a four stage process. The stages in this process are digital analytics, digital dashboard, marketing.

Waterfall Graph For Income And Expense Analysis Ppt PowerPoint Presentation File Deck
This is a waterfall graph for income and expense analysis ppt powerpoint presentation file deck. This is a eight stage process. The stages in this process are sales waterfall, waterfall chart, business.
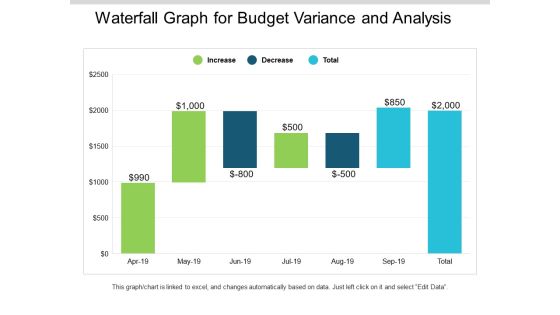
Waterfall Graph For Budget Variance And Analysis Ppt PowerPoint Presentation Slides Mockup
This is a waterfall graph for budget variance and analysis ppt powerpoint presentation slides mockup. This is a three stage process. The stages in this process are profit and loss, balance sheet, income statement, benefit and loss.

Graph Pattern For Network Analysis Ppt PowerPoint Presentation Infographics Graphics Template
This is a graph pattern for network analysis ppt powerpoint presentation infographics graphics template. This is a two stage process. The stages in this process are graph theory, chart theory, business.

Accounts Receivable Analysis Report Ppt PowerPoint Presentation Visual Aids Background Images
This is a accounts receivable analysis report ppt powerpoint presentation visual aids background images. This is a six stage process. The stages in this process are accounting review, accounting report, accounting statement.
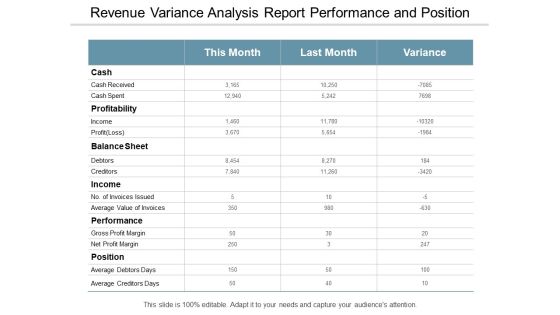
Revenue Variance Analysis Report Performance And Position Ppt PowerPoint Presentation Sample
This is a revenue variance analysis report performance and position ppt powerpoint presentation sample. This is a three stage process. The stages in this process are accounting review, accounting report, accounting statement.
Five Steps With Icons For Profitability Analysis Ppt Powerpoint Presentation Portfolio Backgrounds
This is a five steps with icons for profitability analysis ppt powerpoint presentation portfolio backgrounds. This is a five stage process. The stages in this process are 7 point infographic, 7 steps infographic, 7 stages infographic.

Technology Based Sales And Marketing Solutions For Buyers Analysis Ppt Powerpoint Presentation Portfolio Outfit
This is a technology based sales and marketing solutions for buyers analysis ppt powerpoint presentation portfolio outfit. This is a six stage process. The stages in this process are enablement plan, enablement strategy, enablement idea.

Funnel Analysis Finding And Fixing Conversions Ppt PowerPoint Presentation Infographic Template Good
This is a funnel analysis finding and fixing conversions ppt powerpoint presentation infographic template good. This is a four stage process. The stages in this process are leaky funnel, dripping funnel, holed funnel.
Histogram Financial Analysis Vector Icon Ppt PowerPoint Presentation Layouts File Formats Cpb
This is a histogram financial analysis vector icon ppt powerpoint presentation layouts file formats cpb. This is a three stage process. The stages in this process are bar chart icon, bar graph icon, data chart icon.
Three Bars For Financial Analysis Vector Icon Ppt PowerPoint Presentation Pictures Background Cpb
This is a three bars for financial analysis vector icon ppt powerpoint presentation pictures background cpb. This is a three stage process. The stages in this process are bar chart icon, bar graph icon, data chart icon.

Project Information Control Diagram Powerpoint Layout
This is a project information control diagram powerpoint layout. This is a six stage process. The stages in this process are document deliverables management, contract management, interface management, web api, request for info, change management.


 Continue with Email

 Home
Home


