AI PPT Maker
Templates
PPT Bundles
Design Services
Business PPTs
Business Plan
Management
Strategy
Introduction PPT
Roadmap
Self Introduction
Timelines
Process
Marketing
Agenda
Technology
Medical
Startup Business Plan
Cyber Security
Dashboards
SWOT
Proposals
Education
Pitch Deck
Digital Marketing
KPIs
Project Management
Product Management
Artificial Intelligence
Target Market
Communication
Supply Chain
Google Slides
Research Services
 One Pagers
All Categories
-
Home
- Customer Favorites
- Process Flow Diagram
Process Flow Diagram
Precooked Food Industry Analysis KPI Dashboard For Tracking Supply Chain Costs Diagrams PDF
This slide represents the KPI dashboard to track the multiple cost associated with supply chain in food manufacturing industry. It includes information regarding cash to cash cycle in days, carry cost of inventory along with details of net sales.Deliver an awe inspiring pitch with this creative Precooked Food Industry Analysis KPI Dashboard For Tracking Supply Chain Costs Diagrams PDF bundle. Topics like Processing Industry, Food Processing, Manufacturing Industry can be discussed with this completely editable template. It is available for immediate download depending on the needs and requirements of the user.

Competitors Financial Comparison With Income Statement And Balance Sheet Numbers Diagrams PDF
This slide shows companys Financial Comparison with the competitors based on certain factors like Revenue, EBIT, Net Cash Flows, Total Assets, Working Capital etc. for a specific year. Deliver an awe inspiring pitch with this creative competitors financial comparison with income statement and balance sheet numbers diagrams pdf bundle. Topics like gross profit, net cash flows, working capital can be discussed with this completely editable template. It is available for immediate download depending on the needs and requirements of the user.

Comprehensive Business Digitization Deck Driving Digital Transformation Through Artificial Intelligence Diagrams PDF
This graph shows the AIs benefits which enhances organizations products and processes and creates better decisions for the company. Deliver and pitch your topic in the best possible manner with this comprehensive business digitization deck driving digital transformation through artificial intelligence diagrams pdf. Use them to share invaluable insights on driving digital transformation through artificial intelligence and impress your audience. This template can be altered and modified as per your expectations. So, grab it now.
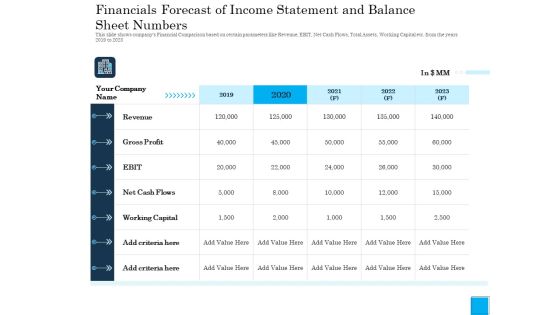
Insurance Organization Pitch Deck Raise Money Financials Forecast Income Statement Balance Sheet Numbers Diagrams PDF
Deliver and pitch your topic in the best possible manner with this insurance organization pitch deck raise money financials forecast income statement balance sheet numbers diagrams pdf. Use them to share invaluable insights on revenue, gross profit, net cash flows, working capital, criteria and impress your audience. This template can be altered and modified as per your expectations. So, grab it now.
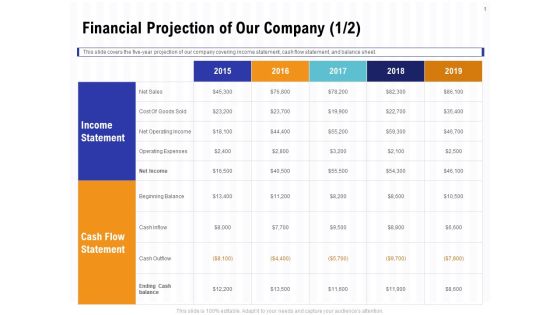
Trends And Emerging Areas In Merchant Acquiring Industry Financial Projection Of Our Company Net Diagrams PDF
Presenting this set of slides with name trends and emerging areas in merchant acquiring industry financial projection of our company net diagrams pdf. The topics discussed in these slides are income, cash flow, expenses, sales. This is a completely editable PowerPoint presentation and is available for immediate download. Download now and impress your audience.

Corporate Governance Of ICT IT Governance Risk Management And Compliance Diagrams PDF
This slide depicts the IT governance, risk management, and compliance, including key IT decisions, decision models, IT governance structure, processes and policies and standards, and so on. The Corporate Governance Of ICT IT Governance Risk Management And Compliance Diagrams PDF is a compilation of the most recent design trends as a series of slides. It is suitable for any subject or industry presentation, containing attractive visuals and photo spots for businesses to clearly express their messages. This template contains a variety of slides for the user to input data, such as structures to contrast two elements, bullet points, and slides for written information. Slidegeeks is prepared to create an impression.

Architectural Model Of Stream Processing Ppt PowerPoint Presentation Gallery Design Inspiration PDF
The following slide outlines a comprehensive model of data ingestion. Data ingestion, collector, processing, storage, query, and visualization are the six layers which will assist the company to secure flow of data. Showcasing this set of slides titled Architectural Model Of Stream Processing Ppt PowerPoint Presentation Gallery Design Inspiration PDF. The topics addressed in these templates are Data Visualization Layer, Analytics Engine, Data Query Layer. All the content presented in this PPT design is completely editable. Download it and make adjustments in color, background, font etc. as per your unique business setting.
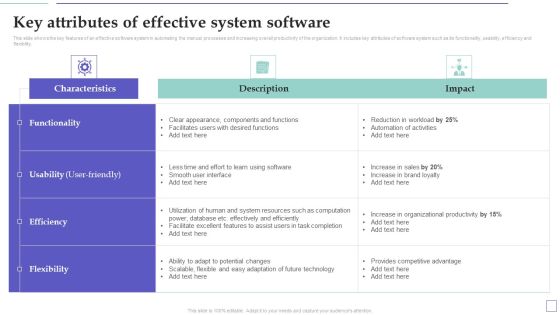
System Deployment Project Key Attributes Of Effective System Software Diagrams PDF
This slide shows the key features of an effective software system in automating the manual processes and increasing overall productivity of the organization. It includes key attributes of software system such as its functionality, usability, efficiency and flexibility.If you are looking for a format to display your unique thoughts, then the professionally designed System Deployment Project Key Attributes Of Effective System Software Diagrams PDF is the one for you. You can use it as a Google Slides template or a PowerPoint template. Incorporate impressive visuals, symbols, images, and other charts. Modify or reorganize the text boxes as you desire. Experiment with shade schemes and font pairings. Alter, share or cooperate with other people on your work. Download System Deployment Project Key Attributes Of Effective System Software Diagrams PDF and find out how to give a successful presentation. Present a perfect display to your team and make your presentation unforgettable.

Identifying Optimum Pricing Methods For Business Bcg Matrix To Evaluate Market Pricing Strategy Diagrams PDF
This template covers the boston consultancy group matrix which focuses on star, question mark, cash flow, and dog to evaluate market pricing strategy. This is a Identifying Optimum Pricing Methods For Business Bcg Matrix To Evaluate Market Pricing Strategy Diagrams PDF template with various stages. Focus and dispense information on four stages using this creative set, that comes with editable features. It contains large content boxes to add your information on topics like Strategy, Market Share, Growth. You can also showcase facts, figures, and other relevant content using this PPT layout. Grab it now.

Client Acquisition Cost For Customer Retention Client Acquisition Cost Breakdown For Startup Diagrams PDF
This slide shows client acquisition cost structure with total web visitors, cost per employee, trials, headcount costs, CAC, SEM cost per click etc. Presenting client acquisition cost for customer retention client acquisition cost breakdown for startup diagrams pdf to provide visual cues and insights. Share and navigate important information on three stages that need your due attention. This template can be used to pitch topics like input variables, flow, cost of customer acquisition. In addtion, this PPT design contains high resolution images, graphics, etc, that are easily editable and available for immediate download.

Agile Techniques For Data Migration Defining The Workflow Of Our Data Conversion Project Diagrams PDF
Mentioned slide displays the workflow of organizations data conversion project starting with delivery team phase and ending at release phase. Deliver an awe inspiring pitch with this creative Agile Techniques For Data Migration Defining The Workflow Of Our Data Conversion Project Diagrams PDF bundle. Topics like Delivery Team, Version Control, Build Unit Tests, Automated Acceptance Tests, User Acceptance Tests can be discussed with this completely editable template. It is available for immediate download depending on the needs and requirements of the user.

Customer Journey Map For Improving In Organizational Products And Services Diagrams PDF
Pitch your topic with ease and precision using this customer journey map for improving in organizational products and services diagrams pdf. This layout presents information on customer journey, iterative process, stakeholder map. It is also available for immediate download and adjustment. So, changes can be made in the color, design, graphics or any other component to create a unique layout.

Optimizing AI Strategies To Improve Financial Services Artificial Intelligence Workflow Automation Tools Diagrams PDF
This slide covers the AI Workflow Automation tools such as smart kai, clara, hubspot, troops.ai, etc. along with its features details. From laying roadmaps to briefing everything in detail, our templates are perfect for you. You can set the stage with your presentation slides. All you have to do is download these easy to edit and customizable templates. Optimizing AI Strategies To Improve Financial Services Artificial Intelligence Workflow Automation Tools Diagrams PDF will help you deliver an outstanding performance that everyone would remember and praise you for. Do download this presentation today.
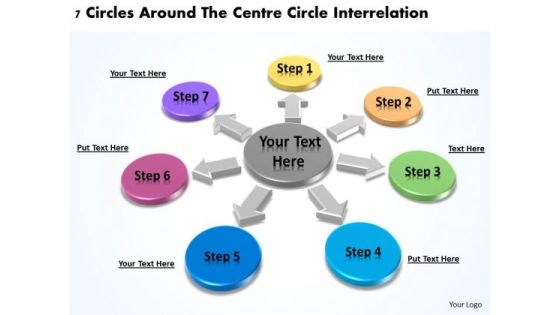
Business Model Diagrams 7 Circles Around The Centre Interrelation PowerPoint Slides
We present our business model diagrams 7 circles around the centre interrelation PowerPoint Slides.Present our Advertising PowerPoint Templates because Our PowerPoint Templates and Slides will weave a web of your great ideas. They are gauranteed to attract even the most critical of your colleagues. Present our Circle Charts PowerPoint Templates because It will let you Set new benchmarks with our PowerPoint Templates and Slides. They will keep your prospects well above par. Use our Business PowerPoint Templates because Our PowerPoint Templates and Slides will provide you a launch platform. Give a lift off to your ideas and send them into orbit. Use our Shapes PowerPoint Templates because You can Create a matrix with our PowerPoint Templates and Slides. Feel the strength of your ideas click into place. Present our Arrows PowerPoint Templates because You are an avid believer in ethical practices. Highlight the benefits that accrue with our PowerPoint Templates and Slides.Use these PowerPoint slides for presentations relating to Abstract, Arrow, Brochure, Business, Businessman, Button, Chart, Circle, Company, Cyclic, Data, Demonstration, Diagram, Economic, Financial, Five, Glossy, Goal, Graph, Illustration, Info, Information, Investment, Man, Manage, Marketing, Model, Navigation, Option, Part, People, Person, Pie, Presentation, Process, Result, Section, Segmented, Sharing, Silhouette, Sphere, Statistics, Stock, Strategy, Template, Variation, Vector, Wheel. The prominent colors used in the PowerPoint template are Orange, Green, Blue.

Optimizing Logistics Models To Enhance Supply Chain Management Challenges Faced By Supply Chain Managers Diagrams PDF
This slide focuses on challenges faced by supply chain managers which includes rise in supply chain costs, longer lead time, increased demand volatility due to reasons such as inconsistent supply chain processes, low inventory level, etc. Crafting an eye catching presentation has never been more straightforward. Let your presentation shine with this tasteful yet straightforward Optimizing Logistics Models To Enhance Supply Chain Management Challenges Faced By Supply Chain Managers Diagrams PDF template. It offers a minimalistic and classy look that is great for making a statement. The colors have been employed intelligently to add a bit of playfulness while still remaining professional. Construct the ideal Optimizing Logistics Models To Enhance Supply Chain Management Challenges Faced By Supply Chain Managers Diagrams PDF that effortlessly grabs the attention of your audience Begin now and be certain to wow your customers.
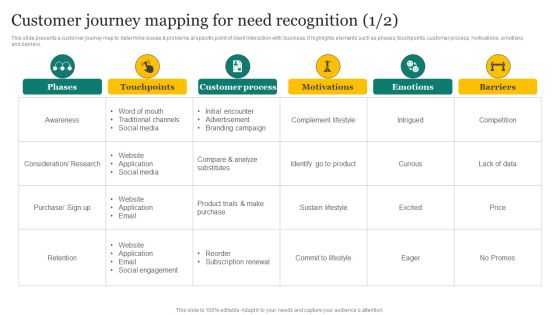
Strategic Promotion Plan Development Stages Customer Journey Mapping For Need Recognition Diagrams PDF
This slide presents a customer journey map to determine issues and problems at specific point of client interaction with business. It highlights elements such as phases, touchpoints, customer process, motivations, emotions and barriers. Boost your pitch with our creative Strategic Promotion Plan Development Stages Customer Journey Mapping For Need Recognition Diagrams PDF. Deliver an awe-inspiring pitch that will mesmerize everyone. Using these presentation templates you will surely catch everyones attention. You can browse the ppts collection on our website. We have researchers who are experts at creating the right content for the templates. So you do not have to invest time in any additional work. Just grab the template now and use them.

Manufacturing Operation Quality Improvement Practices Tools Templates Manufacturing Kanban Model Diagrams PDF
The following provides a manufacturing Kanban model as it displays the manufacturing process, the Kanban table and distribution center. Deliver an awe inspiring pitch with this creative manufacturing operation quality improvement practices tools templates manufacturing kanban model diagrams pdf bundle. Topics like manufacturing, distribution, consumption, kanban table can be discussed with this completely editable template. It is available for immediate download depending on the needs and requirements of the user.

Dynamic Systems Development Approach Focusing On The Business Needs Principle To Diagrams PDF
This slide explains that focusing on business needs as a principle of DSDM to be implemented makes the workflow uncomplicated. This is a Dynamic Systems Development Approach Focusing On The Business Needs Principle To Diagrams PDF template with various stages. Focus and dispense information on four stages using this creative set, that comes with editable features. It contains large content boxes to add your information on topics like Offer Software, Business Requirements, Flexible Enough. You can also showcase facts, figures, and other relevant content using this PPT layout. Grab it now.
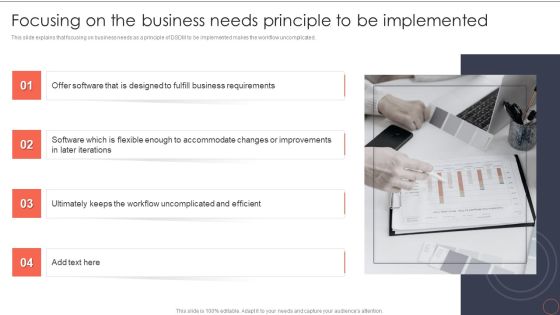
Focusing On The Business Needs Principle To Be Implemented Dynamic System Development Model Diagrams PDF
This slide explains that focusing on business needs as a principle of DSDM to be implemented makes the workflow uncomplicated.Take your projects to the next level with our ultimate collection of Focusing On The Business Needs Principle To Be Implemented Dynamic System Development Model Diagrams PDF. Slidegeeks has designed a range of layouts that are perfect for representing task or activity duration, keeping track of all your deadlines at a glance. Tailor these designs to your exact needs and give them a truly corporate look with your own brand colors they all make your projects stand out from the rest.

Lead Ranking Sales Methodology Model Table Of Contents Ppt PowerPoint Presentation Visual Aids Diagrams PDF
Presenting this set of slides with name lead ranking sales methodology model table of contents ppt powerpoint presentation visual aids diagrams pdf. The topics discussed in these slides are current scenario, improve lead scoring process, lead scoring dashboard, selecting suitable automated lead scoring software, impact analysis, lead activities tracking, optimizing lead scoring mechanism. This is a completely editable PowerPoint presentation and is available for immediate download. Download now and impress your audience.

Best Practices For Increasing Lead Conversion Rates Table Of Contents Diagrams PDF
Presenting this set of slides with name best practices for increasing lead conversion rates table of contents diagrams pdf. The topics discussed in these slides are sales trend analysis, analyzing customer journey map, competitive benchmarking, sales team productivity assessment, sales roadmap, starting point, review sales pipeline, 4 ways increase sales through sales pipeline, drivers sales growth, map sales process, sales big picture, sales strategy. This is a completely editable PowerPoint presentation and is available for immediate download. Download now and impress your audience.

Predicted Benefits Achieve From Implementing Chatbot On Ecommerce Website Diagrams PDF
This slide shows the key benefits achieve by the company after implementing chatbot on companys website. Do you have an important presentation coming up Are you looking for something that will make your presentation stand out from the rest Look no further than Predicted Benefits Achieve From Implementing Chatbot On Ecommerce Website Diagrams PDF. With our professional designs, you can trust that your presentation will pop and make delivering it a smooth process. And with Slidegeeks, you can trust that your presentation will be unique and memorable. So why wait Grab Predicted Benefits Achieve From Implementing Chatbot On Ecommerce Website Diagrams PDF today and make your presentation stand out from the rest.
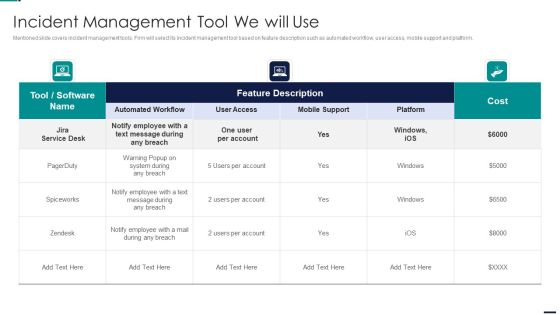
Risk Management Model For Data Security Incident Management Tool We Will Use Diagrams PDF
Mentioned slide covers incident management tools. Firm will select its incident management tool based on feature description such as automated workflow, user access, mobile support and platform. Deliver an awe inspiring pitch with this creative Risk Management Model For Data Security Incident Management Tool We Will Use Diagrams PDFbundle. Topics like Cost, Employee, Mobile Support, Automated Workflow, User Access can be discussed with this completely editable template. It is available for immediate download depending on the needs and requirements of the user.
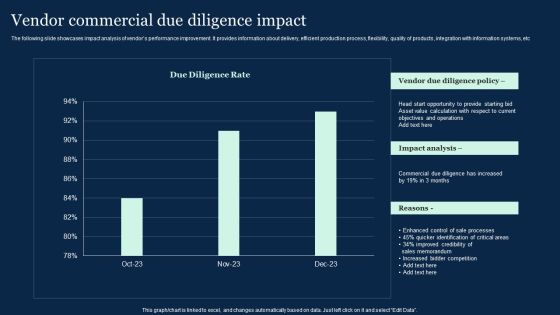
Vendor Commercial Due Diligence Impact Effective Vendor Management For Enhancing Diagrams PDF
The following slide showcases impact analysis of vendors performance improvement. It provides information about delivery, efficient production process, flexibility, quality of products, integration with information systems, etc. There are so many reasons you need a Vendor Commercial Due Diligence Impact Effective Vendor Management For Enhancing Diagrams PDF. The first reason is you can not spend time making everything from scratch, Thus, Slidegeeks has made presentation templates for you too. You can easily download these templates from our website easily.

Various Billing Software Comparison Chart Ppt PowerPoint Presentation File Diagrams PDF
Following slide represents comparative analysis of various software for company billing system. It includes various parameters such as prices, installation, time tracking, individual invoices, expense tracking etc. Do you have an important presentation coming up Are you looking for something that will make your presentation stand out from the rest Look no further than Various Billing Software Comparison Chart Ppt PowerPoint Presentation File Diagrams PDF With our professional designs, you can trust that your presentation will pop and make delivering it a smooth process. And with Slidegeeks, you can trust that your presentation will be unique and memorable. So why wait Grab Various Billing Software Comparison Chart Ppt PowerPoint Presentation File Diagrams PDF today and make your presentation stand out from the rest.

Cargo Industry Investor Financing Pitch Deck Business Model Of Lodging Industry Diagrams PDF
This templates covers the business model for Lodging Industry including commission on each transaction, revenue generated, avg fee and share of market. This is a cargo industry investor financing pitch deck business model of lodging industry diagrams pdf template with various stages. Focus and dispense information on three stages using this creative set, that comes with editable features. It contains large content boxes to add your information on topics like processing, organization, industry, market. You can also showcase facts, figures, and other relevant content using this PPT layout. Grab it now.

Forecast Analysis Technique IT Predictive Modeling Forecast Model Introduction Diagrams PDF
This slide outlines the introduction of the forecast model used for predictive analytics to make the metric value predictions for business processes. This model uses the Prophet algorithm to make predictions and includes its use cases in the manufacturing industry. If your project calls for a presentation, then Slidegeeks is your go to partner because we have professionally designed, easy to edit templates that are perfect for any presentation. After downloading, you can easily edit Forecast Analysis Technique IT Predictive Modeling Forecast Model Introduction Diagrams PDF and make the changes accordingly. You can rearrange slides or fill them with different images. Check out all the handy templates.

IT Security Risk Management Approach Introduction Determining The Priority Requirements Diagrams PDF
This slide demonstrates the priority requirements of companies while buying IoT products. Strong cybersecurity is the topmost priority of companies followed by reliability and compatibility. Deliver an awe inspiring pitch with this creative IT Security Risk Management Approach Introduction Determining The Priority Requirements Diagrams PDF bundle. Topics like Development Processes, Technology Environments, Purchasing Iot Products can be discussed with this completely editable template. It is available for immediate download depending on the needs and requirements of the user.

Agile SDLC IT Identifying The Most Commonly Used Agile Methodologies Diagrams PDF
Following pie chart shows informational stats about most commonly used agile methodologies. Here the chart shows that most of the organization prefers scrum process. Deliver an awe inspiring pitch with this creative agile sdlc it identifying the most commonly used agile methodologies diagrams pdf bundle. Topics like iterative development, extreme programming, scrum ban, hybrid, organizations, methodology can be discussed with this completely editable template. It is available for immediate download depending on the needs and requirements of the user.

Client Success Playbook Customer Segmentation Based On Business Type And Size Diagrams PDF
Mentioned slide shows information about the companys customer segmentation process. It shows that leads will be segmented in two phases based on business type, size, annual revenues etc. Deliver an awe inspiring pitch with this creative Client Success Playbook Customer Segmentation Based On Business Type And Size Diagrams PDF bundle. Topics like Price Focused, Service Focused, Partnership Focused can be discussed with this completely editable template. It is available for immediate download depending on the needs and requirements of the user.

Developing Brand Awareness To Gain Customer Attention Brand Awareness Model AIDA Model Diagrams PDF
This slide provides information regarding brand awareness AIDA model which determines the stages an individual progress during purchasing process. Present like a pro with Developing Brand Awareness To Gain Customer Attention Brand Awareness Model AIDA Model Diagrams PDF Create beautiful presentations together with your team, using our easy-to-use presentation slides. Share your ideas in real-time and make changes on the fly by downloading our templates. So whether you are in the office, on the go, or in a remote location, you can stay in sync with your team and present your ideas with confidence. With Slidegeeks presentation got a whole lot easier. Grab these presentations today.

Strategies For Credit Risk Management Market Share And Turnover Related To The Diagrams PDF
This slide shows the market share and turnover related to the competitors including domestic and export markets in relation to other banks. Do you have an important presentation coming up Are you looking for something that will make your presentation stand out from the rest Look no further than Strategies For Credit Risk Management Market Share And Turnover Related To The Diagrams PDF. With our professional designs, you can trust that your presentation will pop and make delivering it a smooth process. And with Slidegeeks, you can trust that your presentation will be unique and memorable. So why wait Grab Strategies For Credit Risk Management Market Share And Turnover Related To The Diagrams PDF today and make your presentation stand out from the rest.

Effective Organizational B2B And B2C 70 20 10 Rule Social Media Marketing Diagrams PDF
Purpose of the following slide is to display the best practices of utilizing social media marketing. It displays the 70-20-10 rule which defines the type of content to be posted on various social media platforms. Do you have an important presentation coming up Are you looking for something that will make your presentation stand out from the rest Look no further than Effective Organizational B2B And B2C 70 20 10 Rule Social Media Marketing Diagrams PDF. With our professional designs, you can trust that your presentation will pop and make delivering it a smooth process. And with Slidegeeks, you can trust that your presentation will be unique and memorable. So why wait Grab Effective Organizational B2B And B2C 70 20 10 Rule Social Media Marketing Diagrams PDF today and make your presentation stand out from the rest.

Examining Customer Experience Path To Enhance Adoption Rate Dashboard To Evaluate Consumer Adoption Diagrams PDF
This slide showcases the KPIs that would help our business organization to evaluate improvements in the consumer adoption process. It includes repeat purchase ratio per purchase frequency, conversions over time, customer adoption rate, customer churn rate, etc. Create an editable Examining Customer Experience Path To Enhance Adoption Rate Dashboard To Evaluate Consumer Adoption Diagrams PDF that communicates your idea and engages your audience. Whether youre presenting a business or an educational presentation, pre designed presentation templates help save time. Examining Customer Experience Path To Enhance Adoption Rate Dashboard To Evaluate Consumer Adoption Diagrams PDF is highly customizable and very easy to edit, covering many different styles from creative to business presentations. Slidegeeks has creative team members who have crafted amazing templates. So, go and get them without any delay.

Saas Continuous Income Generation Model For Software Startup Which Pricing Strategy To Use Diagrams PDF
The following slide provides an overview of the various strategies that the organization can use in order to price their product and services, these strategies can be premium pricing, market penetration pricing, economy pricing or competitive pricing Do you have an important presentation coming up Are you looking for something that will make your presentation stand out from the rest Look no further than Saas Continuous Income Generation Model For Software Startup Which Pricing Strategy To Use Diagrams PDF. With our professional designs, you can trust that your presentation will pop and make delivering it a smooth process. And with Slidegeeks, you can trust that your presentation will be unique and memorable. So why wait Grab Saas Continuous Income Generation Model For Software Startup Which Pricing Strategy To Use Diagrams PDF today and make your presentation stand out from the rest.

Customer Engagement Methods For Online Platforms Emerging Trends In Mobile Shopping Industry Diagrams PDF
This slide includes statistics related to mobile commerce market size, average time spend by consumers on phone and age based categorization of consumers who do research online before making a purchase. Do you have an important presentation coming up. Are you looking for something that will make your presentation stand out from the rest. Look no further than Customer Engagement Methods For Online Platforms Emerging Trends In Mobile Shopping Industry Diagrams PDF. With our professional designs, you can trust that your presentation will pop and make delivering it a smooth process. And with Slidegeeks, you can trust that your presentation will be unique and memorable. So why wait. Grab Customer Engagement Methods For Online Platforms Emerging Trends In Mobile Shopping Industry Diagrams PDF today and make your presentation stand out from the rest.

Content Delivery And Promotion Dashboard To Track Leads Generated Through Content Diagrams PDF
This slide showcases dashboard that can help organization to track leads generated by running content marketing campaigns. Its key metrics are website visitors, cost per click, top converting marketing channels, top lead generation source, ROI by marketing channel etc. Do you have an important presentation coming up Are you looking for something that will make your presentation stand out from the rest Look no further than Content Delivery And Promotion Dashboard To Track Leads Generated Through Content Diagrams PDF. With our professional designs, you can trust that your presentation will pop and make delivering it a smooth process. And with Slidegeeks, you can trust that your presentation will be unique and memorable. So why wait Grab Content Delivery And Promotion Dashboard To Track Leads Generated Through Content Diagrams PDF today and make your presentation stand out from the rest.

Comprehensive Guide To Build Marketing Digital Marketing Dashboard With Customer Acquisition Diagrams PDF
The following slide showcases comprehensive online marketing dashboard through which digital marketers can evaluate impact of advertisement campaigns on business performance. The success metrics mentioned in slide are customer lifetime value LTV, customer acquisition cost CAC, average lifetime value, etc. Do you have an important presentation coming up Are you looking for something that will make your presentation stand out from the rest Look no further than Comprehensive Guide To Build Marketing Digital Marketing Dashboard With Customer Acquisition Diagrams PDF. With our professional designs, you can trust that your presentation will pop and make delivering it a smooth process. And with Slidegeeks, you can trust that your presentation will be unique and memorable. So why wait Grab Comprehensive Guide To Build Marketing Digital Marketing Dashboard With Customer Acquisition Diagrams PDF today and make your presentation stand out from the rest.

Smart Wireless Sensor Networks Dynamic Spectrum Cognitive Radio Model Diagrams PDF
This slide depicts the dynamic spectrum cognitive radio model, which assumes that primary users do not always utilize the spectrum. The spectrum can be used by secondary users modeled with the on and off process. From laying roadmaps to briefing everything in detail, our templates are perfect for you. You can set the stage with your presentation slides. All you have to do is download these easy-to-edit and customizable templates. Smart Wireless Sensor Networks Dynamic Spectrum Cognitive Radio Model Diagrams PDF will help you deliver an outstanding performance that everyone would remember and praise you for. Do download this presentation today.

Boston Consulting Group Strategy Guide For Businesses With Diverse Product Range Diagrams PDF
This slide includes the BCG strategy for businesses that can work as a lighthouse for bettering decision-making process. It consists of strategies that can work as measures for growth and expansion of said business concern. Persuade your audience using this Boston Consulting Group Strategy Guide For Businesses With Diverse Product Range Diagrams PDF. This PPT design covers four stages, thus making it a great tool to use. It also caters to a variety of topics including Strategy For Dog Products, Strategy For Star Products, Business Environment. Download this PPT design now to present a convincing pitch that not only emphasizes the topic but also showcases your presentation skills.

Information And Technology Security Operations Selecting Suitable Security Incident Management Software Diagrams PDF
This slide will help firm in selecting the suitable automated incident management software which will handle existing security and privacy issues and predict upcoming incidents. The firm will choose effective software with features such as automated workflows, centralized platform, etc. Deliver an awe inspiring pitch with this creative information and technology security operations selecting suitable security incident management software diagrams pdf bundle. Topics like security incident forms, access rights, automated workflows, centralized platform can be discussed with this completely editable template. It is available for immediate download depending on the needs and requirements of the user.

Client Achievements Playbook Customer Segmentation Based On Business Type And Size Diagrams PDF
Mentioned slide shows information about the companys customer segmentation process. It shows that leads will be segmented in two phases based on business type, size, annual revenues etc. Deliver and pitch your topic in the best possible manner with this client achievements playbook customer segmentation based on business type and size diagrams pdf. Use them to share invaluable insights on number employees, annual revenues, partnership focused, service focused and impress your audience. This template can be altered and modified as per your expectations. So, grab it now.

Confidential Computing System Technology Ack Tee Introduction And Version 10 Diagrams PDF
This slide talks about the introduction of Container Service for Kubernetes trusted execution environment and its version 1.0. The purpose of this slide is to showcase its features, data of launch, objective and target users. It also includes the architecture and workflow of ACK TEE and its working. Create an editable Confidential Computing System Technology Ack Tee Introduction And Version 10 Diagrams PDF that communicates your idea and engages your audience. Whether youe presenting a business or an educational presentation, pre-designed presentation templates help save time. Confidential Computing System Technology Ack Tee Introduction And Version 10 Diagrams PDF is highly customizable and very easy to edit, covering many different styles from creative to business presentations. Slidegeeks has creative team members who have crafted amazing templates. So, go and get them without any delay.

Client Onboarding Journey Impact On Business Impact Of Efficient Customer Onboarding Diagrams PDF
This slide showcases positive impact of proper customer onboarding process. It includes reduced customer churn rate and onboarding support tickets. Slidegeeks is one of the best resources for PowerPoint templates. You can download easily and regulate Client Onboarding Journey Impact On Business Impact Of Efficient Customer Onboarding Diagrams PDF for your personal presentations from our wonderful collection. A few clicks is all it takes to discover and get the most relevant and appropriate templates. Use our Templates to add a unique zing and appeal to your presentation and meetings. All the slides are easy to edit and you can use them even for advertisement purposes.

Talent Retention Initiatives For New Hire Onboarding Expected Outcome Of Implementing Diagrams PDF
This slide presents expected outcome of effective onboarding program. It also includes information about the shared benefits of employee onboarding process, cost savings, lower turnover, better performance, organizational commitment and lower stress. Want to ace your presentation in front of a live audience Our Talent Retention Initiatives For New Hire Onboarding Expected Outcome Of Implementing Diagrams PDF can help you do that by engaging all the users towards you. Slidegeeks experts have put their efforts and expertise into creating these impeccable powerpoint presentations so that you can communicate your ideas clearly. Moreover, all the templates are customizable, and easy to edit and downloadable. Use these for both personal and commercial use.

Business Intelligence And Big Data Analytics Change Management Communication Plan Diagrams PDF
Here, we are describing the communication plan of implementing the change in data analytics project. It includes sections such as designated leader who support the change, respective departments and key actions for rationalizing the change in the process. Deliver and pitch your topic in the best possible manner with this business intelligence and big data analytics change management communication plan diagrams pdf. Use them to share invaluable insights on change management model, organization, apply data analytics and impress your audience. This template can be altered and modified as per your expectations. So, grab it now.

Adjusting Financial Strategies And Planning Tracking The Cashflow Improvements With Cash Management Diagrams PDF
This slide showcases the KPIs that would help our business organization to track the improvements in the new cash management process. It includes quick ratio, cash balance, current ratio, days inventory outstanding, etc. Retrieve professionally designed Adjusting Financial Strategies And Planning Tracking The Cashflow Improvements With Cash Management Diagrams PDF to effectively convey your message and captivate your listeners. Save time by selecting pre made slideshows that are appropriate for various topics, from business to educational purposes. These themes come in many different styles, from creative to corporate, and all of them are easily adjustable and can be edited quickly. Access them as PowerPoint templates or as Google Slides themes. You do not have to go on a hunt for the perfect presentation because Slidegeeks got you covered from everywhere.

Creating Employee Value Proposition Survey Questionnaire To Analyze Employee Satisfaction Diagrams PDF
This slide presents a questionnaire to survey employee experience and satisfaction rate. It provides insights to business to identify improvement areas in existing organizational systems and processes. If you are looking for a format to display your unique thoughts, then the professionally designed Creating Employee Value Proposition Survey Questionnaire To Analyze Employee Satisfaction Diagrams PDF is the one for you. You can use it as a Google Slides template or a PowerPoint template. Incorporate impressive visuals, symbols, images, and other charts. Modify or reorganize the text boxes as you desire. Experiment with shade schemes and font pairings. Alter, share or cooperate with other people on your work. Download Creating Employee Value Proposition Survey Questionnaire To Analyze Employee Satisfaction Diagrams PDF and find out how to give a successful presentation. Present a perfect display to your team and make your presentation unforgettable.

Vendor Management To Handle Purchase Selection Of Suitable Vendor Management Software Diagrams PDF
The following slide showcases selection of suitable vendor management software. It provides information about vendor login, system access, automated workflows, scorecards, shipment tracking, compliance, etc.This is a Vendor Management To Handle Purchase Selection Of Suitable Vendor Management Software Diagrams PDF template with various stages. Focus and dispense information on one stage using this creative set, that comes with editable features. It contains large content boxes to add your information on topics like Features Services, Automated Reminder, Shipment Tracking. You can also showcase facts, figures, and other relevant content using this PPT layout. Grab it now.

Deliveroo Capital Fundraising Pitch Deck Technology Used By The Company Ppt Model Diagrams PDF
This slide shows the advanced technology that is used by Deliveroo in its operation which is related to an algorithm that determines an effective way of order distribution and a machine learning program that helps to determine the time for preparing the meal that helps to streamline the delivery process. Presenting deliveroo capital fundraising pitch deck technology used by the company ppt model diagrams pdf to provide visual cues and insights. Share and navigate important information on two stages that need your due attention. This template can be used to pitch topics like technology used by the company. In addtion, this PPT design contains high resolution images, graphics, etc, that are easily editable and available for immediate download.

Deploying Banking Transaction Major Roles And Responsibilities Of Financial Diagrams PDF
The following slide Major roles and responsibilities of financial security department . It includes information about risk level determination, laws and regulations, team training, operational compliance, automatic workflows, red flags, etc. Explore a selection of the finest Deploying Banking Transaction Major Roles And Responsibilities Of Financial Diagrams PDF here. With a plethora of professionally designed and pre-made slide templates, you can quickly and easily find the right one for your upcoming presentation. You can use our Deploying Banking Transaction Major Roles And Responsibilities Of Financial Diagrams PDF to effectively convey your message to a wider audience. Slidegeeks has done a lot of research before preparing these presentation templates. The content can be personalized and the slides are highly editable. Grab templates today from Slidegeeks.
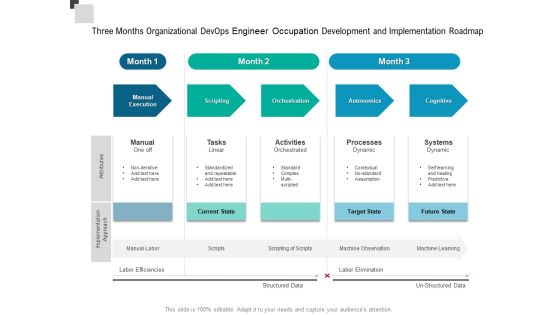
Three Months Organizational Devops Engineer Occupation Development And Implementation Roadmap Diagrams
Presenting our jaw-dropping three months organizational devops engineer occupation development and implementation roadmap diagrams. You can alternate the color, font size, font type, and shapes of this PPT layout according to your strategic process. This PPT presentation is compatible with Google Slides and is available in both standard screen and widescreen aspect ratios. You can also download this well-researched PowerPoint template design in different formats like PDF, JPG, and PNG. So utilize this visually-appealing design by clicking the download button given below.

6 Months Technological Roadmap For Employee And Consumer Experience And Support Diagrams
Presenting our jaw-dropping 6 months technological roadmap for employee and consumer experience and support diagrams. You can alternate the color, font size, font type, and shapes of this PPT layout according to your strategic process. This PPT presentation is compatible with Google Slides and is available in both standard screen and widescreen aspect ratios. You can also download this well-researched PowerPoint template design in different formats like PDF, JPG, and PNG. So utilize this visually-appealing design by clicking the download button given below.

6 Months Viability Future Vision And Mission Roadmap For Brand Development Diagrams
Presenting our jaw-dropping 6 months viability future vision and mission roadmap for brand development diagrams. You can alternate the color, font size, font type, and shapes of this PPT layout according to your strategic process. This PPT presentation is compatible with Google Slides and is available in both standard screen and widescreen aspect ratios. You can also download this well-researched PowerPoint template design in different formats like PDF, JPG, and PNG. So utilize this visually-appealing design by clicking the download button given below.
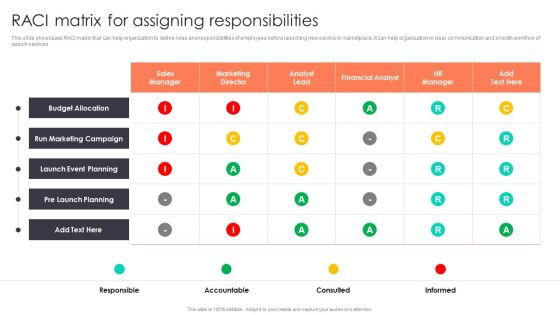
Promotion Strategies For New Service Launch RACI Matrix For Assigning Responsibilities Diagrams PDF
This slide showcases RACI matrix that can help organization to define roles and responsibilities of employees before launching new service in marketplace. It can help organization in clear communication and smooth workflow of launch services. The Promotion Strategies For New Service Launch RACI Matrix For Assigning Responsibilities Diagrams PDF is a compilation of the most recent design trends as a series of slides. It is suitable for any subject or industry presentation, containing attractive visuals and photo spots for businesses to clearly express their messages. This template contains a variety of slides for the user to input data, such as structures to contrast two elements, bullet points, and slides for written information. Slidegeeks is prepared to create an impression.
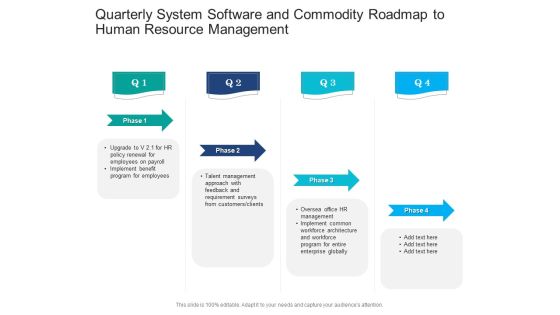
Quarterly System Software And Commodity Roadmap To Human Resource Management Diagrams
Presenting our jaw-dropping quarterly system software and commodity roadmap to human resource management diagrams. You can alternate the color, font size, font type, and shapes of this PPT layout according to your strategic process. This PPT presentation is compatible with Google Slides and is available in both standard screen and widescreen aspect ratios. You can also download this well-researched PowerPoint template design in different formats like PDF, JPG, and PNG. So utilize this visually-appealing design by clicking the download button given below.

Recuperation Planning Five Years Roadmap To Mitigate Information Technology Incident Diagrams
Presenting our jaw-dropping recuperation planning five years roadmap to mitigate information technology incident diagrams. You can alternate the color, font size, font type, and shapes of this PPT layout according to your strategic process. This PPT presentation is compatible with Google Slides and is available in both standard screen and widescreen aspect ratios. You can also download this well-researched PowerPoint template design in different formats like PDF, JPG, and PNG. So utilize this visually-appealing design by clicking the download button given below.
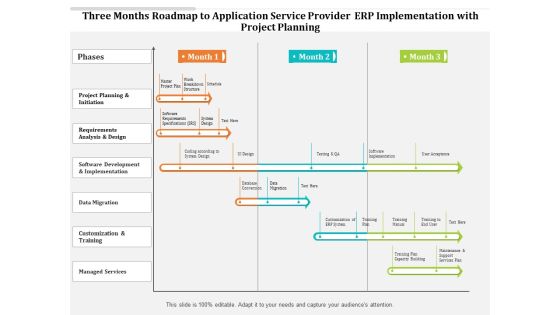
Three Months Roadmap To Application Service Provider ERP Implementation With Project Planning Diagrams
Presenting our jaw dropping three months roadmap to application service provider erp implementation with project planning diagrams. You can alternate the color, font size, font type, and shapes of this PPT layout according to your strategic process. This PPT presentation is compatible with Google Slides and is available in both standard screen and widescreen aspect ratios. You can also download this well researched PowerPoint template design in different formats like PDF, JPG, and PNG. So utilize this visually appealing design by clicking the download button given below.
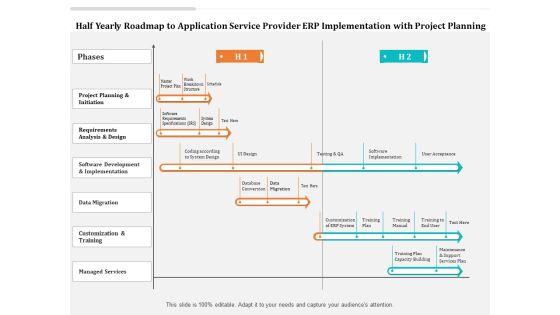
Half Yearly Roadmap To Application Service Provider ERP Implementation With Project Planning Diagrams
Presenting our jaw-dropping half yearly roadmap to application service provider erp implementation with project planning diagrams. You can alternate the color, font size, font type, and shapes of this PPT layout according to your strategic process. This PPT presentation is compatible with Google Slides and is available in both standard screen and widescreen aspect ratios. You can also download this well-researched PowerPoint template design in different formats like PDF, JPG, and PNG. So utilize this visually-appealing design by clicking the download button given below.

Six Months Training Roadmap For New Commodity Development By Supervisor Diagrams
Presenting our jaw dropping six months training roadmap for new commodity development by supervisor diagrams. You can alternate the color, font size, font type, and shapes of this PPT layout according to your strategic process. This PPT presentation is compatible with Google Slides and is available in both standard screen and widescreen aspect ratios. You can also download this well researched PowerPoint template design in different formats like PDF, JPG, and PNG. So utilize this visually appealing design by clicking the download button given below.
