Process Chart
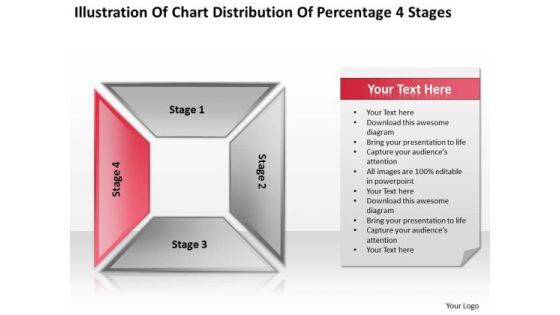
Chart Distribution Percentage 4 Stages Ppt Business Plan For PowerPoint Slides
We present our chart distribution percentage 4 stages ppt business plan for PowerPoint Slides.Download our Business PowerPoint Templates because You are working at that stage with an air of royalty. Let our PowerPoint Templates and Slides be the jewels in your crown. Use our Process and Flows PowerPoint Templates because Our PowerPoint Templates and Slides will give you great value for your money. Be assured of finding the best projection to highlight your words. Use our Shapes PowerPoint Templates because Our PowerPoint Templates and Slides will let you Clearly mark the path for others to follow. Present our Success PowerPoint Templates because Our PowerPoint Templates and Slides come in all colours, shades and hues. They help highlight every nuance of your views. Present our Marketing PowerPoint Templates because Our PowerPoint Templates and Slides will help you be quick off the draw. Just enter your specific text and see your points hit home.Use these PowerPoint slides for presentations relating to Shadow, square, rectangle, perspective, vector, template, shapes, graphic, multicolor, abstract, modern, box, illustration, geometric, backdrop, colors, design, architecture, shelves, backgrounds, banner, art, cabinet, space, wardrobe, structure, block. The prominent colors used in the PowerPoint template are Red, Black, Gray.

Distributions In Business Chart 5 Stages Ppt Blank Plan Template PowerPoint Templates
We present our distributions in business chart 5 stages ppt blank plan template PowerPoint templates.Download and present our Process and Flows PowerPoint Templates because They will Put the wind in your sails. Skim smoothly over the choppy waters of the market. Download and present our Business PowerPoint Templates because Our PowerPoint Templates and Slides will provide you the cutting edge. Slice through the doubts in the minds of your listeners. Present our Future PowerPoint Templates because You can Stir your ideas in the cauldron of our PowerPoint Templates and Slides. Cast a magic spell on your audience. Present our Marketing PowerPoint Templates because you can Add colour to your speech with our PowerPoint Templates and Slides. Your presentation will leave your audience speechless. Download and present our Shapes PowerPoint Templates because Our PowerPoint Templates and Slides will Embellish your thoughts. They will help you illustrate the brilliance of your ideas.Use these PowerPoint slides for presentations relating to Design, abstract, icon, element, sphere, vector, concept, graphic, shape, color, colorful, polygon, background, cool, white, triangle, presentation, digital,technology, illustration, geometric, web, cover, trendy, composition, wallpaper, mesh, curve,clean, modern, creative, futuristic. The prominent colors used in the PowerPoint template are Purple, White, Gray.
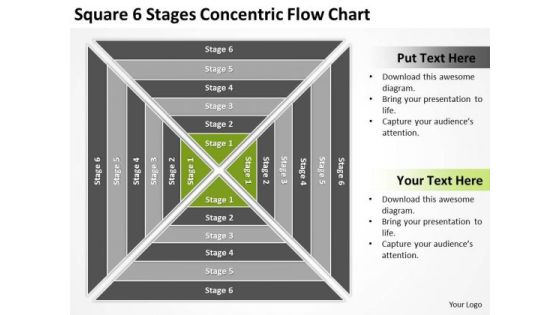
Square 6 Stages Concentric Flow Chart Ppt Business Plan Sample PowerPoint Templates
We present our square 6 stages concentric flow chart ppt business plan sample PowerPoint templates.Download and present our Business PowerPoint Templates because These PowerPoint Templates and Slides will give the updraft to your ideas. See them soar to great heights with ease. Use our Signs PowerPoint Templates because It will Raise the bar of your Thoughts. They are programmed to take you to the next level. Download our Shapes PowerPoint Templates because It will let you Set new benchmarks with our PowerPoint Templates and Slides. They will keep your prospects well above par. Present our Boxes PowerPoint Templates because Your audience will believe you are the cats whiskers. Use our Process and Flows PowerPoint Templates because Our PowerPoint Templates and Slides will definately Enhance the stature of your presentation. Adorn the beauty of your thoughts with their colourful backgrounds.Use these PowerPoint slides for presentations relating to 60s, 70s, art, background, decoration, decorative, design, fractal, generative, genetic, geometrical, hippie, illusion, illustration, kaleidoscope, kaleidoscopic, landscape, math, mathematical, mosaic, op, optical, optical illusion, pattern, pop, psychedelic, raytrace, retro, sculpture, seamless, seventies, sixties, symmetric, synthetic, vintage, virtual, virtual sculpture, wallpaper. The prominent colors used in the PowerPoint template are Green, Gray, White.
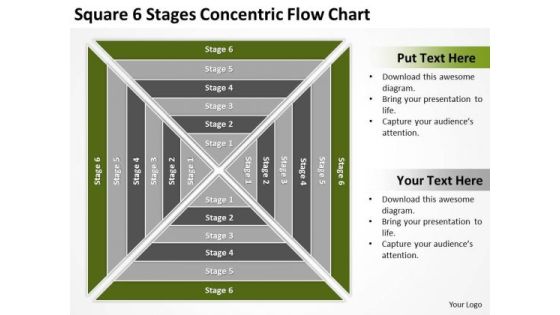
Square 6 Stages Concentric Flow Chart Ppt Sample Small Business Plan PowerPoint Slides
We present our square 6 stages concentric flow chart ppt sample small business plan PowerPoint Slides.Present our Business PowerPoint Templates because Our PowerPoint Templates and Slides are conceived by a dedicated team. Use them and give form to your wondrous ideas. Use our Signs PowerPoint Templates because Our PowerPoint Templates and Slides will let you Clearly mark the path for others to follow. Download and present our Shapes PowerPoint Templates because Our PowerPoint Templates and Slides come in all colours, shades and hues. They help highlight every nuance of your views. Use our Boxes PowerPoint Templates because Our PowerPoint Templates and Slides are like the strings of a tennis racquet. Well strung to help you serve aces. Download our Process and Flows PowerPoint Templates because It will let you Set new benchmarks with our PowerPoint Templates and Slides. They will keep your prospects well above par.Use these PowerPoint slides for presentations relating to 60s, 70s, art, background, decoration, decorative, design, fractal, generative, genetic, geometrical, hippie, illusion, illustration, kaleidoscope, kaleidoscopic, landscape, math, mathematical, mosaic, op, optical, optical illusion, pattern, pop, psychedelic, raytrace, retro, sculpture, seamless, seventies, sixties, symmetric, synthetic, vintage, virtual, virtual sculpture, wallpaper. The prominent colors used in the PowerPoint template are Green, Gray, White.

Square 6 Stages Concentric Flow Chart Ppt Template For Business Plan PowerPoint Templates
We present our square 6 stages concentric flow chart ppt template for business plan PowerPoint templates.Use our Business PowerPoint Templates because Our PowerPoint Templates and Slides offer you the widest possible range of options. Download and present our Signs PowerPoint Templates because Our PowerPoint Templates and Slides are specially created by a professional team with vast experience. They diligently strive to come up with the right vehicle for your brilliant Ideas. Present our Shapes PowerPoint Templates because Our PowerPoint Templates and Slides come in all colours, shades and hues. They help highlight every nuance of your views. Use our Boxes PowerPoint Templates because You have a driving passion to excel in your field. Our PowerPoint Templates and Slides will prove ideal vehicles for your ideas. Present our Process and Flows PowerPoint Templates because You can Channelise the thoughts of your team with our PowerPoint Templates and Slides. Urge them to focus on the goals you have set.Use these PowerPoint slides for presentations relating to 60s, 70s, art, background, decoration, decorative, design, fractal, generative, genetic, geometrical, hippie, illusion, illustration, kaleidoscope, kaleidoscopic, landscape, math, mathematical, mosaic, op, optical, optical illusion, pattern, pop, psychedelic, raytrace, retro, sculpture, seamless, seventies, sixties, symmetric, synthetic, vintage, virtual, virtual sculpture, wallpaper. The prominent colors used in the PowerPoint template are Green, Gray, White.
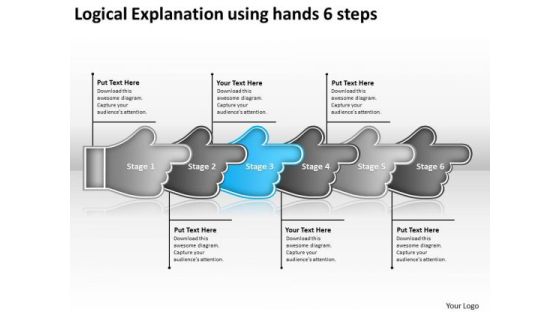
Logical Explanation Using Hands 6 Steps Flow Chart System PowerPoint Templates
We present our logical explanation using hands 6 steps flow chart system PowerPoint templates. Use our Handshake PowerPoint Templates because; Break it all down to Key Result Areas. Use our Process and Flows PowerPoint Templates because, Signpost your preferred roadmap to your eager co- travelers and demonstrate clearly how you intend to navigate them towards the desired corporate goal. Use our Business PowerPoint Templates because, Honesty is the best policy has an ardent follower in you. Use our Shapes PowerPoint Templates because, Saves your time a prized possession, an ideal aid to give an ideal presentation. Use our Signs PowerPoint Templates because, The Venn graphic comprising interlinking circles geometrically demonstrate how various functions operating independently, to a large extent, are essentially interdependent. Use these PowerPoint slides for presentations relating to Adult, alone, arranging, background, child, dirty, empty, family, handprint, hands, human, identity, illustration, isolated, messy, naked, objects, paint, palm, shape, simple, stage, stained, stamp, togetherness. The prominent colors used in the PowerPoint template are White, Blue, and Gray
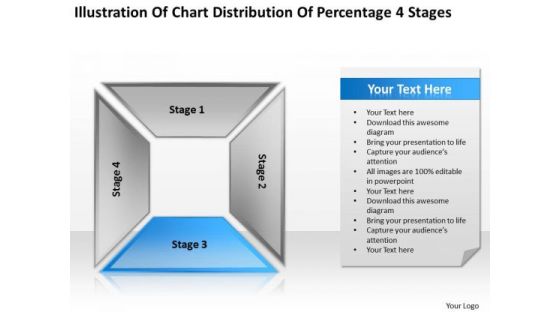
Chart Distribution Percentage 4 Stages How To Complete Business Plan PowerPoint Slides
We present our chart distribution percentage 4 stages how to complete business plan PowerPoint Slides.Use our Business PowerPoint Templates because Our PowerPoint Templates and Slides are topically designed to provide an attractive backdrop to any subject. Download and present our Process and Flows PowerPoint Templates because Our PowerPoint Templates and Slides are aesthetically designed to attract attention. We gaurantee that they will grab all the eyeballs you need. Use our Shapes PowerPoint Templates because Our PowerPoint Templates and Slides are specially created by a professional team with vast experience. They diligently strive to come up with the right vehicle for your brilliant Ideas. Present our Success PowerPoint Templates because Our PowerPoint Templates and Slides are the chords of your song. String them along and provide the lilt to your views. Download and present our Marketing PowerPoint Templates because Our PowerPoint Templates and Slides team portray an attitude of elegance. Personify this quality by using them regularly.Use these PowerPoint slides for presentations relating to Shadow, square, rectangle, perspective, vector, template, shapes, graphic, multicolor, abstract, modern, box, illustration, geometric, backdrop, colors, design, architecture, shelves, backgrounds, banner, art, cabinet, space, wardrobe, structure, block. The prominent colors used in the PowerPoint template are Blue, Black, Gray.
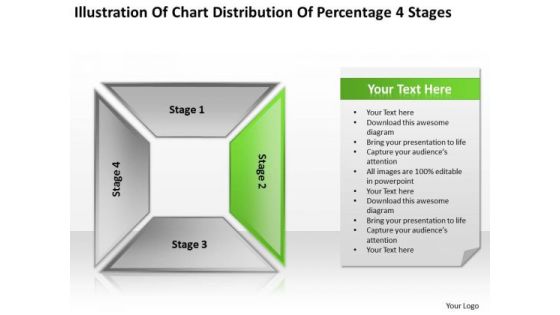
Chart Distribution Percentage 4 Stages Ppt Small Business Plan Sample PowerPoint Templates
We present our chart distribution percentage 4 stages ppt small business plan sample PowerPoint templates.Present our Business PowerPoint Templates because You should Kick up a storm with our PowerPoint Templates and Slides. The heads of your listeners will swirl with your ideas. Use our Process and Flows PowerPoint Templates because It can Leverage your style with our PowerPoint Templates and Slides. Charm your audience with your ability. Download and present our Shapes PowerPoint Templates because Our PowerPoint Templates and Slides will help you be quick off the draw. Just enter your specific text and see your points hit home. Present our Success PowerPoint Templates because Our PowerPoint Templates and Slides are Clear and concise. Use them and dispel any doubts your team may have. Download and present our Marketing PowerPoint Templates because These PowerPoint Templates and Slides will give the updraft to your ideas. See them soar to great heights with ease.Use these PowerPoint slides for presentations relating to Shadow, square, rectangle, perspective, vector, template, shapes, graphic, multicolor, abstract, modern, box, illustration, geometric, backdrop, colors, design, architecture, shelves, backgrounds, banner, art, cabinet, space, wardrobe, structure, block. The prominent colors used in the PowerPoint template are Green, Gray, Black.
Developing New Product Messaging Canvas Determining Its USP Product Capability Assessment Gantt Chart Information PDF
Understanding the capability of the product is a key point that helps the organization to better understand the market dynamic The following Gantt chart highlights the key stages of the process along with the time duration for executing the same Presenting developing new product messaging canvas determining its usp product capability assessment gantt chart information pdf to provide visual cues and insights. Share and navigate important information on one stages that need your due attention. This template can be used to pitch topics like product capability assessment gantt chart. In addtion, this PPT design contains high resolution images, graphics, etc, that are easily editable and available for immediate download.

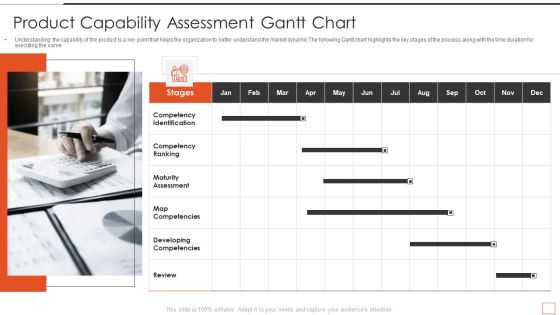
Marketing Communication Channels For Increasing Brand Awarenes Product Capability Assessment Gantt Chart Download PDF
Understanding the capability of the product is a key point that helps the organization to better understand the market dynamic The following Gantt chart highlights the key stages of the process along with the time duration for executing the same This is a marketing communication channels for increasing brand awarenes product capability assessment gantt chart download pdf template with various stages. Focus and dispense information on one stages using this creative set, that comes with editable features. It contains large content boxes to add your information on topics like product capability assessment gantt chart. You can also showcase facts, figures, and other relevant content using this PPT layout. Grab it now.
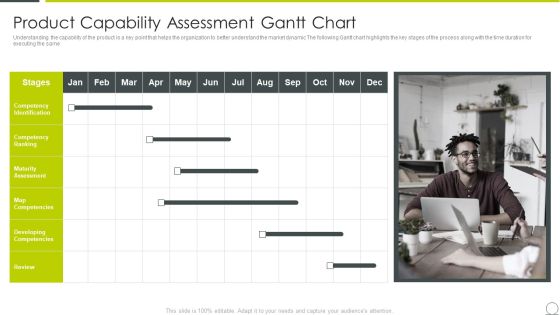
Examining Product Characteristics Brand Messaging Product Capability Assessment Gantt Chart Pictures PDF
Understanding the capability of the product is a key point that helps the organization to better understand the market dynamic The following Gantt chart highlights the key stages of the process along with the time duration for executing the same This is a examining product characteristics brand messaging product capability assessment gantt chart pictures pdf template with various stages. Focus and dispense information on one stages using this creative set, that comes with editable features. It contains large content boxes to add your information on topics like product capability assessment gantt chart. You can also showcase facts, figures, and other relevant content using this PPT layout. Grab it now.
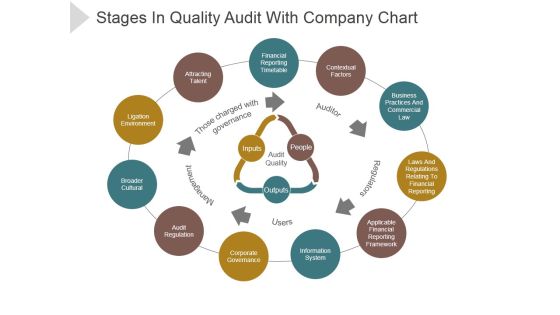
Stages In Quality Audit With Company Chart Ppt PowerPoint Presentation Files
This is a stages in quality audit with company chart ppt powerpoint presentation files. This is a eleven stage process. The stages in this process are financial reporting timetable, contextual factors, business practices and commercial law, applicable financial reporting framework.
Structural And Relationship Chart 10 Stages Non Profit Business Plans PowerPoint Templates
We present our structural_and_relationship_chart_10_stages_non_profit_business_plans_PowerPoint_templates.Download and present our Education PowerPoint Templates because Your ideas provide food for thought. Our PowerPoint Templates and Slides will help you create a dish to tickle the most discerning palate. Download our Process and Flows PowerPoint Templates because You can Create a matrix with our PowerPoint Templates and Slides. Feel the strength of your ideas click into place. Use our Marketing PowerPoint Templates because You have gained great
Structural And Relationship Chart 10 Stages Ppt Best Business Plan PowerPoint Slides
We present our structural_and_relationship_chart_10_stages_ppt_best_business_plan_PowerPoint_Slides.Download and present our Education PowerPoint Templates because It will Give impetus to the hopes of your colleagues. Our PowerPoint Templates and Slides will aid you in winning their trust. Download our Process and Flows PowerPoint Templates because Our PowerPoint Templates and Slides are specially created by a professional team with vast experience. They diligently strive to come up with the right vehicle for your
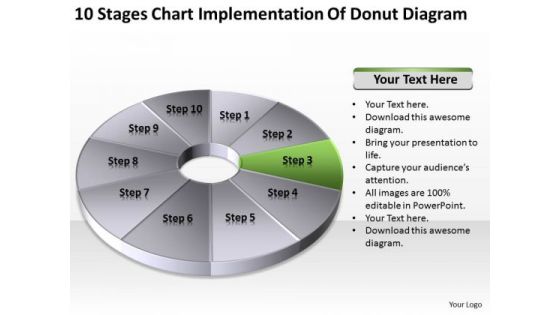
Stages Chart Implementation Of Donut Diagram Business Plans Template Free PowerPoint Slides
We present our stages chart implementation of donut diagram business plans template free PowerPoint Slides.Present our Marketing PowerPoint Templates because you can Add colour to your speech with our PowerPoint Templates and Slides. Your presentation will leave your audience speechless. Download and present our Finance PowerPoint Templates because Our PowerPoint Templates and Slides will effectively help you save your valuable time. They are readymade to fit into any presentation structure. Present our Circle Charts PowerPoint Templates because Our PowerPoint Templates and Slides are truly out of this world. Even the MIB duo has been keeping tabs on our team. Use our Business PowerPoint Templates because You can Hit the nail on the head with our PowerPoint Templates and Slides. Embed your ideas in the minds of your audience. Present our Targets PowerPoint Templates because Our PowerPoint Templates and Slides will give you great value for your money. Be assured of finding the best projection to highlight your words. Use these PowerPoint slides for presentations relating to Diagram, chart, process, circular, icon, model, business, blank, organization, sequence, numbers, 7, sequential, template, abstract, management, mba, cycle, circulation, illustration, strategy, seven, executive, design, empty, procedure, resource. The prominent colors used in the PowerPoint template are Green, Gray, Black.

Stages Chart Implementation Of Donut Diagram Creating Business Plan PowerPoint Templates
We present our stages chart implementation of donut diagram creating business plan PowerPoint templates.Download and present our Marketing PowerPoint Templates because It will Give impetus to the hopes of your colleagues. Our PowerPoint Templates and Slides will aid you in winning their trust. Use our Finance PowerPoint Templates because you should once Tap the ingenuity of our PowerPoint Templates and Slides. They are programmed to succeed. Download and present our Circle Charts PowerPoint Templates because Our PowerPoint Templates and Slides will steer your racing mind. Hit the right buttons and spur on your audience. Present our Business PowerPoint Templates because Our PowerPoint Templates and Slides will bullet point your ideas. See them fall into place one by one. Download our Targets PowerPoint Templates because Our PowerPoint Templates and Slides are like the strings of a tennis racquet. Well strung to help you serve aces.Use these PowerPoint slides for presentations relating to Diagram, chart, process, circular, icon, model, business, blank, organization, sequence, numbers, 7, sequential, template, abstract, management, mba, cycle, circulation, illustration, strategy, seven, executive, design, empty, procedure, resource. The prominent colors used in the PowerPoint template are Green, Gray, Black.

How Make Impactful Product Marketing Message Build Product Differentiation Product Capability Assessment Gantt Chart Designs PDF
Understanding the capability of the product is a key point that helps the organization to better understand the market dynamic The following Gantt chart highlights the key stages of the process along with the time duration for executing the same. Deliver and pitch your topic in the best possible manner with this how make impactful product marketing message build product differentiation product capability assessment gantt chart designs pdf. Use them to share invaluable insights on competency identification, competency ranking, maturity assessment, map competencies, developing competencies and impress your audience. This template can be altered and modified as per your expectations. So, grab it now.
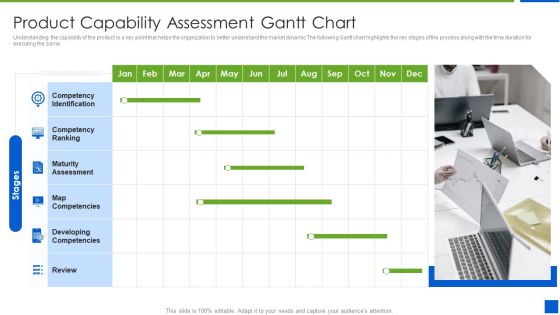
Improving Brand Recognition With Message And Differentiation Strategy Product Capability Assessment Gantt Chart Slides PDF
Understanding the capability of the product is a key point that helps the organization to better understand the market dynamic The following Gantt chart highlights the key stages of the process along with the time duration for executing the same This is a improving brand recognition with message and differentiation strategy product capability assessment gantt chart slides pdf template with various stages. Focus and dispense information on six stages using this creative set, that comes with editable features. It contains large content boxes to add your information on topics like competency, identification, developing, assessment . You can also showcase facts, figures, and other relevant content using this PPT layout. Grab it now.

Structural And Relationship Chart 10 Stages Ppt 5 How To Write Business Plans PowerPoint Templates
We present our structural_and_relationship_chart_10_stages_ppt_5_how_to_write_business_plans_PowerPoint_templates.Download and present our Education PowerPoint Templates because Our PowerPoint Templates and Slides are aesthetically designed to attract attention. We gaurantee that they will grab all the eyeballs you need. Download our Process and Flows PowerPoint Templates because Timeline crunches are a fact of life. Meet all deadlines using our PowerPoint Templates and Slides. Download our Marketing PowerPoint Templates because Our PowerPoint Templates and Slides will let your team Walk through your plans. See their energy levels rise as you show them the way. Download our Business PowerPoint Templates because They will Put the wind in your sails. Skim smoothly over the choppy waters of the market. Present our Shapes PowerPoint Templates because It will Raise the bar of your Thoughts. They are programmed to take you to the next level.Use these PowerPoint slides for presentations relating to Art, background, color, design, drawing, education, equipment, graphic, graphite, illustration, instrument, isolated, object, office, pencil, row, school, set, shape, sharp, stationery, supplies, tool, vector, white, wood, work, write. The prominent colors used in the PowerPoint template are Green, Gray, Black.

Developing Business Strategy 3d Man Making Money Saving Chart Basic Concepts
Draw Up Your Agenda On Our Developingbusinessstrategy3dmanmakingmoneysavingchartbasicconcepts Powerpoint Templates. Coax Your Audience Into Acceptance.
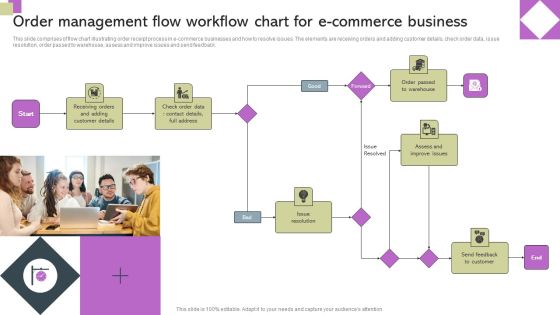
Order Management Flow Workflow Chart For E Commerce Business Ppt Professional Example Introduction PDF
This slide comprises of flow chart illustrating order receipt process in e-commerce businesses and how to resolve issues. The elements are receiving orders and adding customer details, check order data, issue resolution, order passed to warehouse, assess and improve issues and send feedback. Persuade your audience using this Order Management Flow Workflow Chart For E Commerce Business Ppt Professional Example Introduction PDF. This PPT design covers one stages, thus making it a great tool to use. It also caters to a variety of topics including Issue Resolution, Forward, Adding Customer Details, Receiving Orders. Download this PPT design now to present a convincing pitch that not only emphasizes the topic but also showcases your presentation skills.
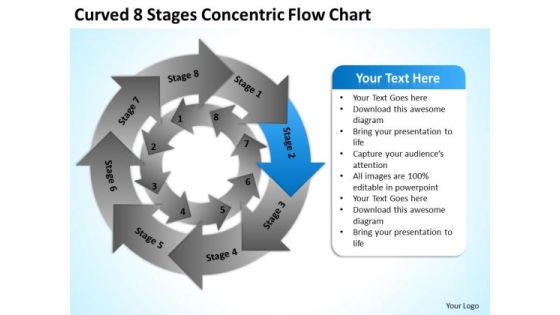
Curved 8 Stages Concentric Flow Chart Ppt Business Plans PowerPoint Templates
We present our curved 8 stages concentric flow chart ppt business plans PowerPoint templates.Present our Flow Charts PowerPoint Templates because Our PowerPoint Templates and Slides will let you Hit the right notes. Watch your audience start singing to your tune. Use our Marketing PowerPoint Templates because Our PowerPoint Templates and Slides will weave a web of your great ideas. They are gauranteed to attract even the most critical of your colleagues. Download our Business PowerPoint Templates because Our PowerPoint Templates and Slides will give you great value for your money. Be assured of finding the best projection to highlight your words. Present our Shapes PowerPoint Templates because It will let you Set new benchmarks with our PowerPoint Templates and Slides. They will keep your prospects well above par. Download and present our Flow Charts PowerPoint Templates because It is Aesthetically crafted by artistic young minds. Our PowerPoint Templates and Slides are designed to display your dexterity.Use these PowerPoint slides for presentations relating to Arrow, process, vector, icon, circular, chart, concept, wheel, set, loop, turn, flow, chromatic, sign, spectrum, rotation, recycling, pantone, symbol, diagram, circle,ring, recycle, dynamic, graphic, element, flowchart, spin, paint, graph, multicolored, cycle, circulation, palette, connection, cursor, round, collection, direction, group, motion, progress, movement, cyclic, continuity, repetition. The prominent colors used in the PowerPoint template are Blue, White, Gray.
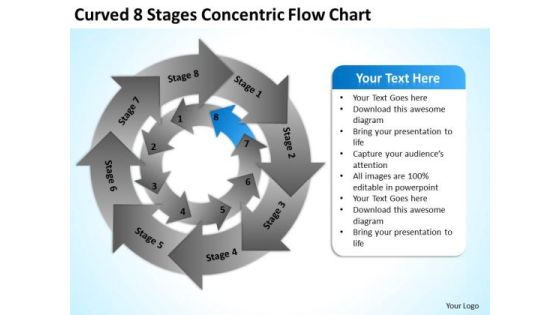
Curved 8 Stages Concentric Flow Chart Ppt How To Prepare Business Plan PowerPoint Slides
We present our curved 8 stages concentric flow chart ppt how to prepare business plan PowerPoint Slides.Present our Flow Charts PowerPoint Templates because You can Stir your ideas in the cauldron of our PowerPoint Templates and Slides. Cast a magic spell on your audience. Use our Marketing PowerPoint Templates because Our PowerPoint Templates and Slides will let your team Walk through your plans. See their energy levels rise as you show them the way. Download and present our Business PowerPoint Templates because Our PowerPoint Templates and Slides will weave a web of your great ideas. They are gauranteed to attract even the most critical of your colleagues. Use our Shapes PowerPoint Templates because Our PowerPoint Templates and Slides will fulfill your every need. Use them and effectively satisfy the desires of your audience. Use our Flow Charts PowerPoint Templates because Our PowerPoint Templates and Slides will provide you the cutting edge. Slice through the doubts in the minds of your listeners.Use these PowerPoint slides for presentations relating to Arrow, process, vector, icon, circular, chart, concept, wheel, set, loop, turn, flow, chromatic, sign, spectrum, rotation, recycling, pantone, symbol, diagram, circle,ring, recycle, dynamic, graphic, element, flowchart, spin, paint, graph, multicolored, cycle, circulation, palette, connection, cursor, round, collection, direction, group, motion, progress, movement, cyclic, continuity, repetition. The prominent colors used in the PowerPoint template are Blue, White, Gray.
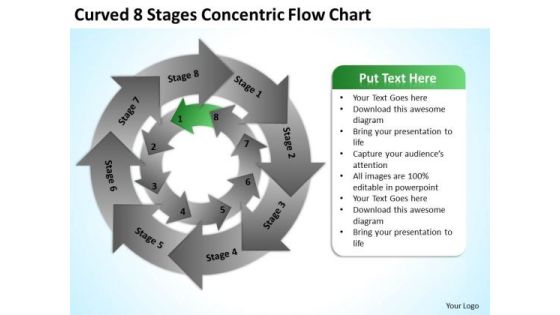
Curved 8 Stages Concentric Flow Chart Ppt Small Business Plan PowerPoint Slides
We present our curved 8 stages concentric flow chart ppt small business plan PowerPoint Slides.Use our Business PowerPoint Templates because Timeline crunches are a fact of life. Meet all deadlines using our PowerPoint Templates and Slides. Download and present our Arrows PowerPoint Templates because It can Conjure up grand ideas with our magical PowerPoint Templates and Slides. Leave everyone awestruck by the end of your presentation. Download and present our Flow Charts PowerPoint Templates because You can Raise a toast with our PowerPoint Templates and Slides. Spread good cheer amongst your audience. Use our Business PowerPoint Templates because Our PowerPoint Templates and Slides will provide you a launch platform. Give a lift off to your ideas and send them into orbit. Download our Marketing PowerPoint Templates because It can Conjure up grand ideas with our magical PowerPoint Templates and Slides. Leave everyone awestruck by the end of your presentation.Use these PowerPoint slides for presentations relating to Arrow, process, vector, icon, circular, chart, concept, wheel, set, loop, turn, flow, chromatic, sign, spectrum, rotation, recycling, pantone, symbol, diagram, circle,ring, recycle, dynamic, graphic, element, flowchart, spin, paint, graph, multicolored, cycle, circulation, palette, connection, cursor, round, collection, direction, group, motion, progress, movement, cyclic, continuity, repetition. The prominent colors used in the PowerPoint template are Green, Black, Gray.

Circular 7 Steps Pie Chart Illustration Elements Business Plan PowerPoint Templates
We present our circular 7 steps pie chart illustration elements business plan PowerPoint templates.Present our Circle Charts PowerPoint Templates because You canTake a leap off the starting blocks with our PowerPoint Templates and Slides. They will put you ahead of the competition in quick time. Download and present our Ring Charts PowerPoint Templates because you can Break through with our PowerPoint Templates and Slides. Bring down the mental barriers of your audience. Download our Shapes PowerPoint Templates because It will Give impetus to the hopes of your colleagues. Our PowerPoint Templates and Slides will aid you in winning their trust. Download our Business PowerPoint Templates because Your ideas provide food for thought. Our PowerPoint Templates and Slides will help you create a dish to tickle the most discerning palate. Use our Signs PowerPoint Templates because Our PowerPoint Templates and Slides will bullet point your ideas. See them fall into place one by one.Use these PowerPoint slides for presentations relating to teps, flow, chart, diagram, process, graph, wheel, pie, stages, segments, green, corporate, red, business, blank, arrow, yellow, curving, copyspace, slices, graphic, directional, shape, modern, cycle, illustration, circular, round, clipart, seven, colorful, clip, blue, infographic, art, work, puzzle, clockwise, financial. The prominent colors used in the PowerPoint template are Green, Gray, Black.
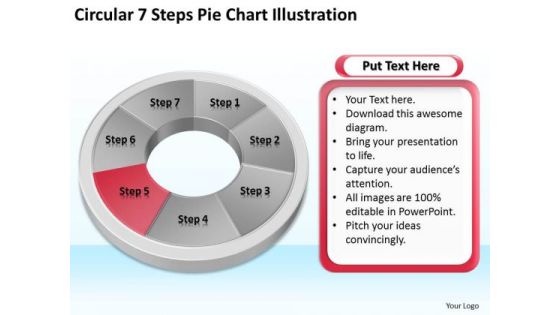
Circular 7 Steps Pie Chart Illustration Outline For Business Plan PowerPoint Templates
We present our circular 7 steps pie chart illustration outline for business plan PowerPoint templates.Download and present our Circle Charts PowerPoint Templates because Your ideas provide food for thought. Our PowerPoint Templates and Slides will help you create a dish to tickle the most discerning palate. Use our Ring Charts PowerPoint Templates because Our PowerPoint Templates and Slides will let you Hit the target. Go the full distance with ease and elan. Download and present our Shapes PowerPoint Templates because It will let you Set new benchmarks with our PowerPoint Templates and Slides. They will keep your prospects well above par. Use our Business PowerPoint Templates because Our PowerPoint Templates and Slides are aesthetically designed to attract attention. We gaurantee that they will grab all the eyeballs you need. Use our Signs PowerPoint Templates because You can Hit the nail on the head with our PowerPoint Templates and Slides. Embed your ideas in the minds of your audience.Use these PowerPoint slides for presentations relating to teps, flow, chart, diagram, process, graph, wheel, pie, stages, segments, green, corporate, red, business, blank, arrow, yellow, curving, copyspace, slices, graphic, directional, shape, modern, cycle, illustration, circular, round, clipart, seven, colorful, clip, blue, infographic, art, work, puzzle, clockwise, financial. The prominent colors used in the PowerPoint template are Red, Gray, Black.
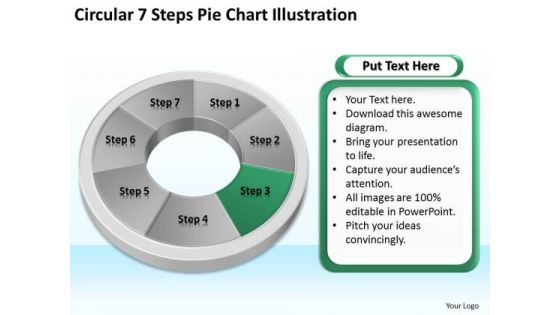
Circular 7 Steps Pie Chart Illustration How Do Make Business Plan PowerPoint Templates
We present our circular 7 steps pie chart illustration how do make business plan PowerPoint templates.Present our Circle Charts PowerPoint Templates because Our PowerPoint Templates and Slides has conjured up a web of all you need with the help of our great team. Use them to string together your glistening ideas. Download and present our Ring Charts PowerPoint Templates because You can Create a matrix with our PowerPoint Templates and Slides. Feel the strength of your ideas click into place. Use our Shapes PowerPoint Templates because Our PowerPoint Templates and Slides are Clear and concise. Use them and dispel any doubts your team may have. Download and present our Business PowerPoint Templates because It will get your audience in sync. Use our Signs PowerPoint Templates because You can Be the star of the show with our PowerPoint Templates and Slides. Rock the stage with your ideas.Use these PowerPoint slides for presentations relating to teps, flow, chart, diagram, process, graph, wheel, pie, stages, segments, green, corporate, red, business, blank, arrow, yellow, curving, copyspace, slices, graphic, directional, shape, modern, cycle, illustration, circular, round, clipart, seven, colorful, clip, blue, infographic, art, work, puzzle, clockwise, financial. The prominent colors used in the PowerPoint template are Green, Gray, Black.
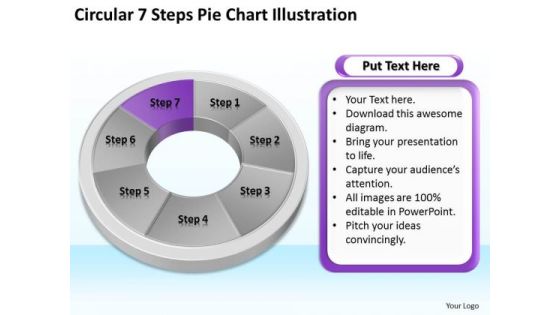
Circular 7 Steps Pie Chart Illustration Business Plan Sample PowerPoint Templates
We present our circular 7 steps pie chart illustration business plan sample PowerPoint templates.Download and present our Circle Charts PowerPoint Templates because you can Break through with our PowerPoint Templates and Slides. Bring down the mental barriers of your audience. Download and present our Ring Charts PowerPoint Templates because Our PowerPoint Templates and Slides will let your words and thoughts hit bullseye everytime. Download our Shapes PowerPoint Templates because Our PowerPoint Templates and Slides will let you Hit the target. Go the full distance with ease and elan. Present our Business PowerPoint Templates because Our PowerPoint Templates and Slides are like the strings of a tennis racquet. Well strung to help you serve aces. Use our Signs PowerPoint Templates because Our PowerPoint Templates and Slides will embellish your thoughts. See them provide the desired motivation to your team.Use these PowerPoint slides for presentations relating to teps, flow, chart, diagram, process, graph, wheel, pie, stages, segments, green, corporate, red, business, blank, arrow, yellow, curving, copyspace, slices, graphic, directional, shape, modern, cycle, illustration, circular, round, clipart, seven, colorful, clip, blue, infographic, art, work, puzzle, clockwise, financial. The prominent colors used in the PowerPoint template are Pink, Gray, Black.
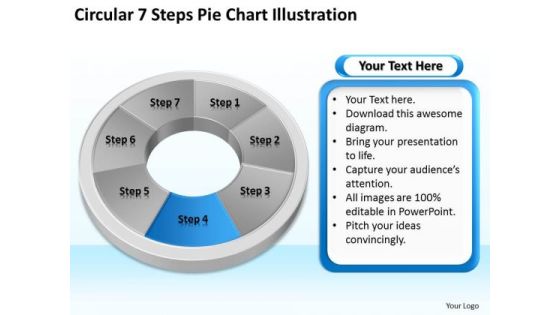
Circular 7 Steps Pie Chart Illustration Business Plan Template PowerPoint Slides
We present our circular 7 steps pie chart illustration business plan template PowerPoint Slides.Use our Circle Charts PowerPoint Templates because It will Strengthen your hand with your thoughts. They have all the aces you need to win the day. Download and present our Ring Charts PowerPoint Templates because Our PowerPoint Templates and Slides will fulfill your every need. Use them and effectively satisfy the desires of your audience. Present our Shapes PowerPoint Templates because Our PowerPoint Templates and Slides will let you Hit the target. Go the full distance with ease and elan. Use our Business PowerPoint Templates because You have gained great respect for your brilliant ideas. Use our PowerPoint Templates and Slides to strengthen and enhance your reputation. Download our Signs PowerPoint Templates because You canTake a leap off the starting blocks with our PowerPoint Templates and Slides. They will put you ahead of the competition in quick time.Use these PowerPoint slides for presentations relating to teps, flow, chart, diagram, process, graph, wheel, pie, stages, segments, green, corporate, red, business, blank, arrow, yellow, curving, copyspace, slices, graphic, directional, shape, modern, cycle, illustration, circular, round, clipart, seven, colorful, clip, blue, infographic, art, work, puzzle, clockwise, financial. The prominent colors used in the PowerPoint template are Blue, Gray, Black.

Circular 7 Steps Pie Chart Illustration Real Estate Business Plan PowerPoint Slides
We present our circular 7 steps pie chart illustration real estate business plan PowerPoint Slides.Use our Circle Charts PowerPoint Templates because They will Put your wonderful verbal artistry on display. Our PowerPoint Templates and Slides will provide you the necessary glam and glitter. Present our Ring Charts PowerPoint Templates because You have a driving passion to excel in your field. Our PowerPoint Templates and Slides will prove ideal vehicles for your ideas. Download and present our Shapes PowerPoint Templates because Our PowerPoint Templates and Slides will bullet point your ideas. See them fall into place one by one. Download our Business PowerPoint Templates because It will Give impetus to the hopes of your colleagues. Our PowerPoint Templates and Slides will aid you in winning their trust. Download and present our Signs PowerPoint Templates because Our PowerPoint Templates and Slides will let Your superior ideas hit the target always and everytime.Use these PowerPoint slides for presentations relating to teps, flow, chart, diagram, process, graph, wheel, pie, stages, segments, green, corporate, red, business, blank, arrow, yellow, curving, copyspace, slices, graphic, directional, shape, modern, cycle, illustration, circular, round, clipart, seven, colorful, clip, blue, infographic, art, work, puzzle, clockwise, financial. The prominent colors used in the PowerPoint template are Pink, Gray, Black.
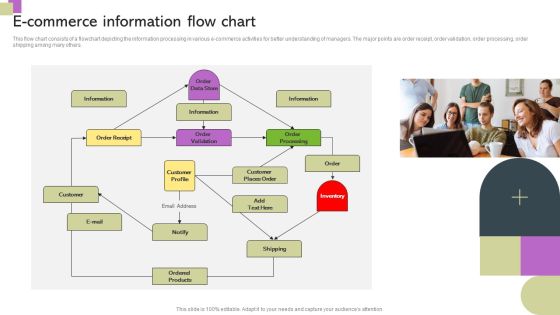
E Commerce Information Flow Chart Ppt PowerPoint Presentation Gallery Graphics Pictures PDF
This flow chart consists of a flowchart depicting the information processing in various e-commerce activities for better understanding of managers. The major points are order receipt, order validation, order processing, order shipping among many others. Persuade your audience using this E Commerce Information Flow Chart Ppt PowerPoint Presentation Gallery Graphics Pictures PDF. This PPT design covers one stages, thus making it a great tool to use. It also caters to a variety of topics including Information, Order Receipt, Order Processing, Customer Places Order. Download this PPT design now to present a convincing pitch that not only emphasizes the topic but also showcases your presentation skills.

Product USP Product Capability Assessment Gantt Chart Ppt Infographics Pictures PDF
The Schedule of the Product Capability assessment process can be shown through this Gantt chart provided in the slide. Elucidate your project plan using our product usp product capability assessment gantt chart ppt infographics pictures pdf. Capture the timeframe for every release by outlining crucial details like project beginning and end date, status, and assigned team. Establish coordination with other team members, share your product plans, and discuss the project progress with the executives using this template. Furthermore, this task management chart helps you align your activities efficiently. Utilize the versatile nature of this template to initiate high-level resource planning and implement it flexibly for the benefit of your business. The slide is easy-to-edit so download it and schedule your projects resourcefully.

Return Material Authorization Flow Chart Ppt PowerPoint Presentation File Grid PDF
This slide shows the flow chart which can be used in return material authorization process. It includes various steps such as product returned by customer, RMA creation, product inspection, etc. Presenting Return Material Authorization Flow Chart Ppt PowerPoint Presentation File Grid PDF to dispense important information. This template comprises one stages. It also presents valuable insights into the topics including Product Returned Customer, Product Inspection, RMA Creation. This is a completely customizable PowerPoint theme that can be put to use immediately. So, download it and address the topic impactfully.
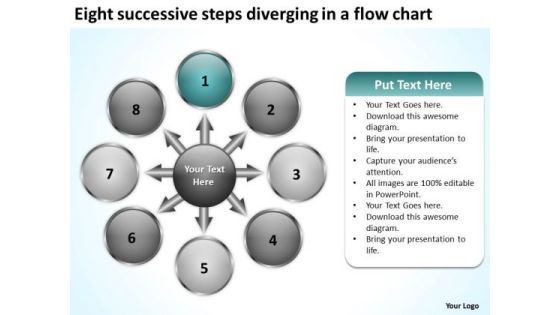
Eight Successive Steps Diverging A Flow Chart Pie Diagram PowerPoint Slides
We present our eight successive steps diverging a flow chart Pie Diagram PowerPoint Slides.Use our Business PowerPoint Templates because profit levels have been steady over the recent past. Spread your heightened excitement to others in the room. Use our Circle Charts PowerPoint Templates because you have configured your targets, identified your goals as per priority and importance. Download our Arrows PowerPoint Templates because there are different paths to gain the necessary knowledge to acheive it. Download our Shapes PowerPoint Templates because you can Refine them all as you take them through the numerous filtering stages of the funnel of your quality control process. Download and present our Flow charts PowerPoint Templates because this slide helps you to give your team an overview of your capability and insight into the minute details of the overall picture highlighting the interdependence at every operational level.Use these PowerPoint slides for presentations relating to Arrows, blank, business, central, centralized, chart, circle, circular, circulation concept, conceptual, converging, design, diagram, empty, executive, icon, idea illustration, management, map, mapping, moa, model, numbers, organization outwards, pointing, procedure, process, radial, radiating, relationship, resource sequence, sequential, seven, square, strategy, template. The prominent colors used in the PowerPoint template are Blue, Gray, White. Presenters tell us our eight successive steps diverging a flow chart Pie Diagram PowerPoint Slides are Excellent. Presenters tell us our centralized PowerPoint templates and PPT Slides are Pleasant. PowerPoint presentation experts tell us our eight successive steps diverging a flow chart Pie Diagram PowerPoint Slides are specially created by a professional team with vast experience. They diligently strive to come up with the right vehicle for your brilliant Ideas. We assure you our circle PowerPoint templates and PPT Slides will help them to explain complicated concepts. Customers tell us our eight successive steps diverging a flow chart Pie Diagram PowerPoint Slides are Splendid. People tell us our central PowerPoint templates and PPT Slides effectively help you save your valuable time.

Eight Successive Steps Diverging A Flow Chart Circular Spoke Diagram PowerPoint Templates
We present our eight successive steps diverging a flow chart Circular Spoke Diagram PowerPoint templates.Download and present our Business PowerPoint Templates because infrastructure growth is an obvious requirement of today.inform your group on how exactly this potential is tailor made for you. Present our Circle Charts PowerPoint Templates because you have the process in your head, our template design showing will illuminate your thoughts. Use our Arrows PowerPoint Templates because you know your business and have a vision for it. Present our Shapes PowerPoint Templates because the mind is always whirring with new ideas. Download our Flow charts PowerPoint Templates because you understand the illness and its causes.Use these PowerPoint slides for presentations relating to Arrows, blank, business, central, centralized, chart, circle, circular, circulation concept, conceptual, converging, design, diagram, empty, executive, icon, idea illustration, management, map, mapping, moa, model, numbers, organization outwards, pointing, procedure, process, radial, radiating, relationship, resource sequence, sequential, seven, square, strategy, template. The prominent colors used in the PowerPoint template are Blue, Gray, White. Presenters tell us our eight successive steps diverging a flow chart Circular Spoke Diagram PowerPoint templates are Pleasant. Presenters tell us our circle PowerPoint templates and PPT Slides are Precious. PowerPoint presentation experts tell us our eight successive steps diverging a flow chart Circular Spoke Diagram PowerPoint templates are Awesome. We assure you our circular PowerPoint templates and PPT Slides are Stylish. Customers tell us our eight successive steps diverging a flow chart Circular Spoke Diagram PowerPoint templates are Dynamic. People tell us our business PowerPoint templates and PPT Slides are Charming.

PowerPoint Template Cycle Process Ppt Themes
PowerPoint Template Cycle Process PPT Themes-Cycle Diagrams are a type of graphics that shows how items are related to one another in a repeating cycle. In a cycle diagram, you can explain the main events in the cycle, how they interact, and how the cycle repeats.-PowerPoint Template Cycle Process PPT Themes-Background, Business, Chart, Circle, Circular, Marketing, Management, Flow, Graph, Process, Round, Segmented, Sequence, Wheel, Diagram, Division, Continuity, Template, Web, Illustration
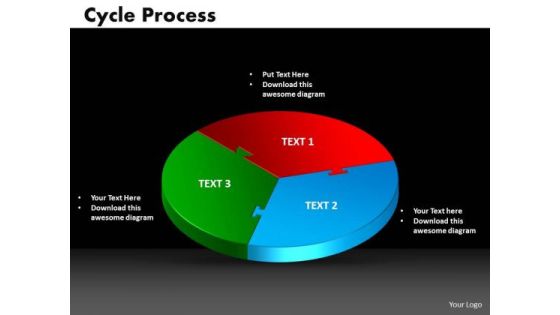
PowerPoint Template Cycle Process Ppt Designs
PowerPoint Template Cycle Process PPT Designs-Cycle Diagrams are a type of graphics that shows how items are related to one another in a repeating cycle. In a cycle diagram, you can explain the main events in the cycle, how they interact, and how the cycle repeats.-PowerPoint Template Cycle Process PPT Designs-Background, Business, Chart, Circle, Circular, Marketing, Management, Flow, Graph, Process, Round, Segmented, Sequence, Wheel, Diagram, Division, Continuity, Template, Web, Illustration

3 Stages Stacked Shapes Chart Ppt How To Type Business Plan PowerPoint Slides
We present our 3 stages stacked shapes chart ppt how to type business plan PowerPoint Slides.Present our Business PowerPoint Templates because Our PowerPoint Templates and Slides will let you Leave a lasting impression to your audiences. They possess an inherent longstanding recall factor. Present our Venn Diagrams PowerPoint Templates because You should Bet on your luck with our PowerPoint Templates and Slides. Be assured that you will hit the jackpot. Download and present our Layers PowerPoint Templates because Our PowerPoint Templates and Slides will give good value for money. They also have respect for the value of your time. Download and present our Circle Charts PowerPoint Templates because Your ideas provide food for thought. Our PowerPoint Templates and Slides will help you create a dish to tickle the most discerning palate. Download our Shapes PowerPoint Templates because You canTake a leap off the starting blocks with our PowerPoint Templates and Slides. They will put you ahead of the competition in quick time.Use these PowerPoint slides for presentations relating to diagram, process, business, graphic, design, ideas, model, data, chart, project, schema, corporate, implementation, tag, plan, engineering, concept, vector, success, symbol, stack, circle, guide, work flow, development, shape, team, management, cycle, steps, illustration, system, strategy, objects, phase, professional, organization, implement, background, image, detail, structure, product. The prominent colors used in the PowerPoint template are Blue, Gray, White.
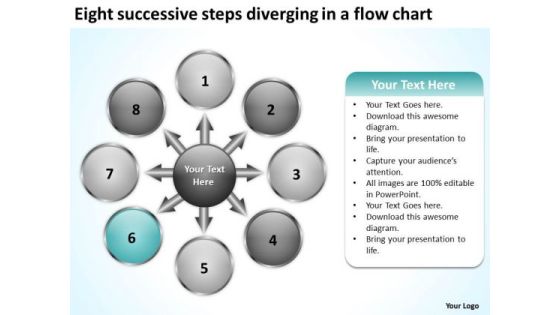
Eight Successive Steps Diverging A Flow Chart Pie Network PowerPoint Slides
We present our eight successive steps diverging a flow chart Pie Network PowerPoint Slides.Download our Business PowerPoint Templates because profit levels have been steady over the recent past. Spread your heightened excitement to others in the room. Present our Circle Charts PowerPoint Templates because they are the tools that helped most of us evolve. Use our Arrows PowerPoint Templates because it depicts that Original thinking is the need of the hour. Download our Shapes PowerPoint Templates because colours generate instant reactions in our brains. Use our Flow charts PowerPoint Templates because you should Emphasise the process of your business or corporate growth.Use these PowerPoint slides for presentations relating to Arrows, blank, business, central, centralized, chart, circle, circular, circulation concept, conceptual, converging, design, diagram, empty, executive, icon, idea illustration, management, map, mapping, moa, model, numbers, organization outwards, pointing, procedure, process, radial, radiating, relationship, resource sequence, sequential, seven, square, strategy, template. The prominent colors used in the PowerPoint template are Blue, Gray, White. Presenters tell us our eight successive steps diverging a flow chart Pie Network PowerPoint Slides have awesome images to get your point across. Presenters tell us our business PowerPoint templates and PPT Slides are Glamorous. PowerPoint presentation experts tell us our eight successive steps diverging a flow chart Pie Network PowerPoint Slides will make the presenter successul in his career/life. We assure you our circulation PowerPoint templates and PPT Slides provide you with a vast range of viable options. Select the appropriate ones and just fill in your text. Customers tell us our eight successive steps diverging a flow chart Pie Network PowerPoint Slides are readymade to fit into any presentation structure. People tell us our central PowerPoint templates and PPT Slides are Pleasant.

Chart With At Symbol Online Marketing PowerPoint Templates Ppt Backgrounds For Slides 0313
We present our Chart With At Symbol Online Marketing PowerPoint Templates PPT Backgrounds For Slides 0313.Use our Signs PowerPoint Templates because Our PowerPoint Templates and Slides will provide weight to your words. They will bring out the depth of your thought process. Download and present our Pie charts PowerPoint Templates because Our PowerPoint Templates and Slides will definately Enhance the stature of your presentation. Adorn the beauty of your thoughts with their colourful backgrounds. Download and present our Business PowerPoint Templates because Our PowerPoint Templates and Slides have the Brilliant backdrops. Guaranteed to illuminate the minds of your audience. Download and present our Marketing PowerPoint Templates because Our PowerPoint Templates and Slides offer you the widest possible range of options. Download our Future PowerPoint Templates because Our PowerPoint Templates and Slides will weave a web of your great ideas. They are gauranteed to attract even the most critical of your colleagues.Use these PowerPoint slides for presentations relating to Email symbol with pie chart, signs, pie charts, business, marketing, future. The prominent colors used in the PowerPoint template are Gray, Blue, Red.
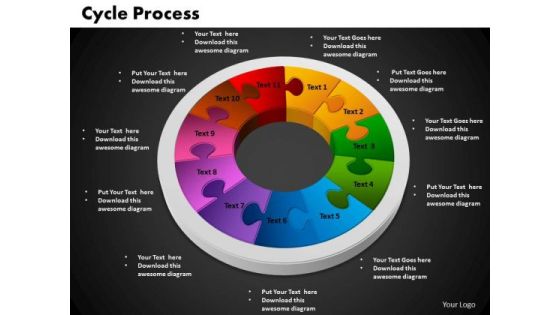
PowerPoint Theme Cycle Process Ppt Presentation
PowerPoint Theme Cycle Process PPT Presentation-Cycle Diagrams are a type of graphics that shows how items are related to one another in a repeating cycle. In a cycle diagram, you can explain the main events in the cycle, how they interact, and how the cycle repeats. -PowerPoint Theme Cycle Process PPT Presentation-Business, Chart, Circle, Cycle, Marketing, Manage, Investment, Information, Growth, Graph, Flow, Process, Progress, Recycle, Rotation, Sequence, Sphere, Plan, Diagram, Direction
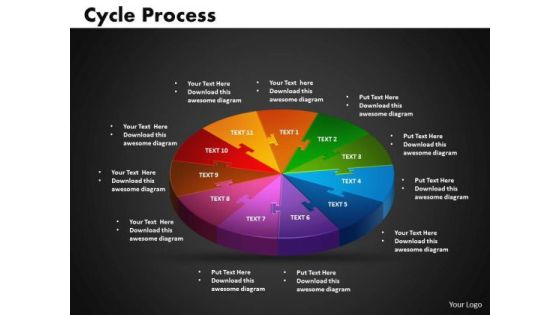
PowerPoint Design Cycle Process Ppt Design
PowerPoint Design Cycle Process PPT Design-Cycle Diagrams are a type of graphics that shows how items are related to one another in a repeating cycle. In a cycle diagram, you can explain the main events in the cycle, how they interact, and how the cycle repeats. -PowerPoint Design Cycle Process PPT Design-Business, Chart, Circle, Cycle, Marketing, Manage, Investment, Information, Growth, Graph, Flow, Process, Progress, Recycle, Rotation, Sequence, Sphere, Plan, Diagram, Direction

Scamper Technique Process Flow Ppt Slides
This is a scamper technique process flow ppt slides. This is a seven stage process. The stages in this process are business, marketing, circle charts\n\n

Donut Pie Chart For Data Comparisons 8 Stages Example Business Plan PowerPoint Slides
We present our donut pie chart for data comparisons 8 stages example business plan PowerPoint Slides.Download and present our Success PowerPoint Templates because You are an avid believer in ethical practices. Highlight the benefits that accrue with our PowerPoint Templates and Slides. Download our Finance PowerPoint Templates because You can Channelise the thoughts of your team with our PowerPoint Templates and Slides. Urge them to focus on the goals you have set. Use our Arrows PowerPoint Templates because You should Bet on your luck with our PowerPoint Templates and Slides. Be assured that you will hit the jackpot. Download and present our Circle Charts PowerPoint Templates because You are working at that stage with an air of royalty. Let our PowerPoint Templates and Slides be the jewels in your crown. Download and present our Business PowerPoint Templates because They will Put the wind in your sails. Skim smoothly over the choppy waters of the market.Use these PowerPoint slides for presentations relating to Chart, wheel, pie, graph, vector, process, marketing, diagram, business, catalog, website, network, statistics, model, document, junction, plan, presentation, template, circle, brochure, data, stock, management, box, options, direction, design, company, navigation, financial, structure, button, goals, results. The prominent colors used in the PowerPoint template are Blue, Gray, Black.
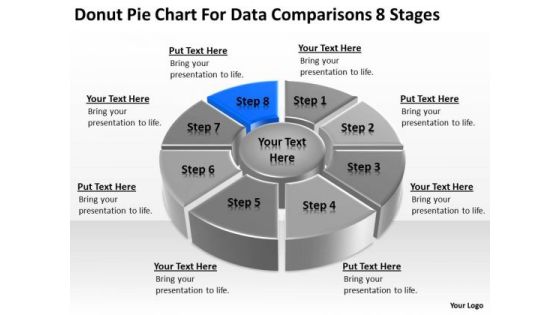
Chart For Data Comparisons 8 Stages Ppt Sample Business Plan Restaurant PowerPoint Templates
We present our chart for data comparisons 8 stages ppt sample business plan restaurant PowerPoint templates.Use our Competition PowerPoint Templates because Our PowerPoint Templates and Slides will let you Clearly mark the path for others to follow. Use our Marketing PowerPoint Templates because Our PowerPoint Templates and Slides have the Brilliant backdrops. Guaranteed to illuminate the minds of your audience. Download and present our Business PowerPoint Templates because Our PowerPoint Templates and Slides will help you be quick off the draw. Just enter your specific text and see your points hit home. Download our Circle Charts PowerPoint Templates because Our PowerPoint Templates and Slides will provide the perfect balance. Your weighty ideas will get the ideal impetus. Download and present our Shapes PowerPoint Templates because You can Give birth to your ideas with our PowerPoint Templates and Slides. See them grow big and strong in record time.Use these PowerPoint slides for presentations relating to Chart, wheel, pie, graph, vector, process, marketing, diagram, business, catalog, website, network, statistics, model, document, junction, plan, presentation, template, circle, brochure, data, stock, management, box, options, direction, design, company, navigation, financial, structure, button, goals, results. The prominent colors used in the PowerPoint template are Blue, Black, Gray.
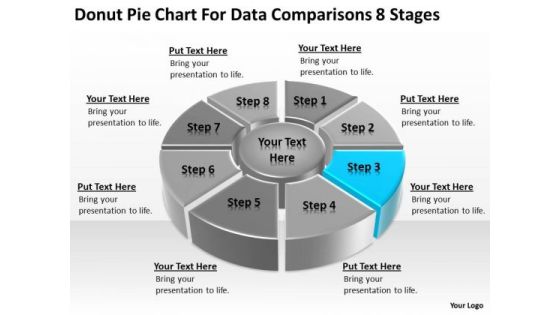
Donut Pie Chart For Data Comparisons 8 Stages Business Action Plan PowerPoint Templates
We present our donut pie chart for data comparisons 8 stages business action plan PowerPoint templates.Download our Success PowerPoint Templates because Our PowerPoint Templates and Slides are effectively colour coded to prioritise your plans They automatically highlight the sequence of events you desire. Present our Finance PowerPoint Templates because you should once Tap the ingenuity of our PowerPoint Templates and Slides. They are programmed to succeed. Present our Arrows PowerPoint Templates because Your audience will believe you are the cats whiskers. Present our Circle Charts PowerPoint Templates because You can Zap them with our PowerPoint Templates and Slides. See them reel under the impact. Download our Business PowerPoint Templates because It can Leverage your style with our PowerPoint Templates and Slides. Charm your audience with your ability.Use these PowerPoint slides for presentations relating to Chart, wheel, pie, graph, vector, process, marketing, diagram, business, catalog, website, network, statistics, model, document, junction, plan, presentation, template, circle, brochure, data, stock, management, box, options, direction, design, company, navigation, financial, structure, button, goals, results. The prominent colors used in the PowerPoint template are Blue, Gray, Black.
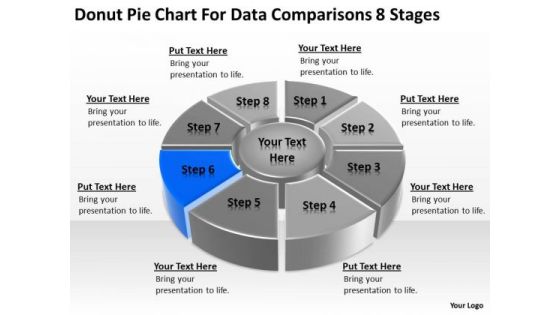
Donut Pie Chart For Data Comparisons 8 Stages Business Plan Examples PowerPoint Templates
We present our donut pie chart for data comparisons 8 stages business plan examples PowerPoint templates.Download and present our Success PowerPoint Templates because You can Stir your ideas in the cauldron of our PowerPoint Templates and Slides. Cast a magic spell on your audience. Download and present our Finance PowerPoint Templates because You should Kick up a storm with our PowerPoint Templates and Slides. The heads of your listeners will swirl with your ideas. Use our Arrows PowerPoint Templates because You should Ascend the ladder of success with ease. Our PowerPoint Templates and Slides will provide strong and sturdy steps. Download and present our Circle Charts PowerPoint Templates because Your ideas provide food for thought. Our PowerPoint Templates and Slides will help you create a dish to tickle the most discerning palate. Use our Business PowerPoint Templates because Our PowerPoint Templates and Slides are conceived by a dedicated team. Use them and give form to your wondrous ideas.Use these PowerPoint slides for presentations relating to Chart, wheel, pie, graph, vector, process, marketing, diagram, business, catalog, website, network, statistics, model, document, junction, plan, presentation, template, circle, brochure, data, stock, management, box, options, direction, design, company, navigation, financial, structure, button, goals, results. The prominent colors used in the PowerPoint template are Blue, Gray, Black.

Donut Pie Chart For Data Comparisons 8 Stages Business Plans PowerPoint Templates
We present our donut pie chart for data comparisons 8 stages business plans PowerPoint templates.Download our Success PowerPoint Templates because Our PowerPoint Templates and Slides will embellish your thoughts. See them provide the desired motivation to your team. Download and present our Finance PowerPoint Templates because Our PowerPoint Templates and Slides offer you the widest possible range of options. Use our Arrows PowerPoint Templates because Our PowerPoint Templates and Slides are specially created by a professional team with vast experience. They diligently strive to come up with the right vehicle for your brilliant Ideas. Download our Circle Charts PowerPoint Templates because Our PowerPoint Templates and Slides will bullet point your ideas. See them fall into place one by one. Present our Business PowerPoint Templates because It will Give impetus to the hopes of your colleagues. Our PowerPoint Templates and Slides will aid you in winning their trust.Use these PowerPoint slides for presentations relating to Chart, wheel, pie, graph, vector, process, marketing, diagram, business, catalog, website, network, statistics, model, document, junction, plan, presentation, template, circle, brochure, data, stock, management, box, options, direction, design, company, navigation, financial, structure, button, goals, results. The prominent colors used in the PowerPoint template are Blue, Gray, Black.

Bubble Chart Companys Business Model Canvas Ppt PowerPoint Presentation Professional Slide Portrait
This is a bubble chart companys business model canvas ppt powerpoint presentation professional slide portrait. This is a three stage process. The stages in this process are.
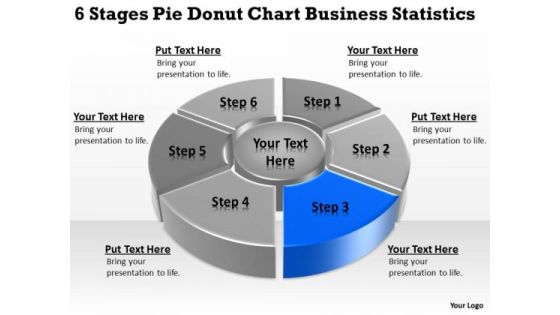
Stages Pie Donut Chart Business Statistics How To Write Up Plan PowerPoint Slides
We present our stages pie donut chart business statistics how to write up plan PowerPoint Slides.Use our Circle Charts PowerPoint Templates because It can Leverage your style with our PowerPoint Templates and Slides. Charm your audience with your ability. Present our Business PowerPoint Templates because You can Zap them with our PowerPoint Templates and Slides. See them reel under the impact. Download our Marketing PowerPoint Templates because Our PowerPoint Templates and Slides are the chords of your song. String them along and provide the lilt to your views. Download and present our Finance PowerPoint Templates because Our PowerPoint Templates and Slides are a sure bet. Gauranteed to win against all odds. Present our Shapes PowerPoint Templates because You are well armed with penetrative ideas. Our PowerPoint Templates and Slides will provide the gunpowder you need.Use these PowerPoint slides for presentations relating to arrow, vector, pie, chart, round, flow, slices, steps, red, process, graph, wheel, green, corporate, business, blank, yellow, curving, diagram, graphic, directional, shape, modern, cycle, illustration, circular, clipart, stages, seven, segments, colorful, clip, blue, art, work, clockwise, financial. The prominent colors used in the PowerPoint template are Blue, Gray, Black.
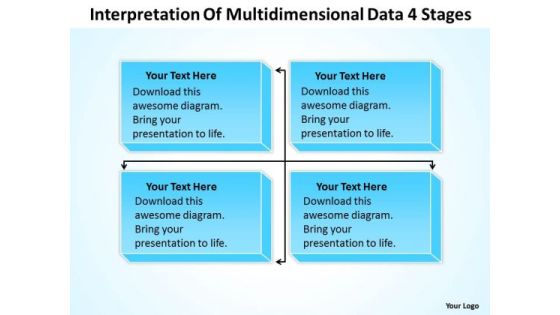
Template For Organizational Chart Of Multidimensional Data 4 Stages PowerPoint Templates
We present our template for organizational chart of multidimensional data 4 stages powerpoint templates.Use our Advertising PowerPoint Templates because You can Rise to the occasion with our PowerPoint Templates and Slides. You will bring your audience on their feet in no time. Present our Leadership PowerPoint Templates because Our PowerPoint Templates and Slides team portray an attitude of elegance. Personify this quality by using them regularly. Download our Arrows PowerPoint Templates because You can Connect the dots. Fan expectations as the whole picture emerges. Download our Org Charts PowerPoint Templates because Our PowerPoint Templates and Slides will let you Clearly mark the path for others to follow. Present our Business PowerPoint Templates because Our PowerPoint Templates and Slides are specially created by a professional team with vast experience. They diligently strive to come up with the right vehicle for your brilliant Ideas. Use these PowerPoint slides for presentations relating to Chart, flow, organization, flowchart, diagram, sitemap, process, box, arrow, graph, business, graphical, data, design, important, rectangle, corporate, plan, president, concept, hierarchy, glossy, teamwork, tier, chain, supervisor, relation, steps, glassy, connection, ladder, administration, group, connect, organize, connectivity, site-map, office, financial, structure, officer, glass. The prominent colors used in the PowerPoint template are Blue, Gray, Black.

Template For Organizational Chart Shows Relationship Of Various Units PowerPoint Templates
We present our template for organizational chart shows relationship of various units powerpoint templates.Download our Advertising PowerPoint Templates because Timeline crunches are a fact of life. Meet all deadlines using our PowerPoint Templates and Slides. Download our Leadership PowerPoint Templates because Our PowerPoint Templates and Slides offer you the widest possible range of options. Download our Arrows PowerPoint Templates because Our PowerPoint Templates and Slides are conceived by a dedicated team. Use them and give form to your wondrous ideas. Use our Org Charts PowerPoint Templates because It is Aesthetically crafted by artistic young minds. Our PowerPoint Templates and Slides are designed to display your dexterity. Download and present our Business PowerPoint Templates because Your audience will believe you are the cats whiskers.Use these PowerPoint slides for presentations relating to Chart, flow, organization, flowchart, diagram, sitemap, process, box, arrow, graph, business, graphical, data, design, important, rectangle, corporate, plan, president, concept, hierarchy, glossy, teamwork, tier, chain, supervisor, relation, steps, glassy, connection, ladder, administration, group, connect, organize, connectivity, site-map, office, financial, structure, officer, glass. The prominent colors used in the PowerPoint template are Blue, Gray, Black.
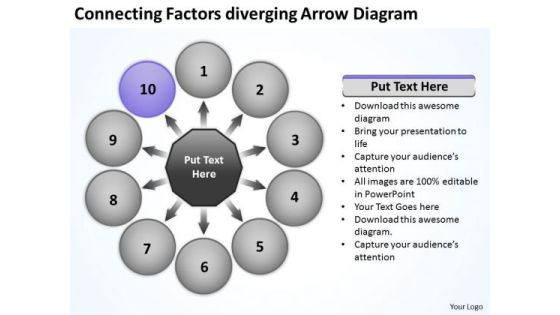
Connecting Factors Diverging Arrow Diagram Business Circular Flow Chart PowerPoint Slides
We present our connecting factors diverging arrow diagram business Circular Flow Chart PowerPoint Slides.Download and present our Success PowerPoint Templates because you have the product you need. Download and present our Arrows PowerPoint Templates because you can Transmit this concern to your staff using our helpful slides. Present our Business PowerPoint Templates because spell out your advertising plans to increase market share. The feedback has been positive and productive. Use our Shapes PowerPoint Templates because it shows how one can contribute to the overall feeling of well-being. Download our Flow Charts PowerPoint Templates because this template will explain the value of its wellness to human life.Use these PowerPoint slides for presentations relating to Access, Arrow, Business, Chart, Circle, Concept, Conceptual, Connection, Corporate, Creative, Graphic, Illustration, Process, Shape, Template, Text, Usable, Web, Website. The prominent colors used in the PowerPoint template are Purple, Gray, Black. People tell us our connecting factors diverging arrow diagram business Circular Flow Chart PowerPoint Slides are Energetic. Use our Conceptual PowerPoint templates and PPT Slides are Beautiful. Professionals tell us our connecting factors diverging arrow diagram business Circular Flow Chart PowerPoint Slides are designed to make your presentations professional. Presenters tell us our Chart PowerPoint templates and PPT Slides are Perfect. Professionals tell us our connecting factors diverging arrow diagram business Circular Flow Chart PowerPoint Slides are Enchanting. PowerPoint presentation experts tell us our Chart PowerPoint templates and PPT Slides are Exuberant.
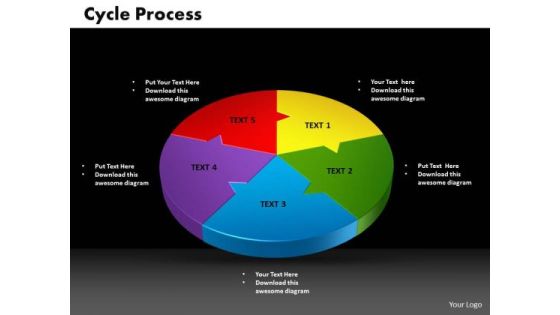
PowerPoint Template Cycle Process Business Ppt Theme
PowerPoint Template Cycle Process Business PPT Theme-Cycle Diagrams are a type of graphics that shows how items are related to one another in a repeating cycle. In a cycle diagram, you can explain the main events in the cycle, how they interact, and how the cycle repeats.-PowerPoint Template Cycle Process Business PPT Theme-Background, Business, Chart, Circle, Circular, Marketing, Management, Flow, Graph, Process, Round, Segmented, Sequence, Wheel, Diagram, Division, Continuity, Template, Web, Illustration

PowerPoint Slide Cycle Process Diagram Ppt Presentation
PowerPoint Slide Cycle Process Diagram PPT Presentation-Cycle Diagrams are a type of graphics that shows how items are related to one another in a repeating cycle. In a cycle diagram, you can explain the main events in the cycle, how they interact, and how the cycle repeats.-PowerPoint Slide Cycle Process Diagram PPT Presentation-Background, Business, Chart, Circle, Circular, Marketing, Management, Flow, Graph, Process, Round, Segmented, Sequence, Wheel, Diagram, Division, Continuity, Template, Web, Illustration
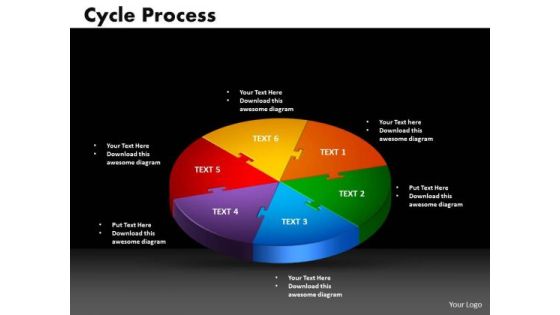
PowerPoint Template Cycle Process Success Ppt Theme
PowerPoint Template Cycle Process Success PPT Theme-Cycle Diagrams are a type of graphics that shows how items are related to one another in a repeating cycle. In a cycle diagram, you can explain the main events in the cycle, how they interact, and how the cycle repeats.-PowerPoint Template Cycle Process Success PPT Theme-Background, Business, Chart, Circle, Circular, Marketing, Management, Flow, Graph, Process, Round, Segmented, Sequence, Wheel, Diagram, Division, Continuity, Template, Web, Illustration
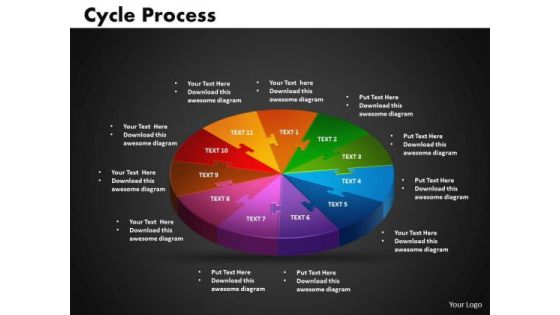
PowerPoint Design Cycle Process Editable Ppt Template
PowerPoint Design Cycle Process Editable PPT Template-Cycle Diagrams are a type of graphics that shows how items are related to one another in a repeating cycle. In a cycle diagram, you can explain the main events in the cycle, how they interact, and how the cycle repeats. -PowerPoint Design Cycle Process Editable PPT Template-Background, Business, Chart, Circle, Circular, Marketing, Management, Flow, Graph, Process, Round, Segmented, Sequence, Wheel, Diagram, Division, Continuity, Template, Web, Illustration
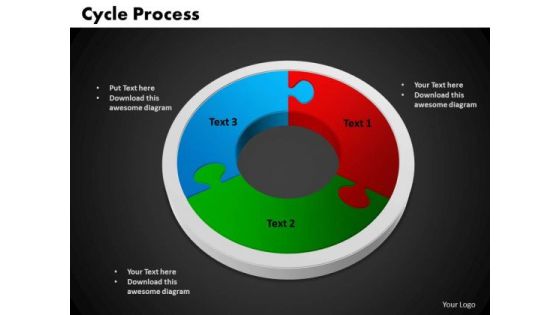
PowerPoint Design Cycle Process Marketing Ppt Slide
PowerPoint Design Cycle Process Marketing PPT Slide-Cycle Diagrams are a type of graphics that shows how items are related to one another in a repeating cycle. In a cycle diagram, you can explain the main events in the cycle, how they interact, and how the cycle repeats.-PowerPoint Design Cycle Process Marketing PPT Slide-Background, Business, Chart, Circle, Circular, Marketing, Management, Flow, Graph, Process, Round, Segmented, Sequence, Wheel, Diagram, Division, Continuity, Template, Web, Illustration

Comparison Chart For Value Stream Mapping Before And After Slide Ppt Example
This is a comparison chart for value stream mapping before and after slide ppt example. This is a two stage process. The stages in this process are pollen.
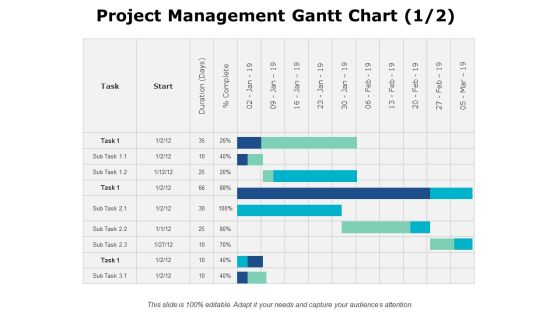
Project Management Gantt Chart Ppt PowerPoint Presentation Infographic Template Background Image
This is a project management gantt chart ppt powerpoint presentation infographic template background image. This is a fourteen stage process. The stages in this process are.

Return Of Investment Bar Chart For Business Powerpoint Slide Designs Download
This is a return of investment bar chart for business powerpoint slide designs download. This is a four stage process. The stages in this process are product.

Thank You For Watching Transformation Chart Ppt PowerPoint Presentation Summary Portrait
This is a thank you for watching transformation chart ppt powerpoint presentation summary portrait. This is a one stage process. The stages in this process are thank you.

Thank You Sample Ppt Organizational Chart Ppt Powerpoint Presentation Infographic Template Portfolio
This is a thank you sample ppt organizational chart ppt powerpoint presentation infographic template portfolio. This is a stage process. The stages in this process are thank you.

Billing Cycle Flow Chart Print And Post Bills Ppt Powerpoint Presentation Model Portfolio
This is a billing cycle flow chart print and post bills ppt powerpoint presentation model portfolio. This is a six stage process. The stages in this process are billing process, billing procedure, billing cycle.

Insurance Claim Workflow Chart Claim Scrutiny Pay Ppt Powerpoint Presentation Styles Portfolio
This is a insurance claim workflow chart claim scrutiny pay ppt powerpoint presentation styles portfolio. This is a four stage process. The stages in this process are insurance claim process, insurance claim steps, insurance claim procedure.

PowerPoint Templates Process Diagram Business Plan Slides
We present our powerpoint templates process diagram business plan Slides.Use our Circle Charts PowerPoint Templates because Our PowerPoint Templates and Slides will weave a web of your great ideas. They are gauranteed to attract even the most critical of your colleagues. Download and present our Business PowerPoint Templates because Our PowerPoint Templates and Slides will provide weight to your words. They will bring out the depth of your thought process. Present our Shapes PowerPoint Templates because Our PowerPoint Templates and Slides will let you Hit the target. Go the full distance with ease and elan. Download our Flow Charts PowerPoint Templates because You should Kick up a storm with our PowerPoint Templates and Slides. The heads of your listeners will swirl with your ideas. Present our Process and Charts PowerPoint Templates because Our PowerPoint Templates and Slides will let you Leave a lasting impression to your audiences. They possess an inherent longstanding recall factor.Use these PowerPoint slides for presentations relating to Chart, flow, life, flowchart, network, isolated, business concept, refresh, future, arrow, recycling, symbol, diagram, circle, wealth, ring, recycle, sick, graph, cycle, illustration, icon, connection, money, circle, arrow, diagram, motion, illness, goal graph, work, plan for success, job, gradient. The prominent colors used in the PowerPoint template are Red, Gray, White.

Bar Chart With Annual Performance Analysis Over Years Ppt PowerPoint Presentation Design Ideas
This is a bar chart with annual performance analysis over years ppt powerpoint presentation design ideas. This is a five stage process. The stages in this process are business, strategy, marketing, analysis, line graph.

Volume Open High Low Close Chart Ppt PowerPoint Presentation Model Ideas
This is a volume open high low close chart ppt powerpoint presentation model ideas. This is a five stage process. The stages in this process are finance, marketing, analysis, business, investment.

Volume Open High Low Close Chart Finance Ppt PowerPoint Presentation Model Graphic Images
This is a volume open high low close chart finance ppt powerpoint presentation model graphic images. This is a three stage process. The stages in this process are finance, analysis, business, investment, marketing.
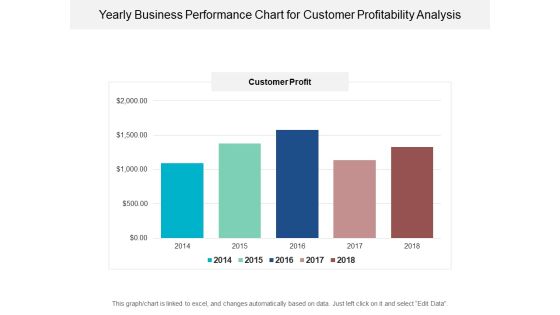
Yearly Business Performance Chart For Customer Profitability Analysis Ppt PowerPoint Presentation Ideas Picture
This is a yearly business performance chart for customer profitability analysis ppt powerpoint presentation ideas picture. This is a five stage process. The stages in this process are financial analysis, quantitative, statistical modelling.

Data Collection And Analysis Control Chart Ppt PowerPoint Presentation Summary Templates
This is a data collection and analysis control chart ppt powerpoint presentation summary templates. This is a one stage process. The stages in this process are business, marketing, point label, upper limit, lower limit.

Bar Chart Ppt PowerPoint Presentation Styles Graphics Tutorials Ppt PowerPoint Presentation Slides Gallery
This is a bar chart ppt powerpoint presentation styles graphics tutorials ppt powerpoint presentation slides gallery. This is a two stage process. The stages in this process are bar graph, growth, success, business, marketing.

Quantitative Bar Chart For Data Analysis Ppt PowerPoint Presentation Model Graphic Tips
This is a quantitative bar chart for data analysis ppt powerpoint presentation model graphic tips. This is a two stage process. The stages in this process are financial analysis, quantitative, statistical modelling.
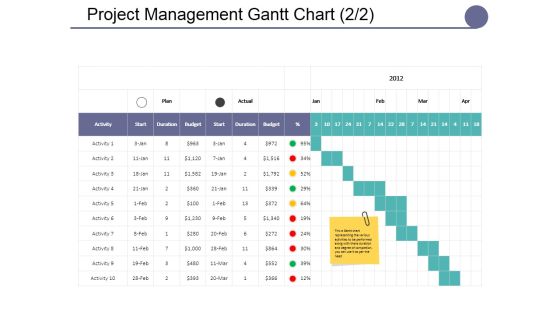
Project Management Gantt Chart Template Ppt PowerPoint Presentation Summary Master Slide
This is a project management gantt chart template ppt powerpoint presentation summary master slide. This is a seven stage process. The stages in this process are lists, table, data, management, marketing.

Volume High Low Close Chart Ppt PowerPoint Presentation Visual Aids Slides
This is a volume high low close chart ppt powerpoint presentation visual aids slides. This is a two stage process. The stages in this process are bar graph, marketing, strategy, finance, planning.

Volume Open High Low Close Chart Ppt PowerPoint Presentation Ideas Graphics Example
This is a volume open high low close chart ppt powerpoint presentation ideas graphics example. This is a five stage process. The stages in this process are business, bar graph, stock, cost, market.
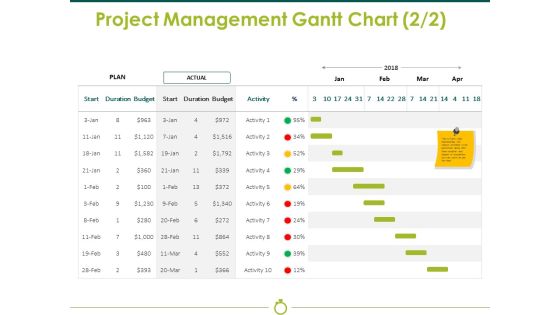
Project Management Gantt Chart Template 2 Ppt PowerPoint Presentation Show Styles
This is a project management gantt chart template 2 ppt powerpoint presentation show styles. This is a two stage process. The stages in this process are plan, actual, budget, duration, start.

Project Management Gantt Chart Template 1 Ppt PowerPoint Presentation Gallery Graphics Template
This is a project management gantt chart template 1 ppt powerpoint presentation gallery graphics template. This is a two stage process. The stages in this process are start, duration, complete, business, finance.

Data Analysis Chart For Funds Management Ppt PowerPoint Presentation Infographic Template Files
This is a data analysis chart for funds management ppt powerpoint presentation infographic template files. This is a five stage process. The stages in this process are financial analysis, quantitative, statistical modelling.
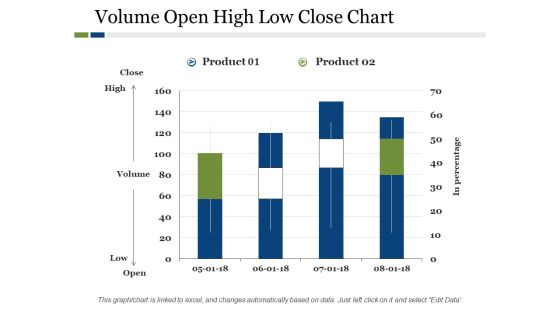
Volume Open High Low Close Chart Ppt PowerPoint Presentation Outline Mockup
This is a volume open high low close chart ppt powerpoint presentation outline mockup. This is a two stage process. The stages in this process are product, high, low, in percentage, volume.

Volume Open High Low Close Chart Ppt PowerPoint Presentation File Graphics Template
This is a volume open high low close chart ppt powerpoint presentation file graphics template. This is a two stage process. The stages in this process are close, high, volume, low, open, product.

Clustered Column Line Chart Finance Ppt PowerPoint Presentation Inspiration Design Templates
This is a clustered column line chart finance ppt powerpoint presentation inspiration design templates. This is a three stage process. The stages in this process are finance, analysis, business, investment, marketing.

break even chart showing contribution margin ppt powerpoint presentation professional templates
This is a break even chart showing contribution margin ppt powerpoint presentation professional templates. This is a two stage process. The stages in this process are break even point,break even analysis,break even level.
Volume High Low Close Chart Ppt PowerPoint Presentation Icon Graphics Pictures
This is a volume high low close chart ppt powerpoint presentation icon graphics pictures. This is a two stage process. The stages in this process are high, volume, low.
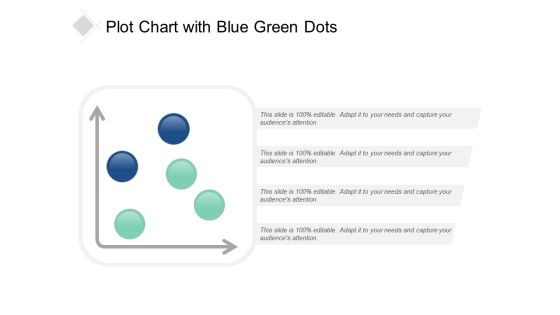
Plot Chart With Blue Green Dots Ppt Powerpoint Presentation Portfolio Graphic Tips
This is a plot chart with blue green dots ppt powerpoint presentation portfolio graphic tips. This is a four stage process. The stages in this process are scatter plot, probability plots, plot diagram.

Volume Open High Low Close Chart Ppt PowerPoint Presentation Professional Format
This is a volume open high low close chart ppt powerpoint presentation professional format. This is a five stage process. The stages in this process are business, marketing, strategy, finance, planning.

Volume Open High Low Close Chart Ppt PowerPoint Presentation Layouts Background Image
This is a volume open high low close chart ppt powerpoint presentation layouts background image. This is a two stage process. The stages in this process are close, high, volume, low, open.
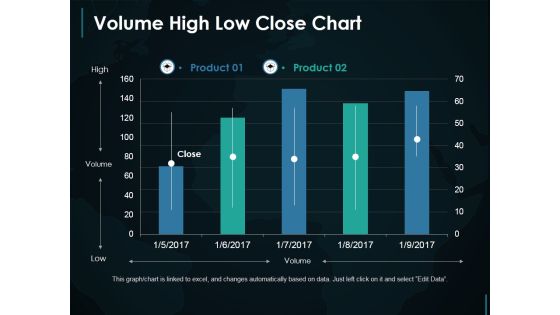
Volume High Low Close Chart Ppt PowerPoint Presentation Slides Example File
This is a volume high low close chart ppt powerpoint presentation slides example file. This is a two stage process. The stages in this process are high, volume, low.

Volume Open High Low Close Chart Ppt PowerPoint Presentation Pictures Tips
This is a volume open high low close chart ppt powerpoint presentation pictures tips. This is a three stage process. The stages in this process are high, volume, low, open, business.

Volume Open High Low Close Chart Finance Ppt PowerPoint Presentation Gallery Graphic Tips
This is a volume open high low close chart finance ppt powerpoint presentation gallery graphic tips. This is a two stage process. The stages in this process are finance, analysis, business, investment, marketing.

Volume Open High Low Close Chart Finance Ppt PowerPoint Presentation Professional Background Image
This is a volume open high low close chart finance ppt powerpoint presentation professional background image. This is a four stage process. The stages in this process are finance, analysis, business, investment, marketing.

break even sales and cost analysis chart ppt powerpoint presentation gallery master slide
This is a break even sales and cost analysis chart ppt powerpoint presentation gallery master slide. This is a three stage process. The stages in this process are break even point,break even analysis,break even level.

sales volume analysis chart with total sales and total cost ppt powerpoint presentation slide
This is a sales volume analysis chart with total sales and total cost ppt powerpoint presentation slide. This is a ten stage process. The stages in this process are break even point,break even analysis,break even level.

Data Chart For Distribution Of Vehicles By Origin And Type Ppt PowerPoint Presentation Infographics Topics
This is a data chart for distribution of vehicles by origin and type ppt powerpoint presentation infographics topics. This is a four stage process. The stages in this process are financial analysis, quantitative, statistical modelling.

Data Chart For Individual Income Analysis Ppt PowerPoint Presentation Layouts Visual Aids
This is a data chart for individual income analysis ppt powerpoint presentation layouts visual aids. This is a five stage process. The stages in this process are financial analysis, quantitative, statistical modelling.

Volume High Low Close Chart Ppt PowerPoint Presentation Ideas Background Images
This is a volume high low close chart ppt powerpoint presentation ideas background images. This is a five stage process. The stages in this process are volume, high, low, close.
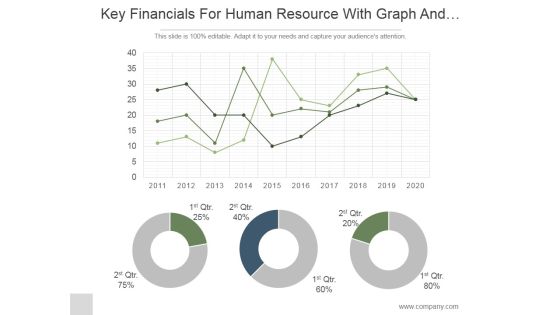
Key Financials For Human Resource With Graph And Pie Chart Ppt PowerPoint Presentation Ideas
This is a key financials for human resource with graph and pie chart ppt powerpoint presentation ideas. This is a three stage process. The stages in this process are business, strategy, marketing, analysis, donut, growth.

Business Workflow Chart With Purpose Statement Ppt PowerPoint Presentation Icon Backgrounds PDF
Presenting this set of slides with name business workflow chart with purpose statement ppt powerpoint presentation icon backgrounds pdf. This is a three stage process. The stages in this process are purpose statement, process input, process output. This is a completely editable PowerPoint presentation and is available for immediate download. Download now and impress your audience.
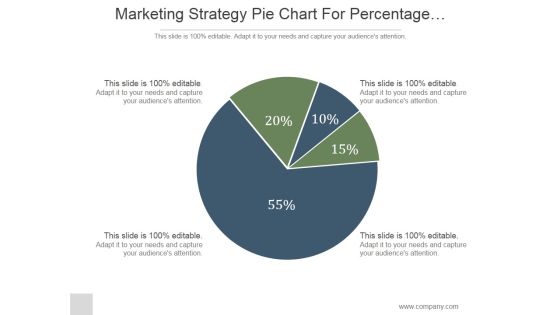
Marketing Strategy Pie Chart For Percentage Comparison Ppt PowerPoint Presentation Ideas
This is a marketing strategy pie chart for percentage comparison ppt powerpoint presentation ideas. This is a four stage process. The stages in this process are marketing, pie, strategy, finance, percentage.

Project Management Swim Lane Flow Chart Ppt PowerPoint Presentation Pictures Brochure
This is a project management swim lane flow chart ppt powerpoint presentation pictures brochure. This is a four stage process. The stages in this process are swim lane diagram, flowchart, management.

Linear Flow Chart Of Channel Marketing Flow For Consumer Diagram Powerpoint Slides Design Templates
This is a linear flow chart of channel marketing flow for consumer diagram powerpoint slides design templates. This is a five stage process. The stages in this process are manufacture, distributor, wholesaler, retailer, consumer.

Business Performance Evaluation And Feedback Flow Chart Ppt Powerpoint Presentation Model Example Topics
This is a business performance evaluation and feedback flow chart ppt powerpoint presentation model example topics. This is a three stage process. The stages in this process are performance management, structure conduct performance, performance review and analysis.

Data Collection And Analysis Flow Chart Ppt PowerPoint Presentation Outline Graphics
This is a data collection and analysis flow chart ppt powerpoint presentation outline graphics. This is a five stage process. The stages in this process are business, management, planning, strategy, marketing.

Business Investment Management Flow Chart Ppt PowerPoint Presentation Outline Example Topics
This is a business investment management flow chart ppt powerpoint presentation outline example topics. This is a three stage process. The stages in this process are investment, funding, private equity, venture capital.
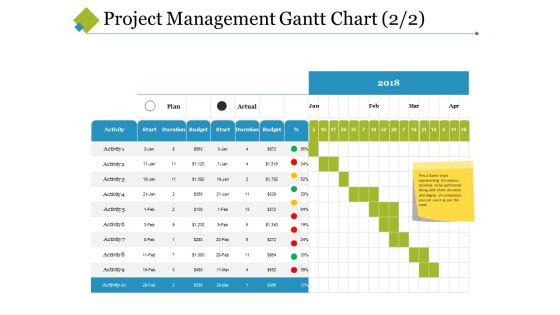
Project Management Gantt Chart Template 2 Ppt PowerPoint Presentation Model Slide Download
This is a project management gantt chart template 2 ppt powerpoint presentation model slide download. This is a nine stage process. The stages in this process are start, duration, budget, activity, plan.
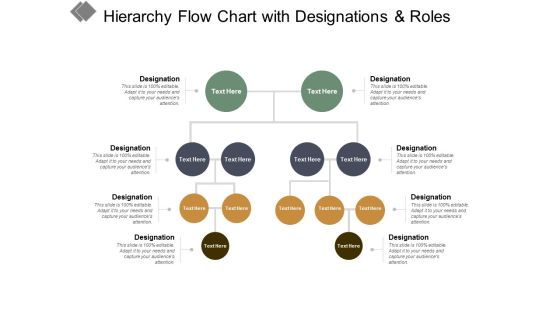
Hierarchy Flow Chart With Designations And Roles Ppt PowerPoint Presentation Styles Format Ideas
This is a hierarchy flow chart with designations and roles ppt powerpoint presentation styles format ideas. This is a four stage process. The stages in this process are business ownership, family business, owned business.

Data Collection And Analysis Control Chart Ppt PowerPoint Presentation Model Backgrounds
This is a data collection and analysis control chart ppt powerpoint presentation model backgrounds. This is a two stage process. The stages in this process are business, marketing, strategy, finance, analysis.

Succession Planning Modelling Chart Ppt PowerPoint Presentation Visual Aids Background Images
This is a succession planning modelling chart ppt powerpoint presentation visual aids background images. This is a three stage process. The stages in this process are compare, marketing, business, management, planning.

Project Management Gantt Chart Activity Ppt PowerPoint Presentation Model Background Designs
This is a project management gantt chart activity ppt powerpoint presentation model background designs. This is a three stage process. The stages in this process are marketing, business, management, compare.

Project Management Gantt Chart Template 2 Ppt PowerPoint Presentation Pictures Model
This is a project management gantt chart template 2 ppt powerpoint presentation pictures model. This is a four stage process. The stages in this process are table, business, strategy, compare, marketing.

Volume Open High Low Close Chart Ppt PowerPoint Presentation Model Inspiration
This is a volume open high low close chart ppt powerpoint presentation model inspiration. This is a three stage process. The stages in this process are business, management, strategy, marketing, sales.

Monthly Timeline Gantt Chart With Task Names Ppt PowerPoint Presentation File Ideas
This is a monthly timeline gantt chart with task names ppt powerpoint presentation file ideas. This is a twelve stage process. The stages in this process are agenda, schedule, timetable.
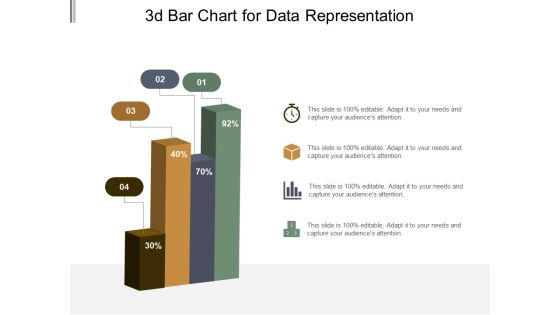
3D Bar Chart For Data Representation Ppt PowerPoint Presentation Model Graphic Tips
This is a 3d bar chart for data representation ppt powerpoint presentation model graphic tips. This is a four stage process. The stages in this process are art, colouring, paint brush.
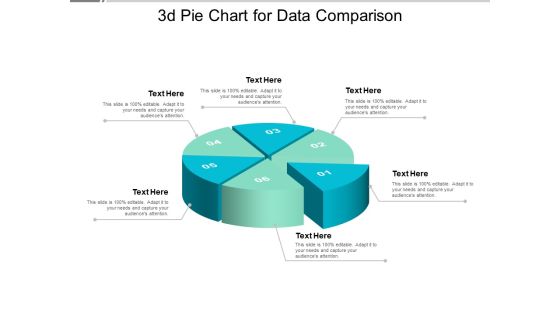
3D Pie Chart For Data Comparison Ppt PowerPoint Presentation Model Design Ideas
This is a 3d pie chart for data comparison ppt powerpoint presentation model design ideas. This is a six stage process. The stages in this process are art, colouring, paint brush.

Data Collection And Analysis Control Chart Ppt PowerPoint Presentation Example File
This is a data collection and analysis control chart ppt powerpoint presentation example file. This is a four stage process. The stages in this process are business, strategy, marketing, bar graph, growth strategy.

Monthly Task Management Gantt Chart Ppt Powerpoint Presentation Outline Example File
This is a monthly task management gantt chart ppt powerpoint presentation outline example file. This is a three stage process. The stages in this process are new product development, new product launch, introducing new product.
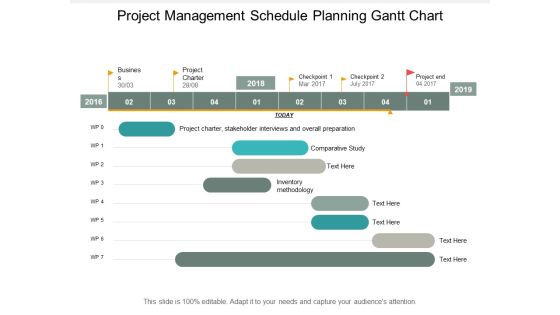
Project Management Schedule Planning Gantt Chart Ppt PowerPoint Presentation Outline Graphics Design
This is a project management schedule planning gantt chart ppt powerpoint presentation outline graphics design. This is a eight stage process. The stages in this process are work package timeline, work package roadmap, tasks package timelines.
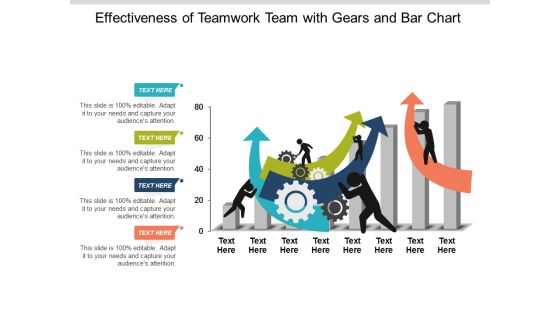
Effectiveness Of Teamwork Team With Gears And Bar Chart Ppt Powerpoint Presentation Ideas Information
This is a effectiveness of teamwork team with gears and bar chart ppt powerpoint presentation ideas information. This is a four stage process. The stages in this process are team performance, member performance, group performance.
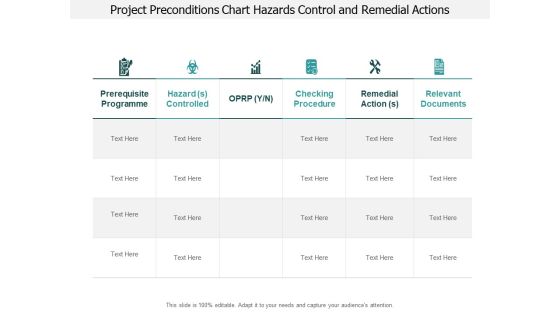
Project Preconditions Chart Hazards Control And Remedial Actions Ppt PowerPoint Presentation Pictures Show
This is a project preconditions chart hazards control and remedial actions ppt powerpoint presentation pictures show. This is a six stage process. The stages in this process are need, requirement, prerequisite.
Experimental Control Pie Chart With Dollar Symbol Ppt Powerpoint Presentation Infographics Background Images
This is a experimental control pie chart with dollar symbol ppt powerpoint presentation infographics background images. This is a four stage process. The stages in this process are exploratory, experimental, investigational.
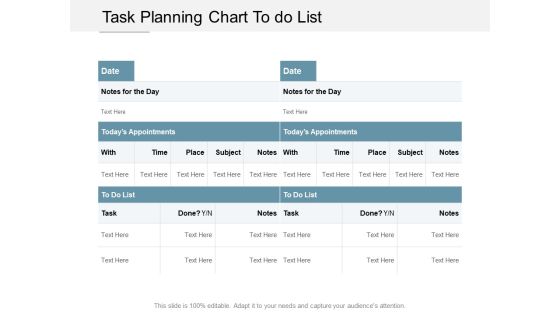
Task Planning Chart To Do List Ppt PowerPoint Presentation Infographics Picture Cpb
This is a task planning chart to do list ppt powerpoint presentation infographics picture cpb. This is a three stage process. The stages in this process are key activities, key highlights, list of activities.

Hierarchy Chart For Business Team Level Formation Ppt PowerPoint Presentation Files
This is a hierarchy chart for business team level formation ppt powerpoint presentation files. This is a six stage process. The stages in this process are business, strategy, marketing, management, communication.

Boys And Girls Participants Details Chart Ppt Powerpoint Presentation Portfolio Layout Ideas
This is a boys and girls participants details chart ppt powerpoint presentation portfolio layout ideas. This is a two stage process. The stages in this process are list of participants, list of members, list of contributors.
Gantt Chart For Task Planning And Management Ppt PowerPoint Presentation Icon Mockup
This is a gantt chart for task planning and management ppt powerpoint presentation icon mockup. This is a three stage process. The stages in this process are project management software, project management tools, project management techniques.
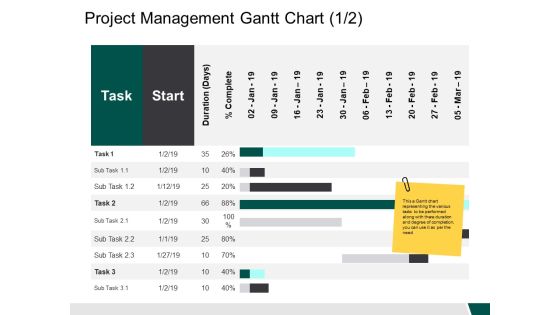
Project Management Gantt Chart Start Ppt PowerPoint Presentation Outline Example Introduction
This is a project management gantt chart start ppt powerpoint presentation outline example introduction. This is a two stage process. The stages in this process are business, management, strategy, analysis, marketing.

Clustered Bar Chart Yearly Operating Plan Ppt PowerPoint Presentation Styles Icon
This is a clustered bar chart yearly operating plan ppt powerpoint presentation styles icon. This is a four stage process. The stages in this process are business, management, strategy, analysis, marketing.
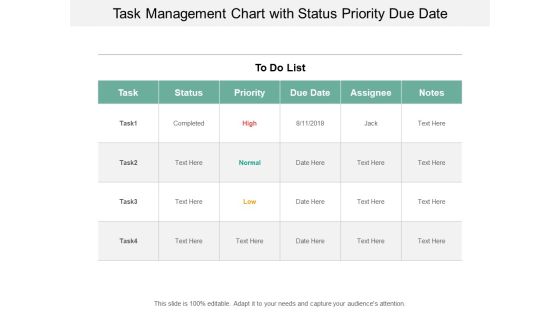
Task Management Chart With Status Priority Due Date Ppt PowerPoint Presentation Slides Format Ideas Cpb
This is a task management chart with status priority due date ppt powerpoint presentation slides format ideas cpb. This is a six stage process. The stages in this process are key activities, key highlights, list of activities.

5 Cylinders Column Chart For Market Growth Ppt PowerPoint Presentation Outline
This is a 5 cylinders column chart for market growth ppt powerpoint presentation outline. This is a five stage process. The stages in this process are business, marketing, icons, growth, finance.
Sample Ppt Organization Chart Icons Slide Business Ppt Powerpoint Presentation Layouts Layouts
This is a sample ppt organization chart icons slide business ppt powerpoint presentation layouts layouts. This is a six stage process. The stages in this process are business, management, planning, strategy, marketing.

Demonstration Icon Man Showing Bar Chart Ppt Powerpoint Presentation Styles Ideas
This is a demonstration icon man showing bar chart ppt powerpoint presentation styles ideas. This is a three stage process. The stages in this process are illustration, show, demo.
Product Features Comparison Chart With Icons Ppt Powerpoint Presentation Portfolio Diagrams
This is a product features comparison chart with icons ppt powerpoint presentation portfolio diagrams. This is a four stage process. The stages in this process are product differentiation, product comparison, brand differentiation.
Workload Management Chart With Employee Name And Activity Ppt PowerPoint Presentation Icon
This is a workload management chart with employee name and activity ppt powerpoint presentation icon. This is a eight stage process. The stages in this process are activity tracker, business, marketing.
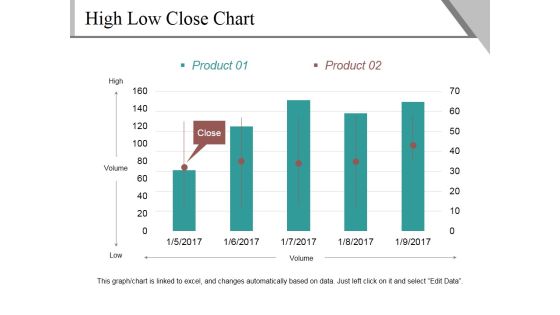
High Low Close Chart Template 2 Ppt PowerPoint Presentation Outline Show
This is a high low close chart template 2 ppt powerpoint presentation outline show. This is a five stage process. The stages in this process are high, volume, low, close, product.
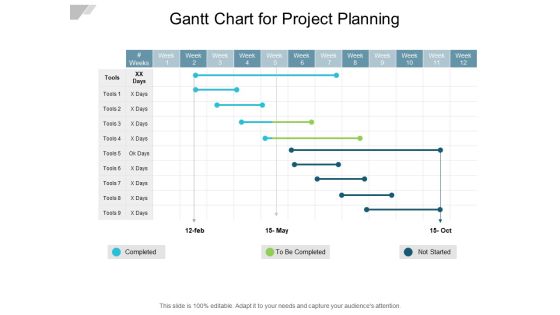
Gantt Chart For Project Planning Ppt PowerPoint Presentation Slides Design Ideas
This is a gantt chart for project planning ppt powerpoint presentation slides design ideas. This is a three stage process. The stages in this process are project management software, project management tools, project management techniques.
Risk Assessment Chart Report Vector Icon Ppt PowerPoint Presentation Ideas Deck
This is a risk assessment chart report vector icon ppt powerpoint presentation ideas deck. This is a four stage process. The stages in this process are risk management, governance icon, compliance icon.

Project Timeline For Strategic Planning Gantt Chart Ppt PowerPoint Presentation Professional Ideas
This is a project timeline for strategic planning gantt chart ppt powerpoint presentation professional ideas. This is a three stage process. The stages in this process are Business, Strategy, Marketing, Analysis, Table.

Visual Data Presentation With Bar Chart Ppt PowerPoint Presentation Portfolio Brochure
This is a visual data presentation with bar chart ppt powerpoint presentation portfolio brochure. This is a four stage process. The stages in this process are visual aids, communication, business.
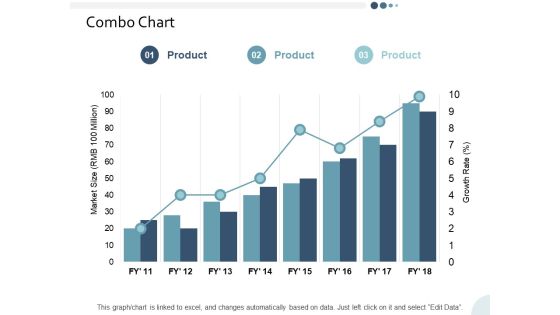
Combo Chart Yearly Operating Plan Ppt PowerPoint Presentation Infographic Template Skills
This is a combo chart yearly operating plan ppt powerpoint presentation infographic template skills. This is a three stage process. The stages in this process are business, management, strategy, analysis, marketing.

Pie Chart For Data Presentation Vector Ppt Powerpoint Presentation Summary Display
This is a pie chart for data presentation vector ppt powerpoint presentation summary display. This is a three stage process. The stages in this process are data visualization icon, data management icon.
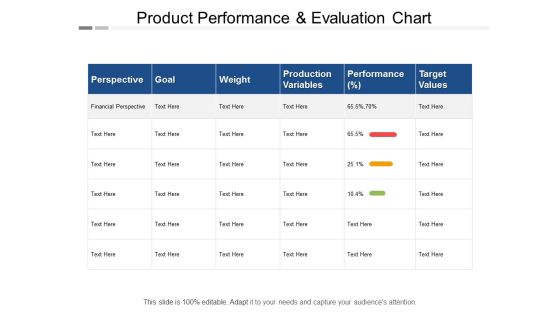
Product Performance And Evaluation Chart Ppt PowerPoint Presentation Pictures Slide Download
This is a product performance and evaluation chart ppt powerpoint presentation pictures slide download. This is a sex stage process. The stages in this process are production management, production performance, production improvement.
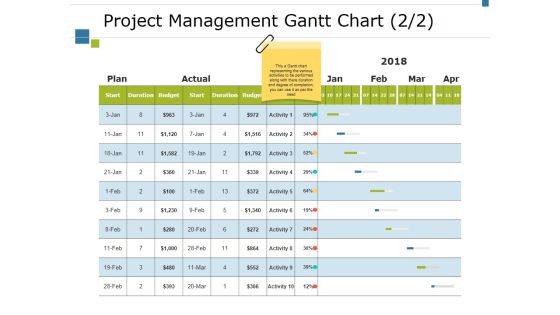
Project Management Gantt Chart Template 1 Ppt PowerPoint Presentation File Design Ideas
This is a project management gantt chart template 1 ppt powerpoint presentation file design ideas. This is a five stage process. The stages in this process are actual, plan, activity, budget, duration.
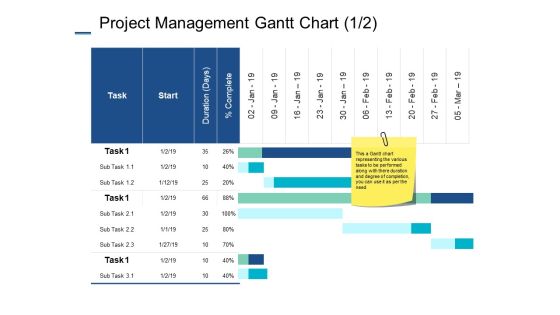
Project Management Gantt Chart Finance Ppt PowerPoint Presentation File Layout Ideas
This is a project management gantt chart finance ppt powerpoint presentation file layout ideas. This is a three stage process. The stages in this process are business, planning, strategy, marketing, management.
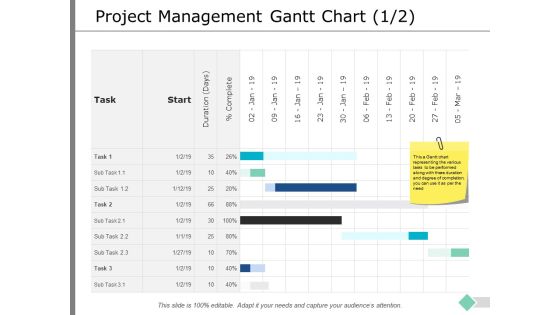
Project Management Gantt Chart Business Ppt PowerPoint Presentation Inspiration Layout Ideas
This is a project management gantt chart business ppt powerpoint presentation inspiration layout ideas. This is a nine stage process. The stages in this process are business, planning, strategy, marketing, management.
Pie Chart For Measuring Marketing Performance Ppt PowerPoint Presentation Icon Format
This is a pie chart for measuring marketing performance ppt powerpoint presentation icon format. This is a eight stage process. The stages in this process are b2b marketing strategy, b2b marketing plan, b2b marketing approach.

Arrow Puzzle 3d Column Chart With Icons Ppt Powerpoint Presentation Icon Deck
This is a arrow puzzle 3d column chart with icons ppt powerpoint presentation icon deck. This is a five stage process. The stages in this process are strategy, problem solution, arrow puzzle.
Percentage Value Comparison Pie Chart Icon Ppt PowerPoint Presentation Model Clipart Images
This is a percentage value comparison pie chart icon ppt powerpoint presentation model clipart images. This is a three stage process. The stages in this process are percentage icon, dividend icon, portion icon.

Project Management Gantt Chart Template 2 Ppt PowerPoint Presentation Pictures Outfit
This is a project management gantt chart template 2 ppt powerpoint presentation pictures outfit. This is a three stage process. The stages in this process are start, duration, task, complete, sub task.
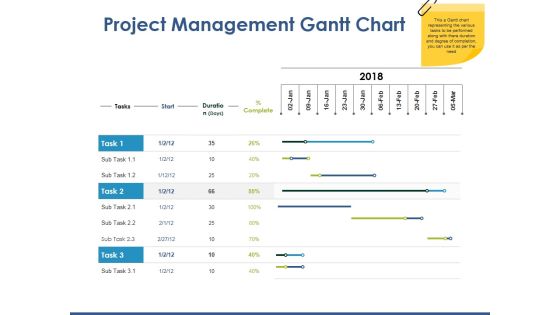
Project Management Gantt Chart Template 1 Ppt PowerPoint Presentation Professional Example File
This is a project management gantt chart template 1 ppt powerpoint presentation professional example file. This is a three stage process. The stages in this process are compare, business, strategy, marketing, table.
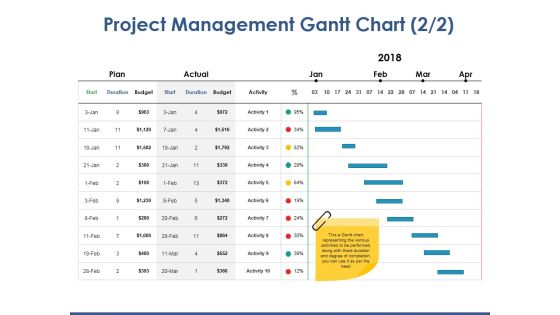
Project Management Gantt Chart Template 2 Ppt PowerPoint Presentation Inspiration Gallery
This is a project management gantt chart template 2 ppt powerpoint presentation inspiration gallery. This is a four stage process. The stages in this process are compare, table, business, strategy, marketing.

Unit Economic Profitability Cost Volume Analysis Chart Ppt PowerPoint Presentation Styles Graphics Design
This is a unit economic profitability cost volume analysis chart ppt powerpoint presentation styles graphics design. This is a five stage process. The stages in this process are business unit profitability, profitable organization, corporate unit profitability.

Employee Time Management Evaluation Chart Ppt PowerPoint Presentation File Graphic Images
This is a employee time management evaluation chart ppt powerpoint presentation file graphic images. This is a two stage process. The stages in this process are compare, business, management, marketing.

Project Management Gantt Chart Template 1 Ppt PowerPoint Presentation Professional Skills
This is a project management gantt chart template 1 ppt powerpoint presentation professional skills. This is a three stage process. The stages in this process are compare, business, marketing, table, strategy.
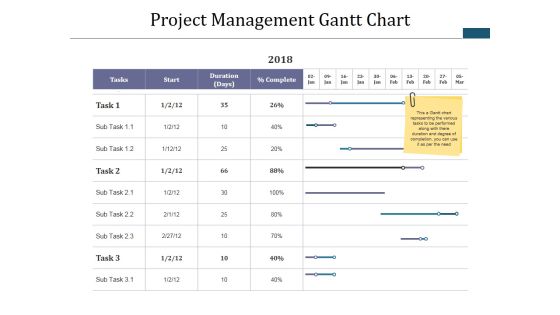
Project Management Gantt Chart Template 1 Ppt PowerPoint Presentation Infographics Tips
This is a project management gantt chart template 1 ppt powerpoint presentation infographics tips. This is a four stage process. The stages in this process are table, business, marketing, strategy, compare.

Contract Administration And Management Flow Chart Ppt Powerpoint Presentation File Backgrounds
This is a contract administration and management flow chart ppt powerpoint presentation file backgrounds. This is a four stage process. The stages in this process are contract structure, contract framework, contract model.

Cpm Chart For Project Management Ppt PowerPoint Presentation Portfolio Background Image
This is a cpm chart for project management ppt powerpoint presentation portfolio background image. This is a eleven stage process. The stages in this process are critical path method, critical path analysis, cpm.
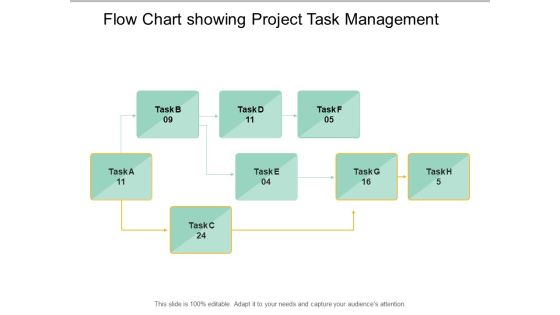
Flow Chart Showing Project Task Management Ppt PowerPoint Presentation Styles Smartart
This is a flow chart showing project task management ppt powerpoint presentation styles smartart. This is a eight stage process. The stages in this process are critical path method, critical path analysis, cpm.
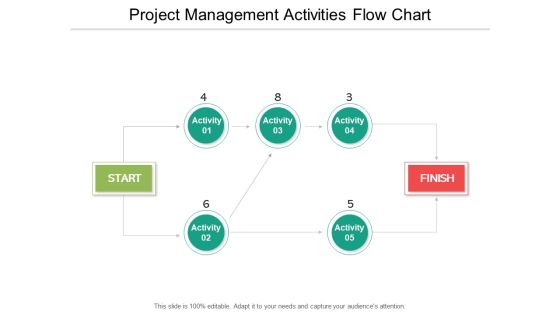
Project Management Activities Flow Chart Ppt PowerPoint Presentation File Example File
This is a project management activities flow chart ppt powerpoint presentation file example file. This is a seven stage process. The stages in this process are critical path method, critical path analysis, cpm.

Competitive Analysis Template 6 Scatter Chart Ppt PowerPoint Presentation Icon Example Topics
This is a competitive analysis template 6 scatter chart ppt powerpoint presentation icon example topics. This is a eight stage process. The stages in this process are users interface, data import, example, pricing, support, update, tutorials, easy to use.
Volume Open High Low Close Chart Ppt PowerPoint Presentation Icon Design Inspiration
This is a volume open high low close chart ppt powerpoint presentation icon design inspiration. This is a three stage process. The stages in this process are close, high, low, volume, open.

3D Bar Chart To Display Data Ppt PowerPoint Presentation Icon Design Inspiration
This is a 3d bar chart to display data ppt powerpoint presentation icon design inspiration. This is a four stage process. The stages in this process are art, colouring, paint brush.

3D Chart For Graphical Display Of Data Ppt PowerPoint Presentation Styles Icon
This is a 3d chart for graphical display of data ppt powerpoint presentation styles icon. This is a four stage process. The stages in this process are art, colouring, paint brush.

Project Management Gantt Chart Template 1 Ppt PowerPoint Presentation Show Professional
This is a project management gantt chart template 1 ppt powerpoint presentation show professional. This is a nine stage process. The stages in this process are table, business, strategy, compare, marketing.
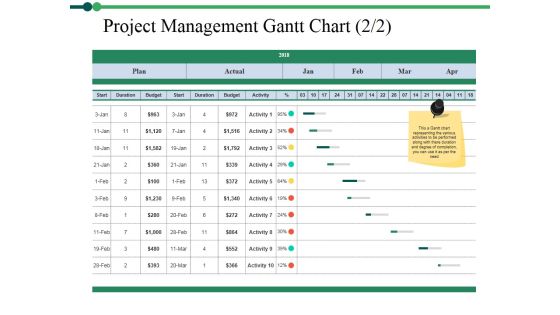
Project Management Gantt Chart Template 2 Ppt PowerPoint Presentation Layouts Smartart
This is a project management gantt chart template 2 ppt powerpoint presentation layouts smartart. This is a four stage process. The stages in this process are compare, business, marketing, table, strategy.
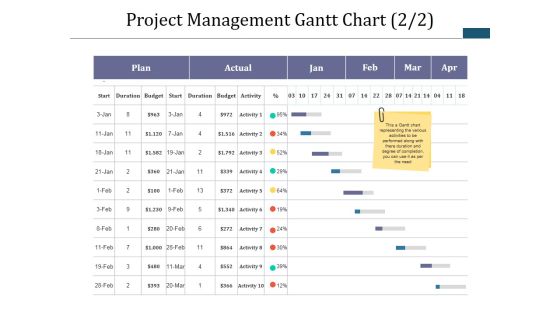
Project Management Gantt Chart Template 2 Ppt PowerPoint Presentation Infographic Template Master Slide
This is a project management gantt chart template 2 ppt powerpoint presentation infographic template master slide. This is a five stage process. The stages in this process are table, business, marketing, strategy, compare.
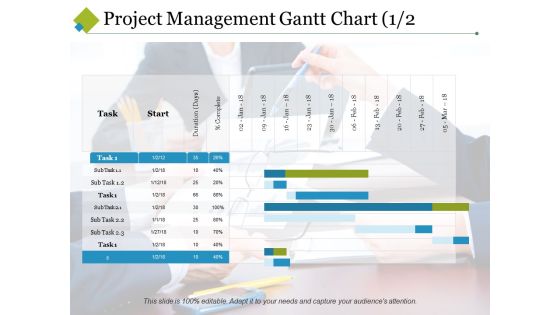
Project Management Gantt Chart Template 1 Ppt PowerPoint Presentation Visual Aids Summary
This is a project management gantt chart template 1 ppt powerpoint presentation visual aids summary. This is a two stage process. The stages in this process are start, task, sub task, duration, complete.

Bar Chart For Business Performance Evaluation Ppt PowerPoint Presentation Infographics Professional
This is a bar chart for business performance evaluation ppt powerpoint presentation infographics professional. This is a five stage process. The stages in this process are metrics icon, kpis icon, statistics icon.

Chart With Magnifying Glass For Business Research Ppt PowerPoint Presentation Inspiration Shapes
This is a chart with magnifying glass for business research ppt powerpoint presentation inspiration shapes. This is a two stage process. The stages in this process are metrics icon, kpis icon, statistics icon.

Computer Screen With Pie Chart For Data Analysis Ppt PowerPoint Presentation Show Picture
This is a computer screen with pie chart for data analysis ppt powerpoint presentation show picture. This is a six stage process. The stages in this process are computer icon, desktop icon, laptop screen icon.

Bulb Or Idea Chart Ppt PowerPoint Presentation Infographic Template Design Ideas
This is a bulb or idea chart ppt powerpoint presentation infographic template design ideas. This is a one stages process. The stages in this process are bulb or idea, technology, strategy, management, planning.

Sample PPT Organizational Chart Ppt PowerPoint Presentation Complete Deck With Slides
This is a sample ppt organizational chart ppt powerpoint presentation complete deck with slides. This is a one stage process. The stages in this process are business, management, planning, strategy, marketing.

Column Chart Employee Value Proposition Ppt PowerPoint Presentation Slides Graphics Design
This is a column chart employee value proposition ppt powerpoint presentation slides graphics design. This is a two stage process. The stages in this process are business, management, strategy, analysis, marketing.

Donut Pie Chart Sample Budget Ppt Ppt PowerPoint Presentation Layouts Styles
This is a donut pie chart sample budget ppt ppt powerpoint presentation layouts styles. This is a four stage process. The stages in this process are business, management, strategy, analysis, marketing.
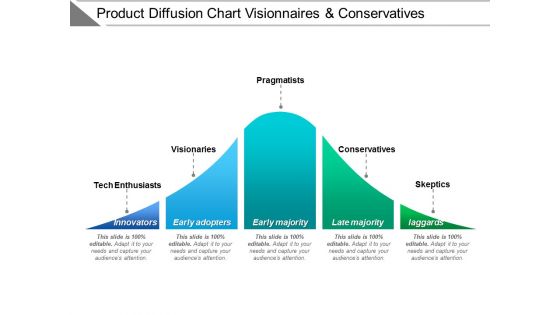
Product Diffusion Chart Visionaries And Conservatives Ppt PowerPoint Presentation Model Clipart
This is a product diffusion chart visionaries and conservatives ppt powerpoint presentation model clipart. This is a five stage process. The stages in this process are adoption curve, crossing the chasm, hype cycle.

Pie Chart With Dollar Symbol Ppt PowerPoint Presentation Infographic Template Graphics Design
This is a pie chart with dollar symbol ppt powerpoint presentation infographic template graphics design. This is a two stage process. The stages in this process are sectioned circle, segmented circle, partitioned circle.

Data Comparison And Analysis Chart Ppt Powerpoint Presentation File Background Images
This is a data comparison and analysis chart ppt powerpoint presentation file background images. This is a four stage process. The stages in this process are data presentation, content presentation, information presentation.
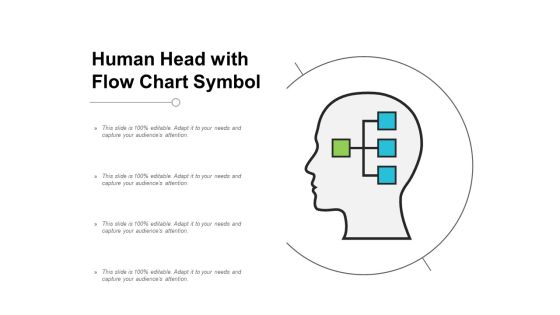
Human Head With Flow Chart Symbol Ppt Powerpoint Presentation Ideas Design Templates
This is a human head with flow chart symbol ppt powerpoint presentation ideas design templates. This is a one stage process. The stages in this process are brainstorming, thinking man, innovative man.

Customer Service Benchmarking Chart Ppt PowerPoint Presentation Infographic Template Graphics Tutorials
This is a customer service benchmarking chart ppt powerpoint presentation infographic template graphics tutorials. This is a eight stage process. The stages in this process are category, business, marketing, management.

Competitive Analysis Template 7 Bubble Chart Ppt PowerPoint Presentation Summary Guidelines
This is a competitive analysis template 7 bubble chart ppt powerpoint presentation summary guidelines. This is a six stage process. The stages in this process are business, bubble, management, strategy, marketing.
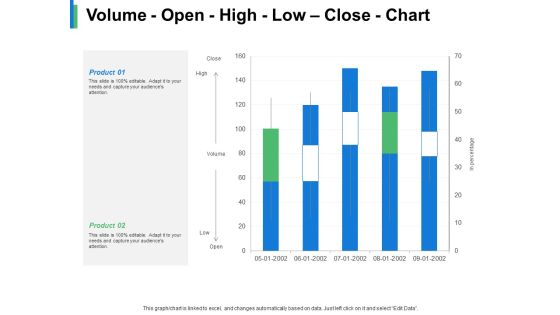
Volume Open High Low Close Chart Product Ppt PowerPoint Presentation Gallery Example
This is a volume open high low close chart product ppt powerpoint presentation gallery example. This is a two stage process. The stages in this process are business, management, strategy, marketing, sales.

Competitive Analysis Template 8 Matrix Chart Ppt PowerPoint Presentation Show Outfit
This is a competitive analysis template 8 matrix chart ppt powerpoint presentation show outfit. This is a six stage process. The stages in this process are product quality, product fidelity, after sales service, customer service, price, shipping speed.

 Home
Home