Problem Icon

Mba Models And Frameworks Family Tree Marketing Diagram
Your Grasp Of Economics Is Well Known. Help Your Audience Comprehend Issues With Our MBA Models And Frameworks Family Tree Marketing Diagram Powerpoint Templates. Strike A Bargain With Our MBA Models And Frameworks Family Tree Marketing Diagram Powerpoint Templates. Your Thoughts Will Get A Winning Deal.
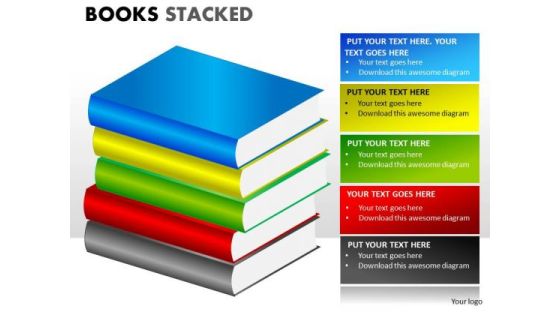
Consulting Diagram Books Stacked Mba Models And Frameworks
Your Grasp Of Economics Is Well Known. Help Your Audience Comprehend Issues With Our Consulting Diagram Books Stacked Mba Models And Frameworks Powerpoint Templates. Strike A Bargain With Our Consulting Diagram Books Stacked Mba Models And Frameworks Powerpoint Templates. Your Thoughts Will Get A Winning Deal.

Consulting Diagram Labyrinth Circular Arrow Business Finance Strategy Development
Our Consulting Diagram Labyrinth Circular arrow Business Finance Strategy Development Powerpoint Templates are creatively constructed and eye catching. Focus attention on the key issues of your presentation. Use our Consulting Diagram Labyrinth Circular arrow Business Finance Strategy Development Powerpoint Templates and nail the day. Lead your team show them the way.

Business Framework Model Post It Notes 5 Stages Marketing Diagram
Our Business Framework Model POST IT NOTES 5 STAGES Marketing Diagram Powerpoint Templates are creatively constructed and eye catching. Focus attention on the key issues of your presentation. Use our Business Framework Model POST IT NOTES 5 STAGES Marketing Diagram Powerpoint Templates and nail the day. Lead your team show them the way.

Enhancing Companys Project How Lack Of Communication Affecting Overall Project Topics PDF
The parent company and the subsidiaries are facing coordinating issues which are affecting their overall performance. Lack of coordination creating issues in launching product due to no regular follow up. Delivery of the product is delayed due to lack of coordination. Deliver and pitch your topic in the best possible manner with this Enhancing Companys Project How Lack Of Communication Affecting Overall Project Topics PDF. Use them to share invaluable insights on Communication Coordination Issue, Slow Response Changes, Increase Project Cost and impress your audience. This template can be altered and modified as per your expectations. So, grab it now.

Project Team Engagement Tasks Ensuring Target Group Engagement Designs PDF
The parent company and the subsidiaries are facing coordinating issues which are affecting their overall performance. Lack of coordination creating issues in launching product due to no regular follow up. Delivery of the product is delayed due to lack of coordination. Deliver an awe inspiring pitch with this creative Project Team Engagement Tasks Ensuring Target Group Engagement Designs PDF bundle. Topics like Increase In Project, Reasons For Project, Coordination Issue can be discussed with this completely editable template. It is available for immediate download depending on the needs and requirements of the user.

Customer Service KPI Dashboard For Technical Support Ppt Model Vector PDF
This slide covers customer service KPI dashboard for technical support. It involves details such as total number of issues arise daily, overall average response time, number of issues by channel and top performing technical engineers. Pitch your topic with ease and precision using this Customer Service KPI Dashboard For Technical Support Ppt Model Vector PDF. This layout presents information on Overall Average, Response Time, Total Number, Issues Arise Daily. It is also available for immediate download and adjustment. So, changes can be made in the color, design, graphics or any other component to create a unique layout.
Production Department Open And Closed Error Tracking Report Sample PDF
This slide showcases the tracking report for opened and closed issues concerning the manufacturing department. It also includes the priority level, open date, close date, current status, closed by, etc. Pitch your topic with ease and precision using this Production Department Open And Closed Error Tracking Report Sample PDF. This layout presents information on Open Issue Tracker, Issues Closed, Error Tracking Report. It is also available for immediate download and adjustment. So, changes can be made in the color, design, graphics or any other component to create a unique layout.

Website Medical Checkup Metrics Dashboard Introduction PDF
The following slide showcases a dashboard to identify key issues and boost website performance. It includes key elements like crawled URLs, health score, issues, found links, URL by errors and top issues. Showcasing this set of slides titled Website Medical Checkup Metrics Dashboard Introduction PDF. The topics addressed in these templates are Website Medical Checkup, Metrics Dashboard. All the content presented in this PPT design is completely editable. Download it and make adjustments in color, background, font etc. as per your unique business setting.
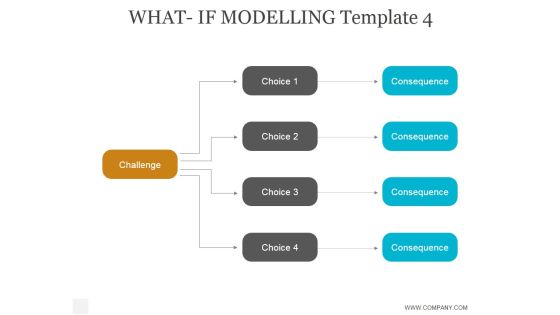
What If Modelling Template 4 Ppt PowerPoint Presentation Designs
This is a what if modelling template 4 ppt powerpoint presentation designs. This is a four stage process. The stages in this process are consequence, challenge.

Barriers Related To Digitalization In Banking Develop Organizational Productivity By Enhancing Business Process Topics PDF
The slide provides the major barriers for digitalization in banking sector. Key barriers include cultural challenge, technical challenges, lack of digital talent, lack of innovations. Deliver and pitch your topic in the best possible manner with this barriers related to digitalization in banking develop organizational productivity by enhancing business process topics pdf. Use them to share invaluable insights on technical challenges, strategies, innovations, digital talent, digital goals and impress your audience. This template can be altered and modified as per your expectations. So, grab it now.
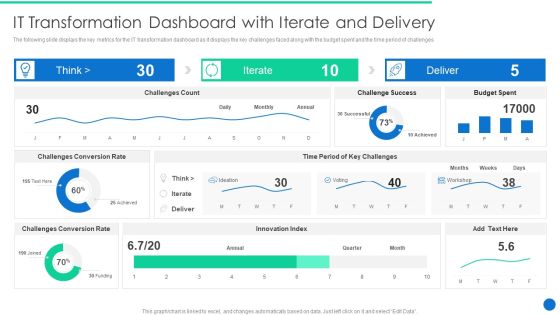
ERP Digital Transformation Journey It Transformation Dashboard With Iterate And Delivery Clipart PDF
The following slide displays the key metrics for the IT transformation dashboard as it displays the key challenges faced along with the budget spent and the time period of challenges. Deliver and pitch your topic in the best possible manner with this ERP Digital Transformation Journey It Transformation Dashboard With Iterate And Delivery Clipart PDF. Use them to share invaluable insights on Challenges Conversion, Budget Spent, Innovation Index and impress your audience. This template can be altered and modified as per your expectations. So, grab it now.
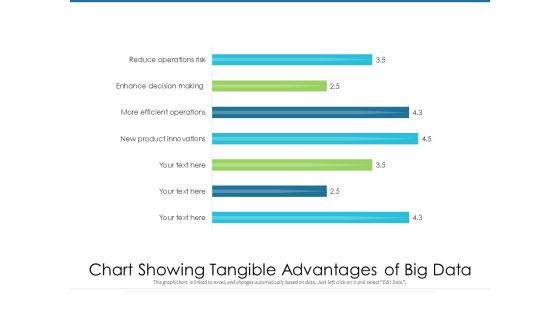
Chart Showing Tangible Advantages Of Big Data Ppt PowerPoint Presentation Infographics Clipart PDF
Pitch your topic with ease and precision using this chart showing tangible advantages of big data ppt powerpoint presentation infographics clipart pdf. This layout presents information on new product innovations, more efficient operations, enhance decision making, reduce operations risk. It is also available for immediate download and adjustment. So, changes can be made in the color, design, graphics or any other component to create a unique layout.
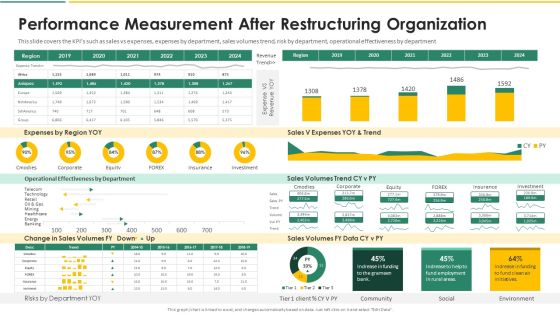
Organization Chart And Corporate Model Transformation Performance Measurement After Slides PDF
This slide covers the KPIs such as sales vs expenses, expenses by department, sales volumes trend, risk by department, operational effectiveness by department. Deliver and pitch your topic in the best possible manner with this organization chart and corporate model transformation performance measurement after slides pdf. Use them to share invaluable insights on operational effectiveness by department, expenses by region yoy, sales volumes trend and impress your audience. This template can be altered and modified as per your expectations. So, grab it now.
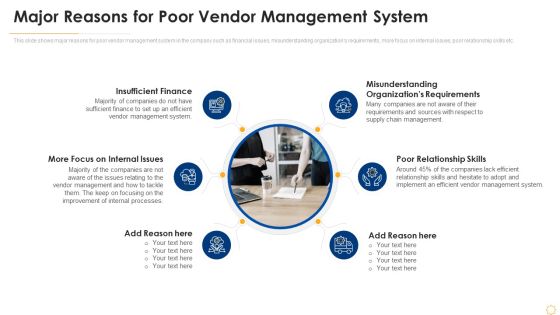
Successful Vendor Management Approaches To Boost Procurement Efficiency Major Reasons For Poor Vendor Diagrams PDF
This slide shows major reasons for poor vendor management system in the company such as financial issues, misunderstanding organizations requirements, more focus on internal issues, poor relationship skills etc. This is a successful vendor management approaches to boost procurement efficiency major reasons for poor vendor diagrams pdf template with various stages. Focus and dispense information on six stages using this creative set, that comes with editable features. It contains large content boxes to add your information on topics like insufficient finance, poor relationship skills, misunderstanding organizations requirements, more focus on internal issues. You can also showcase facts, figures, and other relevant content using this PPT layout. Grab it now.

Business Process Management Landscape Diagram Demonstration PDF
This slide represents the model showing the management of business processes to help in avoiding the major challenges faced by the business. It includes details related to corporate strategy, leadership and support processes and offering of solutions. Pitch your topic with ease and precision using this Business Process Management Landscape Diagram Demonstration PDF. This layout presents information on Strategic Business Plan, Corporate Management, Cooperation Management. It is also available for immediate download and adjustment. So, changes can be made in the color, design, graphics or any other component to create a unique layout.

Business Operation Scalability Prioritization Structure Diagrams PDF
The following slide highlights the business operation scalability evaluation to expand customer base and product quality. It constitutes of elements such as opportunities, challenges, innovations, solutions etc. Persuade your audience using this Business Operation Scalability Prioritization Structure Diagrams PDF. This PPT design covers four stages, thus making it a great tool to use. It also caters to a variety of topics including Opportunities, Innovations, Execution Engine. Download this PPT design now to present a convincing pitch that not only emphasizes the topic but also showcases your presentation skills.

Cloud Computing Performance Gap Assessment Diagrams PDF
This slide depicts the performance gap analysis of the cloud computing environment. The purpose of this slide is to demonstrate the various cloud computing KPIs, their current results, target outcomes and the gap. It also covers the challenges behind the degraded performance and solutions to overcome them. Showcasing this set of slides titled Cloud Computing Performance Gap Assessment Diagrams PDF. The topics addressed in these templates are Performance, Capacity, Target. All the content presented in this PPT design is completely editable. Download it and make adjustments in color, background, font etc. as per your unique business setting.

Business Relationship Management Strategy Diagram Presentation Deck
This is a business relationship management strategy diagram presentation deck. This is a ten stage process. The stages in this process are portfolio management, service management, enterprise architecture, change management, business organization, cloud computing, new technologies, risk management, handling the politics, business it strategy.
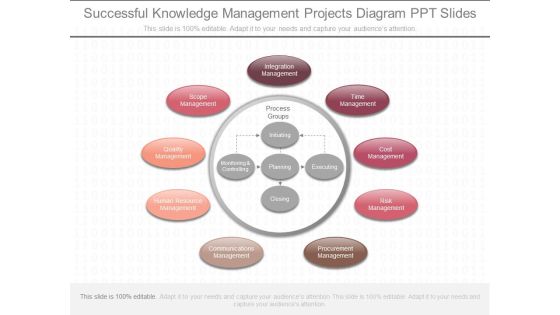
Successful Knowledge Management Projects Diagram Ppt Slides
This is a successful knowledge management projects diagram ppt slides. This is a nine stage process. The stages in this process are integration management, time management, cost management, risk management, procurement management, communications management, human resource management, quality management, scope management, process groups, initiating, monitoring and controlling, planning, closing, executing.

Corporate Finance Management Diagram Powerpoint Presentation
This is a corporate finance management diagram powerpoint presentation. This is a eight stage process. The stages in this process are corporate finance management system, general ledger, payroll, accounts payable, financial analytics, accounts receivable, asset lifecycle management, financial planning, governance risk compliance.
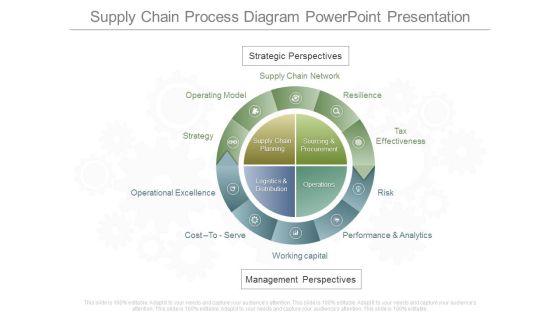
Supply Chain Process Diagram Powerpoint Presentation
This is a supply chain process diagram powerpoint presentation. This is a ten stage process. The stages in this process are strategic perspectives, supply chain network, operating model, resilience, tax effectiveness, operational excellence, cost to serve, working capital, performance and analytics, risk, supply chain planning, sourcing And procurement, logistics and distribution, operations, management perspectives.\n\n\n\n\n\n\n\n\n\n\n\n\n\n
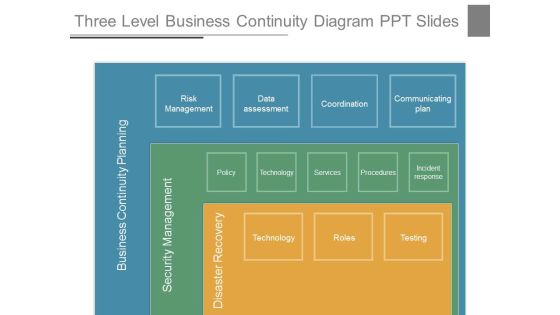
Three Level Business Continuity Diagram Ppt Slides
This is a three level business continuity diagram ppt slides. This is a three stage process. The stages in this process are business continuity planning, security management, disaster recovery, technology, roles, testing, risk management, data assessment, coordination, communicating plan, policy, technology, services, procedures, incident response.
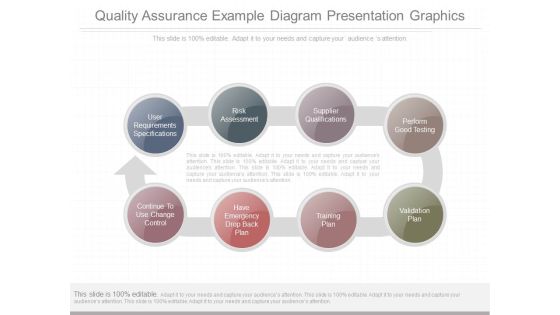
Quality Assurance Example Diagram Presentation Graphics
This is a quality assurance example diagram presentation graphics. This is a eight stage process. The stages in this process are user requirements specifications, risk assessment, supplier qualifications, perform good testing, continue to use change control, have emergency drop back plan, training plan, validation plan.

International Trade Consulting Diagram Ppt Sample
This is a international trade consulting diagram ppt sample. This is a eight stage process. The stages in this process are cash management solutions, trade finance solutions, liquidity management solutions, investment banking solutions, debt capital market offering, vendor and channel financing, working capital finance, treasury risk management services.

International Financial Framework Diagram Presentation Slides
This is a international financial framework diagram presentation slides. This is a five stage process. The stages in this process are financial regulatory reform, address sustainability, coordination, financial stability board, regulation, euro area banking union, basel, impact investment, layman and senior managers, supervision, european supervisory authorities, european systemic risk board, financial literacy, create positive impacts beyond finical return.

Financial Investment Process Diagram Ppt Design
This is a financial investment process diagram ppt design. This is a eight stage process. The stages in this process are identify investment goal, determine risk tolerance and time horizon, written investment policy statement, accounts established, investments allocated, quarterly investment reports, monitor portfolio and provide tax planning data, annual portfolio review and re optimize portfolio.
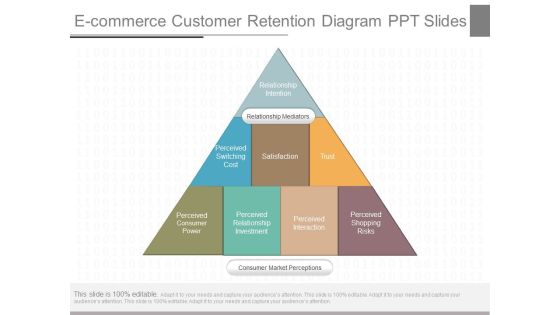
E Commerce Customer Retention Diagram Ppt Slides
This is a e commerce customer retention diagram ppt slides. This is a seven stage process. The stages in this process are relationship intention, relationship mediators, perceived switching cost satisfaction, trust, perceived consumer power, perceived relationship investment, perceived interaction, perceived shopping risks, consumer market perceptions.
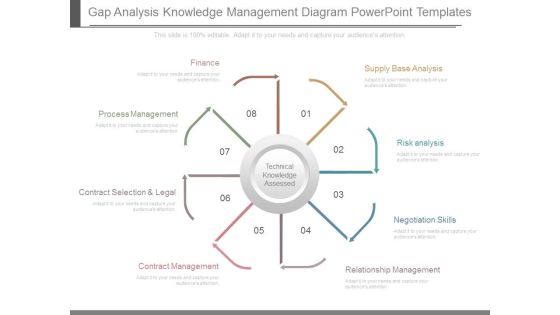
Gap Analysis Knowledge Management Diagram Powerpoint Templates
This is a gap analysis knowledge management diagram powerpoint templates. This is a eight stage process. The stages in this process are technical knowledge assessed, finance, process management, contract selection and legal, contract management, relationship management, negotiation skills, risk analysis, supply base analysis.

Procurement Intelligence Services Sample Diagram Ppt Slides
This is a procurement intelligence services sample diagram ppt slides. This is a five stage process. The stages in this process are cost saving, stay updated on the supply markets, anticipate potential risks, gain accurate and timely category insight, organize and manage category spend, develop mitigation strategies.

Enterprise Integration Solution Diagram Powerpoint Guide
This is a enterprise integration solution diagram powerpoint guide. This is a six stage process. The stages in this process are policy management, log management, vulnerability assessment, web application scanning, file integrity monitoring, vulnerability management, discovery, protection, monitoring, reporting, security, risk and compliance.

Optimal Portfolio Selection Diagram Powerpoint Slides Templates
This is a optimal portfolio selection diagram powerpoint slides templates. This is a eight stage process. The stages in this process are quantitative research, optimal portfolio, fundamental research, portfolio construction, security analysis and selection, portfolio strategy, optimizing risk return, portfolio design, investment research.
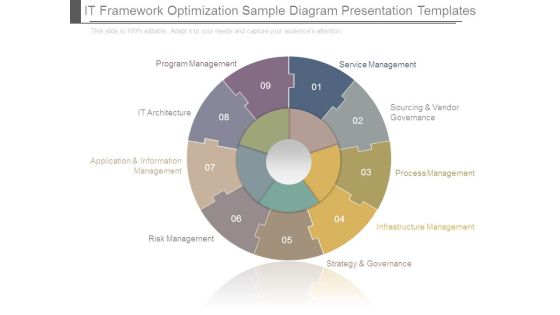
It Framework Optimization Sample Diagram Presentation Templates
This is a It Framework Optimization Sample Diagram Presentation Templates. This is a nine stage process. The stages in this process are program management, it architecture, application and information management, risk management, service management, sourcing and vendor governance, process management, infrastructure management, strategy and governance.

Business Diagram 3d Globe With Magnifying Glass On Europe Africa Presentation Template
Concept of global environment can be explained with this diagram of globe with magnifying glass. Magnifying glass represents a deep down research approach. Get professional using this diagram to explain global issues minutely in any business or global presentations.

Business Diagram 3d Globe With Magnifying Glass On South America Presentation Template
Concept of global environment can be explained with this diagram of globe with magnifying glass. Magnifying glass represents a deep down research approach. Get professional using this diagram to explain global issues minutely in any business or global presentations.

Business Diagram 3d Small Area Specific Globe With World Map Presentation Template
Concept of global environment can be explained with this diagram of small globes with world map. Get professional using this diagram to explain global issues minutely in any business or global presentations.

Business Diagram 3d World Globe Magnifying Glass On Africa Presentation Template
Concept of global environment can be explained with this diagram of globe with magnifying glass. Magnifying glass represents a deep down research approach. Get professional using this diagram to explain global issues minutely in any business or global presentations.

Illustration Of 4 Stages Data Processes And Flows Ppt Linear Rate PowerPoint Slides
We present our illustration of 4 stages data processes and flows ppt linear rate PowerPoint Slides.Present our Circle charts PowerPoint Templates because Our PowerPoint Templates and Slides are Clear and concise. Use them and dispel any doubts your team may have. Use our Process and Flows PowerPoint Templates because Our PowerPoint Templates and Slides will bullet point your ideas. See them fall into place one by one. Use our Business PowerPoint Templates because You should Throw the gauntlet with our PowerPoint Templates and Slides. They are created to take up any challenge. Use our Marketing PowerPoint Templates because It is Aesthetically crafted by artistic young minds. Our PowerPoint Templates and Slides are designed to display your dexterity. Use our Shapes PowerPoint Templates because Our PowerPoint Templates and Slides have the Brilliant backdrops. Guaranteed to illuminate the minds of your audience.Use these PowerPoint slides for presentations relating to Diagram , flow, process, chart, sequence, review, refresh, duplicate, concept, arrow, success, rotation, presentation, course, iterate, relate, circle, ring, recycle, report, work flow, simple, react, repeat, four, cycle, circulation, stage, connection, circular, system, strategy, round, section, direction, swirl, phase, method, procedure, correlate, cyclic, continuity, repetition. The prominent colors used in the PowerPoint template are Orange, Gray, Black.
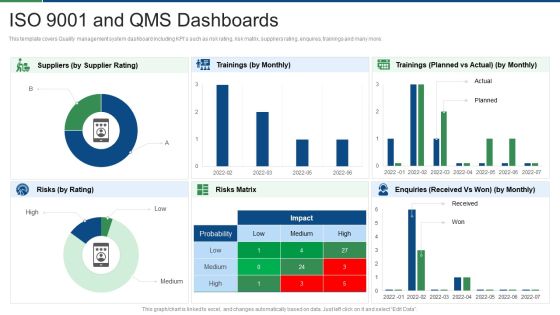
International Standard For Quality Management System ISO 9001 And Qms Dashboards Pictures PDF
This template covers Quality management system dashboard including KPIs such as risk rating, risk matrix, suppliers rating, enquires, trainings and many more. Deliver an awe inspiring pitch with this creative international standard for quality management system iso 9001 and qms dashboards pictures pdf bundle. Topics like suppliers, trainings, enquiries, risks matrix, risks can be discussed with this completely editable template. It is available for immediate download depending on the needs and requirements of the user.

Business Hierarchy Chart With Governance Ppt PowerPoint Presentation File Model PDF
Persuade your audience using this business hierarchy chart with governance ppt powerpoint presentation file model pdf. This PPT design covers five stages, thus making it a great tool to use. It also caters to a variety of topics including financial services, planning and management, risk and digital assurance. Download this PPT design now to present a convincing pitch that not only emphasizes the topic but also showcases your presentation skills.

New Year Theme Of Celebration PowerPoint Templates Ppt Backgrounds For Slides 0413
Your grasp of economics is well known. Help your audience comprehend issues with our New Year Theme Of Celebration PowerPoint Templates PPT Backgrounds For Slides 0413. Strike a bargain with our New Year Theme Of Celebration PowerPoint Templates PPT Backgrounds For Slides 0413. Your thoughts will get a winning deal.
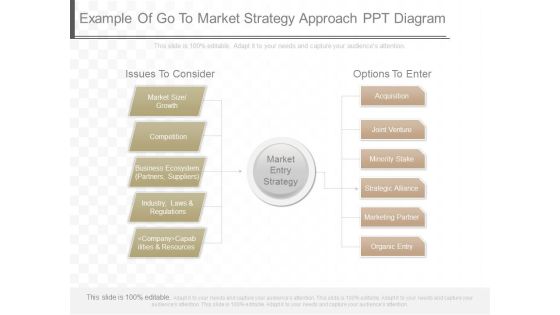
Example Of Go To Market Strategy Approach Ppt Diagram
This is an example of go to market strategy approach ppt diagram. This is a four stage process. The stages in this process are issues to consider, market size growth, competition, business ecosystem partners, suppliers, industry, laws and regulations, company capabilities and resources, market entry strategy, options to enter, acquisition, minority stake, strategic alliance, marketing partner, organic entry.

Ecommerce And Vendor Management Solution Diagram Ppt Sample
This is a ecommerce and vendor management solution diagram ppt sample. This is a three stage process. The stages in this process are business managers, customer, suppliers vendors, product category, ecommerce and vendor management solution, inventory management, campaign management, payment management, issue management, real time reports.
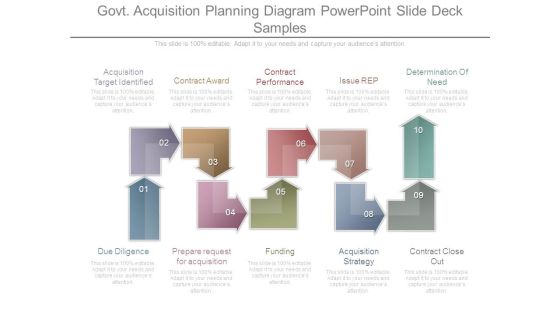
Govt Acquisition Planning Diagram Powerpoint Slide Deck Samples
This is a govt acquisition planning diagram powerpoint slide deck samples. This is a ten stage process. The stages in this process are acquisition target identified, contract award, contract performance, issue rep, determination of need, contract close out, acquisition strategy, funding, prepare request for acquisition, due diligence.
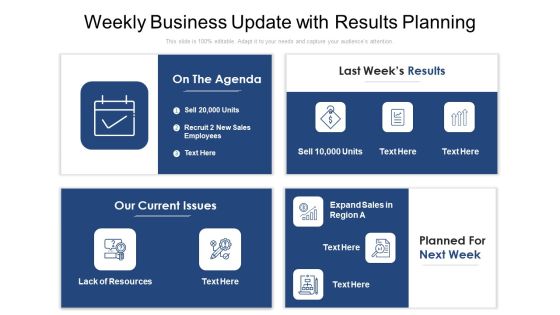
Weekly Business Update With Results Planning Ppt Outline Diagrams PDF
Pitch your topic with ease and precision using this weekly business update with results planning ppt outline diagrams pdf. This layout presents information on agenda, our current issues, resources. It is also available for immediate download and adjustment. So, changes can be made in the color, design, graphics or any other component to create a unique layout.

Chart Showing Legal And Compliance Department Functions Ppt Show Format PDF
Presenting this set of slides with name chart showing legal and compliance department functions ppt show format pdf. This is a three stage process. The stages in this process are enterprise risk management, internal audit compliance, chief compliance officer, office of the general counsel. This is a completely editable PowerPoint presentation and is available for immediate download. Download now and impress your audience.

Project Initiation And Planning Chart With Timeline Ppt PowerPoint Presentation Infographics Skills PDF
Presenting this set of slides with name project initiation and planning chart with timeline ppt powerpoint presentation infographics skills pdf. The topics discussed in these slides are timeline, key risks, budget, in scope, project objectives, project benefits. This is a completely editable PowerPoint presentation and is available for immediate download. Download now and impress your audience.

Profit And Loss Calculation Chart Ppt PowerPoint Presentation Infographic Template Examples PDF
Presenting this set of slides with name profit and loss calculation chart ppt powerpoint presentation infographic template examples pdf. The topics discussed in these slides are risk rewards ratio, take profit distance, stop loss distance, take profit. This is a completely editable PowerPoint presentation and is available for immediate download. Download now and impress your audience.

Team Leader Core Competency Skill Analysis Chart Ppt PowerPoint Presentation Infographic Template Topics PDF
Presenting this set of slides with name team leader core competency skill analysis chart ppt powerpoint presentation infographic template topics pdf. The topics discussed in these slides are self assessment, finance, strategic marketing, strategy development and implementation, risk management, industry experience, competency. This is a completely editable PowerPoint presentation and is available for immediate download. Download now and impress your audience.

Credit Assessment Chart Score Range Ppt PowerPoint Presentation Professional Clipart PDF
Presenting this set of slides with name credit assessment chart score range ppt powerpoint presentation professional clipart pdf. The topics discussed in these slides are score range, grade, grade meaning, risk category, critical. This is a completely editable PowerPoint presentation and is available for immediate download. Download now and impress your audience.

Contractor Assessment Chart With Organizations Management Practices Ppt PowerPoint Presentation Portfolio Maker PDF
Presenting this set of slides with name contractor assessment chart with organizations management practices ppt powerpoint presentation portfolio maker pdf. The topics discussed in these slides are checklist, organisation management practices, risk management, actions required, contractor management. This is a completely editable PowerPoint presentation and is available for immediate download. Download now and impress your audience.

Internal Organizations Board Of Directors Committee Chart Ppt PowerPoint Presentation File Deck PDF
This slide shows the responsibility matrix that covers the issues in different corporate departments such as top management, sales and marketing, engineering, purchasing, operations, finance, etc, with elements such as management responsibility, resource management, etc. Pitch your topic with ease and precision using this internal organizations board of directors committee chart ppt powerpoint presentation file deck pdf. This layout presents information on quality management system, management responsibility, resource management. It is also available for immediate download and adjustment. So, changes can be made in the color, design, graphics or any other component to create a unique layout.

Acquisition Firm Business Outline Procurement Management Process Flow Chart Demonstration PDF
This slide provides the details of the procurement management process flowchart which covers research of exiting and new markets, identify suppliers, negotiate supplier terms, etc. Presenting acquisition firm business outline procurement management process flow chart demonstration pdf to provide visual cues and insights. Share and navigate important information on nine stages that need your due attention. This template can be used to pitch topics like supplier issues, product performance, maintain supplier, evaluate supplier performance. In addtion, this PPT design contains high resolution images, graphics, etc, that are easily editable and available for immediate download.
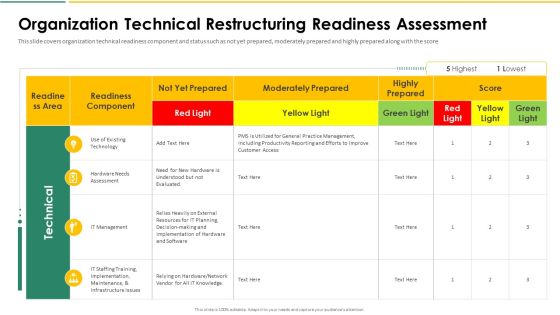
Organization Chart And Corporate Model Transformation Organization Technical Restructuring Graphics PDF
This slide covers organization technical readiness component and status such as not yet prepared, moderately prepared and highly prepared along with the score. Deliver an awe inspiring pitch with this creative organization chart and corporate model transformation organization technical restructuring graphics pdf bundle. Topics like use of existing technology, hardware needs assessment, it management, it staffing training, implementation, maintenance, infrastructure issues can be discussed with this completely editable template. It is available for immediate download depending on the needs and requirements of the user.

Procurement Management Process Flow Chart Procurement Vendor Ppt Show Graphics Template PDF
This slide provides the details of the procurement management process flowchart which covers research of exiting and new markets, identify suppliers, negotiate supplier terms, etc. This is a procurement management process flow chart procurement vendor ppt show graphics template pdf template with various stages. Focus and dispense information on nine stages using this creative set, that comes with editable features. It contains large content boxes to add your information on topics like resolve supplier issues, supplier performance, terms and contract, supplier reviews. You can also showcase facts, figures, and other relevant content using this PPT layout. Grab it now.
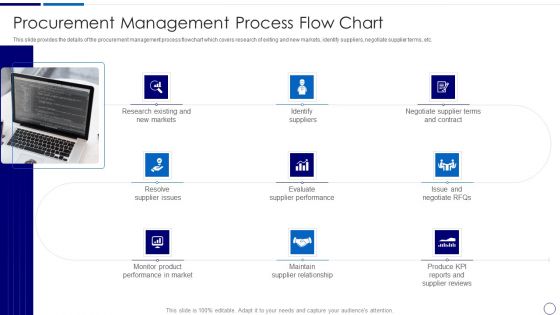
Procurement And SCM Procurement Management Process Flow Chart Ppt Model Topics PDF
This slide provides the details of the procurement management process flowchart which covers research of exiting and new markets, identify suppliers, negotiate supplier terms, etc. Presenting procurement and scm procurement management process flow chart ppt model topics pdf to provide visual cues and insights. Share and navigate important information on nine stages that need your due attention. This template can be used to pitch topics like research existing, new markets, identify suppliers, resolve supplier issues. In addtion, this PPT design contains high resolution images, graphics, etc, that are easily editable and available for immediate download.
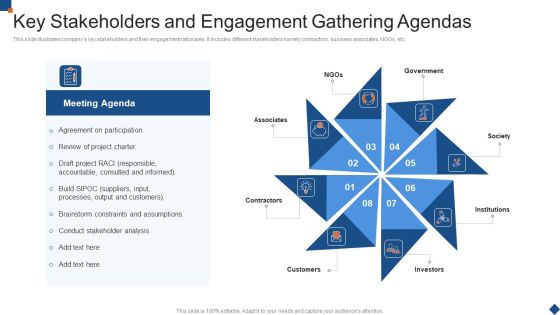
Key Stakeholders And Engagement Gathering Agendas Introduction PDF
This slide illustrates companys key stakeholders and their engagement rationales. It includes different stakeholders namely contractors, business associates, NGOs, etc.Presenting Key Stakeholders And Engagement Gathering Agendas Introduction PDF to dispense important information. This template comprises eight stages. It also presents valuable insights into the topics including Agreement On Participation, Review Of Project, Brainstorm Constraints This is a completely customizable PowerPoint theme that can be put to use immediately. So, download it and address the topic impactfully.
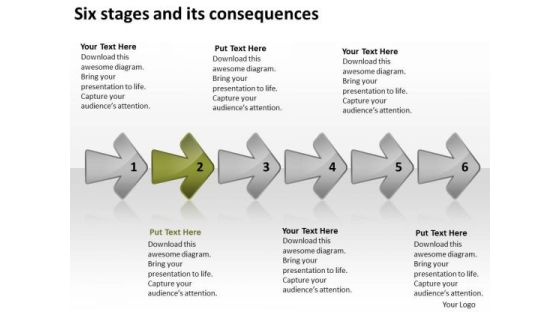
Six Stages And Its Consequences New Business Plan PowerPoint Templates
We present our six stages and its consequences new business plan PowerPoint templates.Use our Business PowerPoint Templates because Building castles in the sand is a danger and you are aware of. You have taken the precaution of building strong fundamentals. Download our Shapes PowerPoint Templates because you can Inform your team of the various means they have to achieve them. Present our Process and flows PowerPoint Templates because that was the well known Musketeers call. Present our Arrows PowerPoint Templates because you can Determine your targets and sequence them as per your priorities. Present our Flow charts PowerPoint Templates because leading from the front is your preferred style.Use these PowerPoint slides for presentations relating to Abstract, around, arrows, business, center, circle, circular, concept, connections curve, cycle, directions, distribution, illustration, management, middle, objects, plan process, recycle, rounded, shadows, space, system. The prominent colors used in the PowerPoint template are Pink, Gray, White. We assure you our six stages and its consequences new business plan PowerPoint templates are Wonderful. Use our arrows PowerPoint templates and PPT Slides are Splendid. Use our six stages and its consequences new business plan PowerPoint templates are Charming. Professionals tell us our circle PowerPoint templates and PPT Slides will help them to explain complicated concepts. Professionals tell us our six stages and its consequences new business plan PowerPoint templates will help them to explain complicated concepts. People tell us our circular PowerPoint templates and PPT Slides are One-of-a-kind.
Organizing Security Awareness Functional Chart Of Cyber Security Team Background PDF
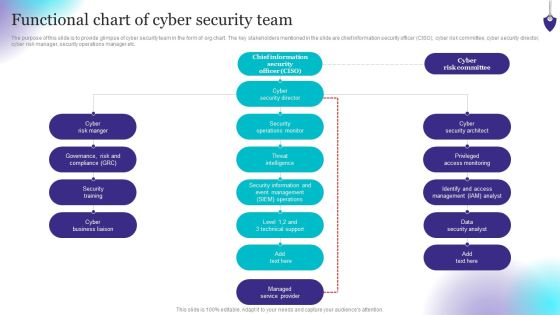
The purpose of this slide is to provide glimpse of cyber security team in the form of org chart. The key stakeholders mentioned in the slide are chief information security officer CISO, cyber risk committee, cyber security director, cyber risk manager, security operations manager etc. Do you have an important presentation coming up Are you looking for something that will make your presentation stand out from the rest Look no further than Organizing Security Awareness Functional Chart Of Cyber Security Team Background PDF. With our professional designs, you can trust that your presentation will pop and make delivering it a smooth process. And with Slidegeeks, you can trust that your presentation will be unique and memorable. So why wait Grab Organizing Security Awareness Functional Chart Of Cyber Security Team Background PDF today and make your presentation stand out from the rest.

How Security Concerns Affect Firm In Present Times Pictures PDF
This slide portrays information regarding the concerns that are currently existing in the organizations. It is essential for top level management to keep check on existing concerns as they have severe impact on firms growth in terms of huge financial losses and bad public image. Deliver an awe inspiring pitch with this creative how security concerns affect firm in present times pictures pdf bundle. Topics like reported financial losses due to increase security threats, data breaches and records exposed, security threat incidents can be discussed with this completely editable template. It is available for immediate download depending on the needs and requirements of the user.

 Home
Home