Private Equity Dashboard

Banking Operation Strategy Dashboard Highlighting Deposits And Growth Rate Icons PDF
This slide highlights the banking operation strategy dashboard which showcases current account and saving account growth rate, savings account deposits, current account deposits and retail term deposits. Deliver and pitch your topic in the best possible manner with this Banking Operation Strategy Dashboard Highlighting Deposits And Growth Rate Icons PDF. Use them to share invaluable insights on Current Account Deposits, Retail Term Deposits, Growth Rate and impress your audience. This template can be altered and modified as per your expectations. So, grab it now.
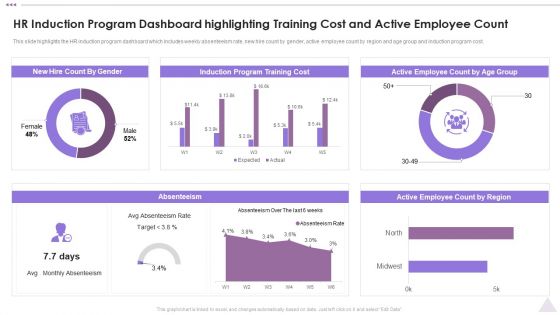
New Staff Orientation Session HR Induction Program Dashboard Highlighting Training Cost Template PDF
This slide highlights the HR induction program dashboard which includes weekly absenteeism rate, new hire count by gender, active employee count by region and age group and induction program cost. Deliver and pitch your topic in the best possible manner with this New Staff Orientation Session HR Induction Program Dashboard Highlighting Training Cost Template PDF. Use them to share invaluable insights on Induction Program, Training Cost, Absenteeism, Active Employee and impress your audience. This template can be altered and modified as per your expectations. So, grab it now.

Insider Threat In Cyber Security Detection And Prevention Dashboard Diagrams PDF
This slide shows dashboard for detecting and preventing insider threats. It provides details about antivirus, vector detection, patch, admin access, email security, network and endpoint threat, etc. Pitch your topic with ease and precision using this Insider Threat In Cyber Security Detection And Prevention Dashboard Diagrams PDF. This layout presents information on Active Clients, Network Threat Prevention, Endpoint Threat Prevention. It is also available for immediate download and adjustment. So, changes can be made in the color, design, graphics or any other component to create a unique layout.

Integrating Social Media Tactics Dashboard For Monitoring Social Media Traffic Ideas PDF
This slide shows dashboard for tracking social media traffic. It provides details about sessions, bounce rate, average time on platform, pages per visit, clicks, goals, goal conversion rate, Facebook, Instagram, YouTube, Snapchat, etc. Deliver and pitch your topic in the best possible manner with this Integrating Social Media Tactics Dashboard For Monitoring Social Media Traffic Ideas PDF. Use them to share invaluable insights on Social Traffic, Social Goals, Goal Conversion Rate and impress your audience. This template can be altered and modified as per your expectations. So, grab it now.
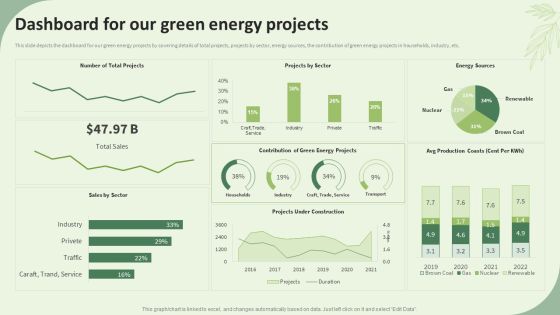
Sustainable Energy Resources Dashboard For Our Green Energy Projects Mockup PDF
This slide depicts the dashboard for our green energy projects by covering details of total projects, projects by sector, energy sources, the contribution of green energy projects in households, industry, etc. Deliver and pitch your topic in the best possible manner with this Sustainable Energy Resources Dashboard For Our Green Energy Projects Mockup PDF. Use them to share invaluable insights on Projects Sector, Energy Sources, Sales Sector and impress your audience. This template can be altered and modified as per your expectations. So, grab it now.

Brand Promotion Communication Strategy Dashboard For Analyzing Brand Perception Introduction PDF
This slide covers the dashboard for tracking brand reputation. It also includes metrics such as new customer lifetime value, customer acquisition cost, target met, above sales target, average weekly sales revenue, etc. Deliver an awe inspiring pitch with this creative Brand Promotion Communication Strategy Dashboard For Analyzing Brand Perception Introduction PDF bundle. Topics like New customer YTD, Sales revenue YTD, Profit YTD can be discussed with this completely editable template. It is available for immediate download depending on the needs and requirements of the user.

Organic Business Growth Strategies Dashboard For Measuring Success Of Our Marketing Efforts Diagrams PDF
Purpose of the following slide is to display a dashboard to help analyze the marketing efforts through essential metrics such as the revenue generated, average revenue generated per unit etc. Deliver an awe inspiring pitch with this creative Organic Business Growth Strategies Dashboard For Measuring Success Of Our Marketing Efforts Diagrams PDF bundle. Topics like Average Revenue, Customer Lifetime Value, Customer Acquisition Cost can be discussed with this completely editable template. It is available for immediate download depending on the needs and requirements of the user.

Organic Business Growth Strategies Dashboard To Analyse Organic Growth Post Global Expansion Background PDF
Purpose of the following slide is to display a dashboard to help analyze the organic growth through essential metrics such as actual vs. target sales, gross profit, sales growth etc. Deliver and pitch your topic in the best possible manner with this Organic Business Growth Strategies Dashboard To Analyse Organic Growth Post Global Expansion Background PDF. Use them to share invaluable insights on Sales, Product, Target and impress your audience. This template can be altered and modified as per your expectations. So, grab it now.

Tactical Process For Social Dashboard Depicting Social Media Recruitment Metrics Themes PDF
This slide depicts the dashboard showing metrics to measure social media recruitment status which covers sourcing status, bounce rate, filled positions, recruitment expenses, cost per hire, top referrers, etc. Deliver and pitch your topic in the best possible manner with this Tactical Process For Social Dashboard Depicting Social Media Recruitment Metrics Themes PDF. Use them to share invaluable insights on Recruitment Expenses, Bounce Rate, Positions Filled and impress your audience. This template can be altered and modified as per your expectations. So, grab it now.
Precooked Food Industry Analysis KPI Dashboard For Tracking Supply Chain Costs Diagrams PDF
This slide represents the KPI dashboard to track the multiple cost associated with supply chain in food manufacturing industry. It includes information regarding cash to cash cycle in days, carry cost of inventory along with details of net sales.Deliver an awe inspiring pitch with this creative Precooked Food Industry Analysis KPI Dashboard For Tracking Supply Chain Costs Diagrams PDF bundle. Topics like Processing Industry, Food Processing, Manufacturing Industry can be discussed with this completely editable template. It is available for immediate download depending on the needs and requirements of the user.

Optimizing Ecommerce Marketing Plan To Improve Sales Dashboard Depicting Metrics Of Digital Marketing Campaign Information PDF
This slide shows the dashboard that depicts the metrics used for measuring digital marketing campaign that covers bounce rate, pageviews, conversions, social media followers, etc. Deliver and pitch your topic in the best possible manner with this Optimizing Ecommerce Marketing Plan To Improve Sales Dashboard Depicting Metrics Of Digital Marketing Campaign Information PDF. Use them to share invaluable insights on Traffic Sources, Conversion Rate, Revenue Growth Rate and impress your audience. This template can be altered and modified as per your expectations. So, grab it now.

Strategies To Enhance Project Management Process Dashboard Depicting Project Associated Risks And Issues Background PDF
This slide focuses on project management dashboard which covers the project name, status date overall status, monthly schedule such as analysis, development, quality assurance, user acceptance, pre production and support with actual and planned budget, pending decisions and actions, etc. Deliver and pitch your topic in the best possible manner with this Strategies To Enhance Project Management Process Dashboard Depicting Project Associated Risks And Issues Background PDF. Use them to share invaluable insights on Quality Assurance, Development, Analysis and impress your audience. This template can be altered and modified as per your expectations. So, grab it now.
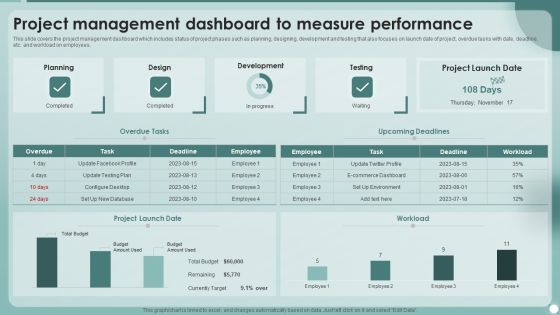
Strategies To Enhance Project Management Process Project Management Dashboard To Measure Performance Ideas PDF
This slide covers the project management dashboard which includes status of project phases such as planning, designing, development and testing that also focuses on launch date of project, overdue tasks with date, deadline, etc. and workload on employees. Deliver and pitch your topic in the best possible manner with this Strategies To Enhance Project Management Process Project Management Dashboard To Measure Performance Ideas PDF. Use them to share invaluable insights on Employee, Project Launch, Development, Design and impress your audience. This template can be altered and modified as per your expectations. So, grab it now.

Banking Operation Strategy Dashboard Highlighting Deposits And Growth Rate Themes PDF
This slide highlights the banking operation strategy dashboard which showcases current account and saving account growth rate, savings account deposits, current account deposits and retail term deposits. Deliver and pitch your topic in the best possible manner with this Banking Operation Strategy Dashboard Highlighting Deposits And Growth Rate Themes PDF. Use them to share invaluable insights on Current Account Deposits, Growth Rate, Retail Term Deposits and impress your audience. This template can be altered and modified as per your expectations. So, grab it now.
Half Yearly Content Project Plan Analysis Dashboard Ppt Icon Background Designs PDF
This slide defines the dashboard for 6 month content project plan analysis . it includes information related to the progress, risk , project summary, tasks, etc. Pitch your topic with ease and precision using this Half Yearly Content Project Plan Analysis Dashboard Ppt Icon Background Designs PDF. This layout presents information on Overall Progress, Planning, Risks. It is also available for immediate download and adjustment. So, changes can be made in the color, design, graphics or any other component to create a unique layout.

Corporate Governance In Line With Impact Assessment Dashboard Ppt File Backgrounds PDF
This slide shows a dashboard incorporating statistics of impacts on environment, employees and society at large due to the operations of a business undertaking. Herein, corporate governance plays a role in reducing the damage done to the environment by the firms operations. Pitch your topic with ease and precision using this Corporate Governance In Line With Impact Assessment Dashboard Ppt File Backgrounds PDF. This layout presents information on Financials, Profit, ABC Organization. It is also available for immediate download and adjustment. So, changes can be made in the color, design, graphics or any other component to create a unique layout.
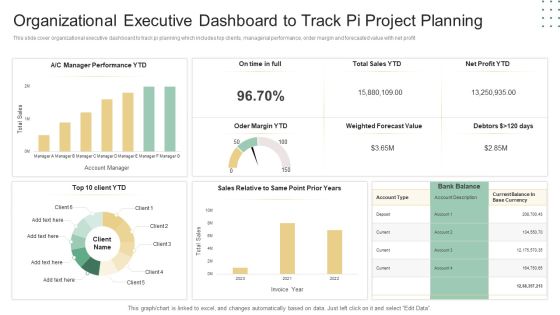
Organizational Executive Dashboard To Track Pi Project Planning Ppt Professional Background PDF
This slide cover organizational executive dashboard to track pi planning which includes top clients, managerial performance, order margin and forecasted value with net profit. Pitch your topic with ease and precision using this Organizational Executive Dashboard To Track Pi Project Planning Ppt Professional Background PDF. This layout presents information on Weighted Forecast Value, Top 10, Client YTD. It is also available for immediate download and adjustment. So, changes can be made in the color, design, graphics or any other component to create a unique layout.
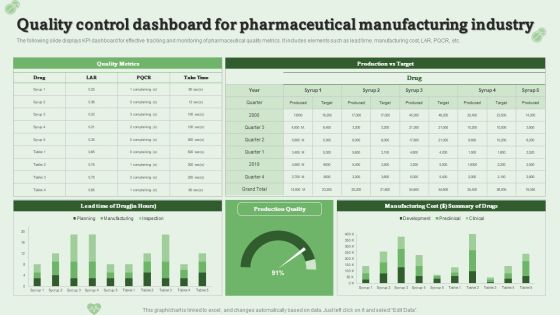
Quality Control Dashboard For Pharmaceutical Manufacturing Industry Ppt PowerPoint Presentation Model Layouts PDF
The following slide displays KPI dashboard for effective tracking and monitoring of pharmaceutical quality metrics. It includes elements such as lead time, manufacturing cost, LAR, PQCR, etc.Pitch your topic with ease and precision using this Quality Control Dashboard For Pharmaceutical Manufacturing Industry Ppt PowerPoint Presentation Model Layouts PDF. This layout presents information on Manufacturing Cost, Summary Drugs, Quality Metrics. It is also available for immediate download and adjustment. So, changes can be made in the color, design, graphics or any other component to create a unique layout.

Dashboard For Analyzing Hiring Status In Organization Ppt PowerPoint Presentation Gallery Images PDF
This slide defines the analysis dashboard for recruitment status. It includes information related to hiring funnel, age of applicants, and male and female ratio. Pitch your topic with ease and precision using this Dashboard For Analyzing Hiring Status In Organization Ppt PowerPoint Presentation Gallery Images PDF. This layout presents information on Recruitment Funnel, Time To Hire, Age Applicants. It is also available for immediate download and adjustment. So, changes can be made in the color, design, graphics or any other component to create a unique layout.

Deploying Iot In Logistics And Supply Chain Iot Dashboard For Managing Fleet Units Download PDF
This slide showcases Internet of Things IoT integrated dashboard which can assist logistics managers in fleet management. It provides information about employees, fleet status, truck, car, container, moving units, engine hours, etc. Deliver and pitch your topic in the best possible manner with this Deploying Iot In Logistics And Supply Chain Iot Dashboard For Managing Fleet Units Download PDF. Use them to share invaluable insights on Fleet Status, Employees, Unit Types and impress your audience. This template can be altered and modified as per your expectations. So, grab it now.

Customer Client Referral Program Performance Dashboard Ppt File Visual Aids PDF
This slide covers customer referral program performance evaluating dashboard. It involves participation rate by referrals, number of referred customers, conversion rate and total revenue generated. Pitch your topic with ease and precision using this Customer Client Referral Program Performance Dashboard Ppt File Visual Aids PDF. This layout presents information on Participation Rate Referrals, Number Referred Customers, Referral Conversion Rate. It is also available for immediate download and adjustment. So, changes can be made in the color, design, graphics or any other component to create a unique layout.
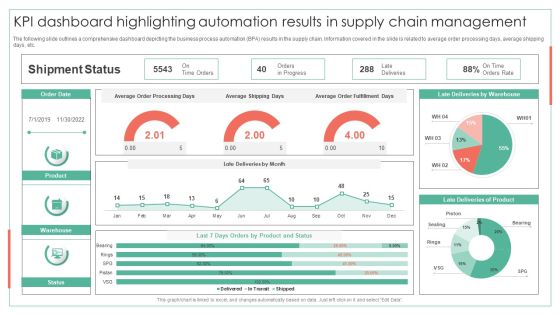
KPI Dashboard Highlighting Automation Results In Supply Achieving Operational Efficiency Graphics PDF
The following slide outlines a comprehensive dashboard depicting the business process automation BPA results in the supply chain. Information covered in the slide is related to average order processing days, average shipping days, etc.Deliver and pitch your topic in the best possible manner with this KPI Dashboard Highlighting Automation Results In Supply Achieving Operational Efficiency Graphics PDF. Use them to share invaluable insights on Orders Progress, Late Deliveries, Deliveries Warehouse and impress your audience. This template can be altered and modified as per your expectations. So, grab it now.

Improve IT Service Desk Service Desk Dashboard For Monitoring IT Infrastructure Introduction PDF
This slide illustrates service desk dashboard for monitoring information technology IT infrastructure. It provides information about issues, safety inspection, problem servers, workstations, operating system, Windows, Mac, Linux, etc.Deliver and pitch your topic in the best possible manner with this Improve IT Service Desk Service Desk Dashboard For Monitoring IT Infrastructure Introduction PDF. Use them to share invaluable insights on Problem Servers, Problem Workstations, Operating System and impress your audience. This template can be altered and modified as per your expectations. So, grab it now.

Investment Project KPI Dashboard With Labor Hour And Cost Analysis Portrait PDF
This slide displays KPI dashboard for project health analysis. It also include metrics such as total projects, cost, progress, status, projects by highest actual hours, highest actual labour cost, highest actual non-labour cost, etc. Pitch your topic with ease and precision using this Investment Project KPI Dashboard With Labor Hour And Cost Analysis Portrait PDF. This layout presents information on Project Health, Project Progress, Project Status. It is also available for immediate download and adjustment. So, changes can be made in the color, design, graphics or any other component to create a unique layout.

Consumer Journey Mapping Techniques Loyalty Program Performance Tracking Dashboard Portrait PDF
This slide covers the KPI dashboard for analyzing customer loyalty campaign results. It includes metrics such as revenue, liability, NQP accrued, transaction count, members, redemption ratio, etc. Pitch your topic with ease and precision using this Consumer Journey Mapping Techniques Loyalty Program Performance Tracking Dashboard Portrait PDF. This layout presents information on Transaction Count, Revenue, Redemption Ratio. It is also available for immediate download and adjustment. So, changes can be made in the color, design, graphics or any other component to create a unique layout.

Strategic Plan For New Product Project Launch Plan Progress Dashboard Slides PDF
The slide presents a dashboard showing progress or current status of plan for launch of project. It includes percentage of total work done and work done by each member. Pitch your topic with ease and precision using this Strategic Plan For New Product Project Launch Plan Progress Dashboard Slides PDF. This layout presents information on Louis Garter, Dependency, High Priority. It is also available for immediate download and adjustment. So, changes can be made in the color, design, graphics or any other component to create a unique layout.

Compliance Management Kpi Dashboard For Building And Construction Sector Inspiration PDF
This slide covers quality management KPI dashboard for construction industry. It involves success rate at site inspection, customer complaints, total rework cost, customer satisfaction ratio. Pitch your topic with ease and precision using this Compliance Management Kpi Dashboard For Building And Construction Sector Inspiration PDF. This layout presents information on Customer Complaints, Customer Satisfaction, Safety Meetings. It is also available for immediate download and adjustment. So, changes can be made in the color, design, graphics or any other component to create a unique layout.

KPI Dashboard To Assess Facebook Business Marketing Approach Performance Portrait PDF
This slide covers KPI dashboard to assess Facebook marketing strategy performance. It involves details such as audience engagement, page engagement, page likes and post shares. Pitch your topic with ease and precision using this KPI Dashboard To Assess Facebook Business Marketing Approach Performance Portrait PDF. This layout presents information on Audience Engagement, Page Engagement, Post Comments. It is also available for immediate download and adjustment. So, changes can be made in the color, design, graphics or any other component to create a unique layout.

Business To Business Model Lead Management Dashboard Ppt Portfolio Backgrounds PDF
This slide showcases business to business b2b lead management dashboard. It provides information about lead funnel, pipeline, sales, opportunities, campaign, status, primary offer, etc. Pitch your topic with ease and precision using this Business To Business Model Lead Management Dashboard Ppt Portfolio Backgrounds PDF. This layout presents information on Leads Generated, Pipeline Generated, Sales Generated, Opportunities. It is also available for immediate download and adjustment. So, changes can be made in the color, design, graphics or any other component to create a unique layout.

Retail Store Multiple Point Of Sale System Dashboard With Product Invoice Inspiration PDF
This Slide illustrates retail store point of sale system POS dashboard showing product bill which can be beneficial for shopkeepers who want to employ invoice system in their stores. It includes information about product, price, quantity, total amount, payment methods, etc. Pitch your topic with ease and precision using this Retail Store Multiple Point Of Sale System Dashboard With Product Invoice Inspiration PDF. This layout presents information on Payment Method, Product, Availability. It is also available for immediate download and adjustment. So, changes can be made in the color, design, graphics or any other component to create a unique layout.

Business Operational Expenditure Dashboard Indicating Revenue And Costs Metrics Pictures PDF
This slide shows operating expenses OPEX dashboard indicating revenue and costs metrics which can be referred by companies to manage various operating expenses of various departments. It contains information about cost center, revenue per company, company code, etc. Pitch your topic with ease and precision using this Business Operational Expenditure Dashboard Indicating Revenue And Costs Metrics Pictures PDF. This layout presents information on Business Operational, Costs Metrics, Revenue. It is also available for immediate download and adjustment. So, changes can be made in the color, design, graphics or any other component to create a unique layout.

KPI Dashboard To Track Process Products Sold By Insurance Topics PDF
This slide shows dashboard which can be used to compare insurance sales of current and previous year. It includes metrics such as monthly policy status, quarterly premium revenue, overall policy status, etc. Pitch your topic with ease and precision using this KPI Dashboard To Track Process Products Sold By Insurance Topics PDF. This layout presents information on Overall Policy Status, Quarterly Premium Revenue, Monthly Policy Status. It is also available for immediate download and adjustment. So, changes can be made in the color, design, graphics or any other component to create a unique layout.

Customer Service KPI Dashboard For Technical Support Ppt Model Vector PDF
This slide covers customer service KPI dashboard for technical support. It involves details such as total number of issues arise daily, overall average response time, number of issues by channel and top performing technical engineers. Pitch your topic with ease and precision using this Customer Service KPI Dashboard For Technical Support Ppt Model Vector PDF. This layout presents information on Overall Average, Response Time, Total Number, Issues Arise Daily. It is also available for immediate download and adjustment. So, changes can be made in the color, design, graphics or any other component to create a unique layout.
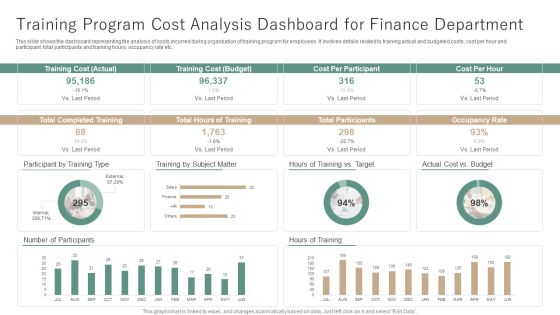
Training Program Cost Analysis Dashboard For Finance Department Ppt Example PDF
This slide shows the dashboard representing the analysis of costs incurred during organization of training program for employees. It involves details related to training actual and budgeted costs, cost per hour and participant, total participants and training hours, occupancy rate etc. Pitch your topic with ease and precision using this Training Program Cost Analysis Dashboard For Finance Department Ppt Example PDF. This layout presents information on Training Cost, Number Participants, Hours Of Training. It is also available for immediate download and adjustment. So, changes can be made in the color, design, graphics or any other component to create a unique layout.

Managing Cyber Security Incident Response KPI Dashboard Ppt Layouts Shapes PDF
This slide covers cyber security incident response KPI dashboard. It involves details such as intent alarm, event trend sources, event trend, sensor activity, major operating systems and asset information. Pitch your topic with ease and precision using this Managing Cyber Security Incident Response KPI Dashboard Ppt Layouts Shapes PDF. This layout presents information on Top Alarms Method, Alarms Intent, Timely Event Trend. It is also available for immediate download and adjustment. So, changes can be made in the color, design, graphics or any other component to create a unique layout.
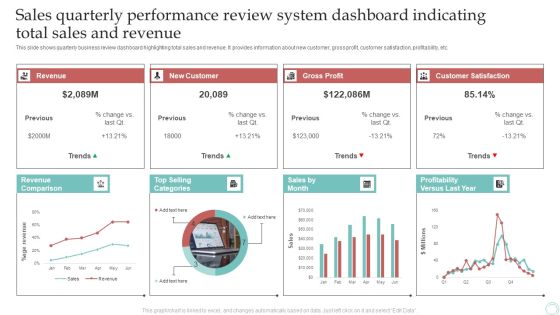
Sales Quarterly Performance Review System Dashboard Indicating Total Sales And Revenue Download PDF
This slide shows quarterly business review dashboard highlighting total sales and revenue. It provides information about new customer, gross profit, customer satisfaction, profitability, etc. Pitch your topic with ease and precision using this Sales Quarterly Performance Review System Dashboard Indicating Total Sales And Revenue Download PDF. This layout presents information on Revenue, New Customer, Gross Profit. It is also available for immediate download and adjustment. So, changes can be made in the color, design, graphics or any other component to create a unique layout.

Business Threats Landscape Dashboard With Cyber Attacks Analysis Ppt Summary Brochure PDF
This slide illustrates risk landscape dashboard with cyber attacks analysis which contains malware attack frequency, country wise attacks, top 10 attacks, etc. It can assist IT managers in analyzing top threats so that they can be dealt with proper efficiency. Pitch your topic with ease and precision using this Business Threats Landscape Dashboard With Cyber Attacks Analysis Ppt Summary Brochure PDF. This layout presents information on Malware Attack Frequency, Every Minute, Every Second. It is also available for immediate download and adjustment. So, changes can be made in the color, design, graphics or any other component to create a unique layout.

Change Order Administration Dashboard With Priority Assessment Ppt Portfolio Inspiration PDF
This slide showcases change order management dashboard with priority assessment. It provides information about order stats, summary, latest change orders and priority according to rank. Pitch your topic with ease and precision using this Change Order Administration Dashboard With Priority Assessment Ppt Portfolio Inspiration PDF. This layout presents information on Change Orders Priority, Change Order Stats, Change Orders Summary. It is also available for immediate download and adjustment. So, changes can be made in the color, design, graphics or any other component to create a unique layout.

Monthly Project Progress Report Dashboard With Assigned Tasks Ppt Styles Clipart PDF
This slide showcases monthly project status dashboard with assigned tasks. It provides information about kick off meeting, resource plan, technical requests, development, hardware configuration, budget, pending items, etc. Pitch your topic with ease and precision using this Monthly Project Progress Report Dashboard With Assigned Tasks Ppt Styles Clipart PDF. This layout presents information on Pending Items, Budget, Kick Off Meeting. It is also available for immediate download and adjustment. So, changes can be made in the color, design, graphics or any other component to create a unique layout.

Improving Effective Human Resource Communication Impact On Employee Engagement Dashboard Slides PDF
This slide shows the dashboard representing the impact of effective hr communication within the organization on employee engagement score. It shows details related to engagement score, response rate, engagement score of teams, net promoter score etc. Pitch your topic with ease and precision using this Improving Effective Human Resource Communication Impact On Employee Engagement Dashboard Slides PDF. This layout presents information on Engagement Score, Response Rate, Engagement Score Levels. It is also available for immediate download and adjustment. So, changes can be made in the color, design, graphics or any other component to create a unique layout.
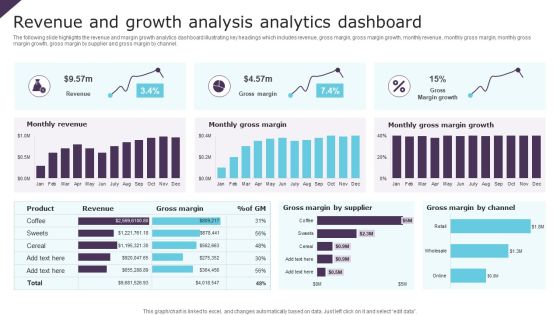
Revenue And Growth Analysis Analytics Dashboard Ppt Infographic Template Brochure PDF
The following slide highlights the revenue and margin growth analytics dashboard illustrating key headings which includes revenue, gross margin, gross margin growth, monthly revenue, monthly gross margin, monthly gross margin growth, gross margin by supplier and gross margin by channel. Pitch your topic with ease and precision using this Revenue And Growth Analysis Analytics Dashboard Ppt Infographic Template Brochure PDF. This layout presents information on Monthly Revenue, Monthly Gross Margin, Gross Margin Growth. It is also available for immediate download and adjustment. So, changes can be made in the color, design, graphics or any other component to create a unique layout.

Network Risks Management And Barriers Dashboard Ppt PowerPoint Presentation Gallery Graphic Tips PDF
This slide represents a dashboard of network risk management. It also includes problem servers , workstations and their status, unmonitored network devices. Pitch your topic with ease and precision using this Network Risks Management And Barriers Dashboard Ppt PowerPoint Presentation Gallery Graphic Tips PDF. This layout presents information on Problem Servers, Server Status, Problem Workstations, Workstation Status. It is also available for immediate download and adjustment. So, changes can be made in the color, design, graphics or any other component to create a unique layout.

Continuous Integration Dashboard For Automated Testing Framework Ppt Layouts Layout Ideas PDF
This slide shows continuous integration dashboard for test automation framework which can be referred by authors to review their testing performance. It contains information about weekly change volume by author, monthly change volume by author, repository, etc. Pitch your topic with ease and precision using this Continuous Integration Dashboard For Automated Testing Framework Ppt Layouts Layout Ideas PDF. This layout presents information on Total Changes Volume, Monthly Change Volume, Weekly Change Volume. It is also available for immediate download and adjustment. So, changes can be made in the color, design, graphics or any other component to create a unique layout.

Customer NPS Metric Dashboard For Call Centers Ppt Inspiration Smartart PDF
This slide shows net promoter score dashboard for call centers which contains occupancy rate, tickets unassigned, opened tickets, completed tickets and raised tickets. It also has details on resolution rate on first call, enquiries, etc. Pitch your topic with ease and precision using this Customer NPS Metric Dashboard For Call Centers Ppt Inspiration Smartart PDF. This layout presents information on Occupancy Rate, Resolution Rate, Net Promoter Score. It is also available for immediate download and adjustment. So, changes can be made in the color, design, graphics or any other component to create a unique layout.

Budget And Time Forecast Dashboard For Project Management Ppt Pictures Format Ideas PDF
This slide represents the dashboard for cost and time estimation of the organizational product which gives a clear view of the health, time, tasks, cost, progress rate and completion of project status to help the management to effectively estimate its success or failure and make changes accordingly. Pitch your topic with ease and precision using this Budget And Time Forecast Dashboard For Project Management Ppt Pictures Format Ideas PDF. This layout presents information on Health, Progress, Cost, Workload. It is also available for immediate download and adjustment. So, changes can be made in the color, design, graphics or any other component to create a unique layout.

Project Controlling Dashboard Indicating Stages And Deliverables Ppt Styles Guide PDF
This slide shows dashboard for controlling multiple phases and deliverables of project. It provides information such as total revenue, cost, margin, task by status, risk, planned end date, owner, etc. Pitch your topic with ease and precision using this Project Controlling Dashboard Indicating Stages And Deliverables Ppt Styles Guide PDF. This layout presents information on Total Revenue, Total Margin, Total Cost. It is also available for immediate download and adjustment. So, changes can be made in the color, design, graphics or any other component to create a unique layout.

Kpi Dashboard To Track Applicant Selection Process Ppt PowerPoint Presentation File Graphics Template PDF
This slide shows dashboard which can be used to monitor the progress of recruitment process. It includes metrics such as applications received, shortlisted applicant, selected candidates, etc. Pitch your topic with ease and precision using this Kpi Dashboard To Track Applicant Selection Process Ppt PowerPoint Presentation File Graphics Template PDF. This layout presents information on Applications Received, Shortlisted Candidates, Selected Candidates. It is also available for immediate download and adjustment. So, changes can be made in the color, design, graphics or any other component to create a unique layout.

Dashboard To Assess IT Security Awareness Training Program Efficiency Brochure PDF
This slide covers KPI dashboard to assess training program efficiency. It involves details such as overall responses on monthly basis, employee satisfaction rate, net promoter score and major training courses. Pitch your topic with ease and precision using this Dashboard To Assess IT Security Awareness Training Program Efficiency Brochure PDF. This layout presents information on Major Training Course, Major Satisfactory, Training Course. It is also available for immediate download and adjustment. So, changes can be made in the color, design, graphics or any other component to create a unique layout.

KPI Dashboard For ESO System Ppt PowerPoint Presentation File Template PDF
This slide covers kpi dashboard for enterprise security operations. It involves details such as active alerts, active automated investigation, devices with major issues and report of daily devices. Pitch your topic with ease and precision using this KPI Dashboard For ESO System Ppt PowerPoint Presentation File Template PDF. This layout presents information on Security Health, Misconfigured, Service Operating Normally. It is also available for immediate download and adjustment. So, changes can be made in the color, design, graphics or any other component to create a unique layout.

ESO System Incident Management KPI Dashboard Ppt PowerPoint Presentation File Graphic Images PDF
This slide covers enterprise security operation incident management kpi dashboard. It involves details such as average resolution time, new incidents, incident status and new incidents by category. Pitch your topic with ease and precision using this ESO System Incident Management KPI Dashboard Ppt PowerPoint Presentation File Graphic Images PDF. This layout presents information on Average Resolution Time, Incident Status, New Incidents. It is also available for immediate download and adjustment. So, changes can be made in the color, design, graphics or any other component to create a unique layout.
Issues Tracking Dashboard For Organizational Building Management Ppt Infographics Topics PDF
This slide showcases dashboard which can help organization to keep track of issues plus faults during facility management and rectify them within stipulated time. Its key elements are issues reported, fault tracking, etc. Pitch your topic with ease and precision using this Issues Tracking Dashboard For Organizational Building Management Ppt Infographics Topics PDF. This layout presents information on Fault Tracking, Issues Reported, Location. It is also available for immediate download and adjustment. So, changes can be made in the color, design, graphics or any other component to create a unique layout.

Building Management Dashboard Highlighting Power Consumption And Occupancy Rate Template PDF
This slide showcases dashboard that can help organization to keep track of power consumed by machinery and occupancy rate during facility management. Its key components are HVAC, occupancy rate, service requests and temperature. Pitch your topic with ease and precision using this Building Management Dashboard Highlighting Power Consumption And Occupancy Rate Template PDF. This layout presents information on Lighting, Power, Water, Electricity, Temperature. It is also available for immediate download and adjustment. So, changes can be made in the color, design, graphics or any other component to create a unique layout.

KPI Dashboard To Track E Commerce Business Revenue Analysis Rules PDF
This slide shows dashboard which can be used by organizations to monitor ecommerce revenue analysis. It includes metrics such as orders, purchases, delivery status etc. Pitch your topic with ease and precision using this KPI Dashboard To Track E Commerce Business Revenue Analysis Rules PDF. This layout presents information on Total Purchases, Total Sales, Pending Delivery, Collection. It is also available for immediate download and adjustment. So, changes can be made in the color, design, graphics or any other component to create a unique layout.
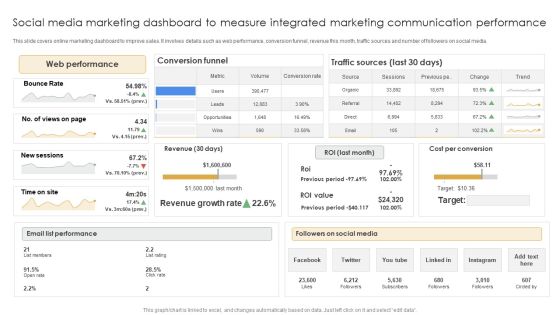
Social Media Marketing Dashboard To Measure Integrated Marketing Communication Performance Clipart PDF
This slide covers online marketing dashboard to improve sales. It involves details such as web performance, conversion funnel, revenue this month, traffic sources and number of followers on social media. Pitch your topic with ease and precision using this Social Media Marketing Dashboard To Measure Integrated Marketing Communication Performance Clipart PDF. This layout presents information on Web Performance, Email List Performance, Followers Social Media. It is also available for immediate download and adjustment. So, changes can be made in the color, design, graphics or any other component to create a unique layout.
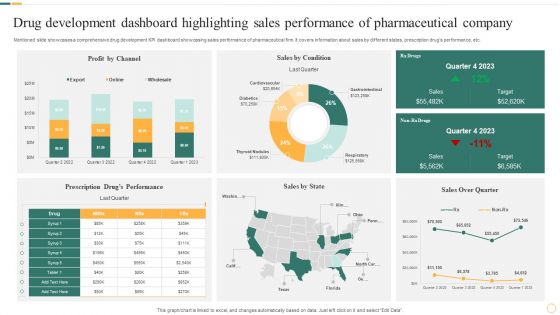
Drug Development Dashboard Highlighting Sales Performance Of Pharmaceutical Company Microsoft PDF
Mentioned slide showcases a comprehensive drug development KPI dashboard showcasing sales performance of pharmaceutical firm. It covers information about sales by different states, prescription drugs performance, etc. Pitch your topic with ease and precision using this Drug Development Dashboard Highlighting Sales Performance Of Pharmaceutical Company Microsoft PDF. This layout presents information on Sales By Condition, Profit By Channel, Sales By State. It is also available for immediate download and adjustment. So, changes can be made in the color, design, graphics or any other component to create a unique layout.
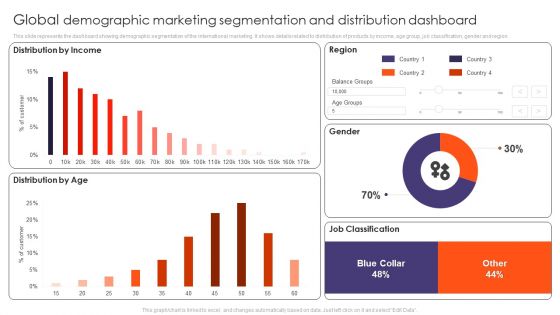
Global Demographic Marketing Segmentation And Distribution Dashboard Ppt Gallery Tips PDF
This slide represents the dashboard showing demographic segmentation of the international marketing. It shows details related to distribution of products by income, age group, job classification, gender and region. Pitch your topic with ease and precision using this Global Demographic Marketing Segmentation And Distribution Dashboard Ppt Gallery Tips PDF. This layout presents information on Distribution Income, Distribution Age, Region, Gender, Job Classification. It is also available for immediate download and adjustment. So, changes can be made in the color, design, graphics or any other component to create a unique layout.
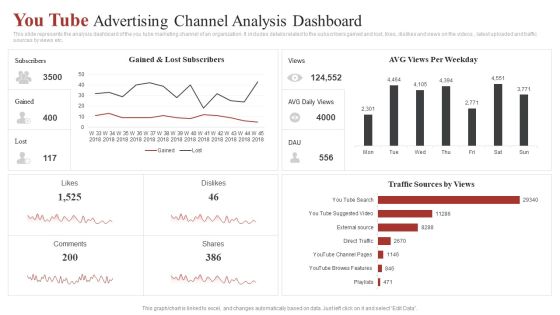
You Tube Advertising Channel Analysis Dashboard Ppt Gallery Clipart Images PDF
This slide represents the analysis dashboard of the you tube marketing channel of an organization. It includes details related to the subscribers gained and lost, likes, dislikes and views on the videos , latest uploaded and traffic sources by views etc. Pitch your topic with ease and precision using this You Tube Advertising Channel Analysis Dashboard Ppt Gallery Clipart Images PDF. This layout presents information on AVG Views, Per Weekday, Traffic Sources Views . It is also available for immediate download and adjustment. So, changes can be made in the color, design, graphics or any other component to create a unique layout.
Robotic Process Automation Dashboard With Monthly Test Execution KPI Icons PDF
This slide covers RPA metrics for analyzing test execution on automated platforms. It also includes test execution metrics such as total test executed, test status, tests executed daily for different operation systems, etc. Pitch your topic with ease and precision using this Robotic Process Automation Dashboard With Monthly Test Execution KPI Icons PDF. This layout presents information on Robotic Process Automation Dashboard, Monthly Test Execution Kpi. It is also available for immediate download and adjustment. So, changes can be made in the color, design, graphics or any other component to create a unique layout.
Robotic Process Automation Metrics Dashboard For Tracking Business Return On Investment Information PDF
This slide illustrates KPI Dashboard for measuring time and money saved after RPA deployment. It also include metrics for analysis such as productivity in robot hours, hours saved per process, money saved per process, etc. Pitch your topic with ease and precision using this Robotic Process Automation Metrics Dashboard For Tracking Business Return On Investment Information PDF. This layout presents information on Management, Goal, Productivity. It is also available for immediate download and adjustment. So, changes can be made in the color, design, graphics or any other component to create a unique layout.

KPI Dashboard To Evaluate Growth In Sales Funnel Reporting Topics PDF
This slide represents the KPI dashboard to measure sales pipeline reporting for increasing customer conversion rate. It includes activity by representative, forecast by month and monthly growth. Pitch your topic with ease and precision using this KPI Dashboard To Evaluate Growth In Sales Funnel Reporting Topics PDF. This layout presents information on Pipeline Requirement, Key Activities, Pipeline Closed Date. It is also available for immediate download and adjustment. So, changes can be made in the color, design, graphics or any other component to create a unique layout.
 Home
Home