Private Equity Dashboard

South Africa Country Profile Statistics Dashboard Ppt Infographics Diagrams PDF
Persuade your audience using this South Africa Country Profile Statistics Dashboard Ppt Infographics Diagrams PDF. This PPT design covers one stages, thus making it a great tool to use. It also caters to a variety of topics including Human Development Index, GDP Per Capita, GHG Emissions. Download this PPT design now to present a convincing pitch that not only emphasizes the topic but also showcases your presentation skills.

United Nations Country Profile Statistics Dashboard Ppt Outline Microsoft PDF
Persuade your audience using this United Nations Country Profile Statistics Dashboard Ppt Outline Microsoft PDF. This PPT design covers one stages, thus making it a great tool to use. It also caters to a variety of topics including Human Development Index, GDP Per Capita, GHG Emissions. Download this PPT design now to present a convincing pitch that not only emphasizes the topic but also showcases your presentation skills.

Change Requests Management And Management Dashboard Clipart PDF
This slide illustrates facts and figures related to managing change requests. It includes request statistics, latest change requests, status by assignee, status by priority, etc. Pitch your topic with ease and precision using this Change Requests Management And Management Dashboard Clipart PDF. This layout presents information on Status By Assignee, Status By Priority, Request Statistics. It is also available for immediate download and adjustment. So, changes can be made in the color, design, graphics or any other component to create a unique layout.

User Feedback Governance And Analytics Dashboard Ppt Professional Rules PDF
This slide covers summary report on feedbacks provided by users.It includes analytics based on monthly feedbacks, positive and negative feedbacks, etc. for effective user experience. Pitch your topic with ease and precision using this User Feedback Governance And Analytics Dashboard Ppt Professional Rules PDF. This layout presents information on Current Feedbacks, Monthly Feedbacks, Analytics. It is also available for immediate download and adjustment. So, changes can be made in the color, design, graphics or any other component to create a unique layout.

Brand Awareness And Popularity Assessment Dashboard Topics PDF
This slide illustrates graphical representation of facts and figures related with brand awareness. It includes popularity ratings, brand awareness graph, people ratings of brand slogans etc. Pitch your topic with ease and precision using thisBrand Awareness And Popularity Assessment Dashboard Topics PDF. This layout presents information on Customers By Age, Brand Ambassador Analysis, Brand Awareness. It is also available for immediate download and adjustment. So, changes can be made in the color, design, graphics or any other component to create a unique layout.

Client Analytics Relationship Management Dashboard With Conversion Funnel Demonstration PDF
The following slide depicts the key performing areas in lead management. It includes traffic, potential customers, category wise closing percentages, financial insights etc. Pitch your topic with ease and precision using this Client Analytics Relationship Management Dashboard With Conversion Funnel Demonstration PDF. This layout presents information on Potential Customers, Social Media Followers, Social Media Subscribers. It is also available for immediate download and adjustment. So, changes can be made in the color, design, graphics or any other component to create a unique layout.
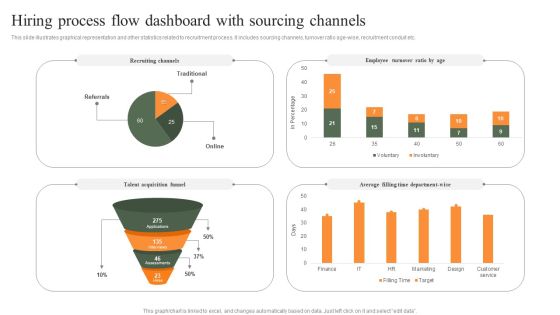
Hiring Process Flow Dashboard With Sourcing Channels Professional PDF
This slide illustrates graphical representation and other statistics related to recruitment process. It includes sourcing channels, turnover ratio age-wise, recruitment conduit etc. Pitch your topic with ease and precision using this Hiring Process Flow Dashboard With Sourcing Channels Professional PDF. This layout presents information on Employee Turnover Ratio, Recruiting Channels, Average. It is also available for immediate download and adjustment. So, changes can be made in the color, design, graphics or any other component to create a unique layout.

Accounting KPI Dashboard To Control System Financial Performance Formats PDF
The following slide showcases model for enabling control of accounts. It presents information related to long term planning, investment plans, profit estimated, etc. Pitch your topic with ease and precision using this Accounting KPI Dashboard To Control System Financial Performance Formats PDF. This layout presents information on Sales Outstanding, Payable Outstanding, Sales Inventory. It is also available for immediate download and adjustment. So, changes can be made in the color, design, graphics or any other component to create a unique layout.

Corporate Bonus Payouts And Performance Incentives Dashboard Mockup PDF
This slide illustrates facts and figures related to performance bonus in a corporation. It includes total monthly payouts, eligible employee payout, target achievement analysis etc. Pitch your topic with ease and precision using this Corporate Bonus Payouts And Performance Incentives Dashboard Mockup PDF. This layout presents information on Monthly Payouts, Employee Payout, Average Employee. It is also available for immediate download and adjustment. So, changes can be made in the color, design, graphics or any other component to create a unique layout.

Performance Metrics Dashboard To Track Overall Rebranding Effectiveness Professional PDF
This slide provides information regarding essential characteristics of co-branding in terms of strategic partnership, build credibility, developing marketing strategy, develop innovation and value addition, etc. Make sure to capture your audiences attention in your business displays with our gratis customizable Performance Metrics Dashboard To Track Overall Rebranding Effectiveness Professional PDF. These are great for business strategies, office conferences, capital raising or task suggestions. If you desire to acquire more customers for your tech business and ensure they stay satisfied, create your own sales presentation with these plain slides.
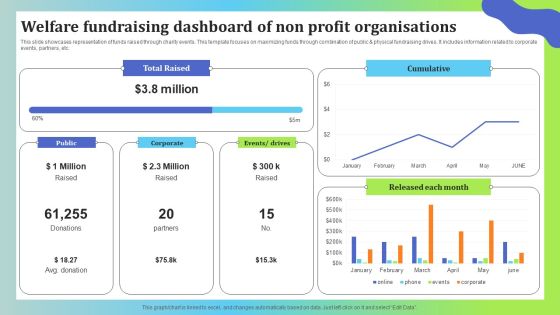
Welfare Fundraising Dashboard Of Non Profit Organisations Graphics PDF
This slide showcases representation of funds raised through charity events. This template focuses on maximizing funds through combination of public and physical fundraising drives. It includes information related to corporate events, partners, etc. Showcasing this set of slides titled Welfare Fundraising Dashboard Of Non Profit Organisations Graphics PDF. The topics addressed in these templates are Total Raised, Cumulative, Each Month. All the content presented in this PPT design is completely editable. Download it and make adjustments in color, background, font etc. as per your unique business setting.

Business Executive Summary KPI Dashboard For Year 2023 Graphics PDF
The following slide highlights the overall business performance for the financial year 2021 to assess variations and trace accuracy. It includes KPIs such as total income, expenditures, revenue and expense breakdown, fund structure etc. Pitch your topic with ease and precision using this Business Executive Summary KPI Dashboard For Year 2023 Graphics PDF. This layout presents information on Revenue Breakdown, Revenue Category, Expense Breakdown. It is also available for immediate download and adjustment. So, changes can be made in the color, design, graphics or any other component to create a unique layout.

Project Data Quality Kpis Metrics Status Dashboard Designs PDF
This slide covers key metrics to check the quality status of project data. It includes metrics such as accuracy over time, validity, completeness, relevance, uniformity, consistency, accountability, quality, timeliness, integrity, flexibility, etc. Pitch your topic with ease and precision using this Project Data Quality Kpis Metrics Status Dashboard Designs PDF. This layout presents information on Accuracy Over Time, Validity Over Time. It is also available for immediate download and adjustment. So, changes can be made in the color, design, graphics or any other component to create a unique layout.

Business Survey Analysis Dashboard Based On Demographics Data Microsoft PDF
The purpose of this template is to explain the analysis of business survey conduct based on demographics. The slide provides information about support team, respondents and product preference. Pitch your topic with ease and precision using this Business Survey Analysis Dashboard Based On Demographics Data Microsoft PDF. This layout presents information on Support, Team Performance, Product Preference It is also available for immediate download and adjustment. So, changes can be made in the color, design, graphics or any other component to create a unique layout.

Annual Financial Data With KPI Insights Dashboard Structure PDF
The following slides highlights the financial kpas in summarized form to evaluate companys annual operating performance. It includes metrics such as gross, operating and net profit margin, income statement, target versus actual EBIT etc. Pitch your topic with ease and precision using this Annual Financial Data With KPI Insights Dashboard Structure PDF. This layout presents information on Gross Profit Margin, Operating Profit Margin, Net Profit Margin. It is also available for immediate download and adjustment. So, changes can be made in the color, design, graphics or any other component to create a unique layout.

Summary Financial Sales And Profit Margin Analysis Dashboard Pictures PDF
This graph or chart is linked to excel, and changes automatically based on data. Just left click on it and select Edit Data. Deliver an awe inspiring pitch with this creative Summary Financial Sales And Profit Margin Analysis Dashboard Pictures PDF bundle. Topics like Net Profit, Past Year Vs Target Vs Actual, Net Profit Margin By Region, Channel, Expenses Breakdown, Costs And Expenses, Profitability Indicator Ratios can be discussed with this completely editable template. It is available for immediate download depending on the needs and requirements of the user.
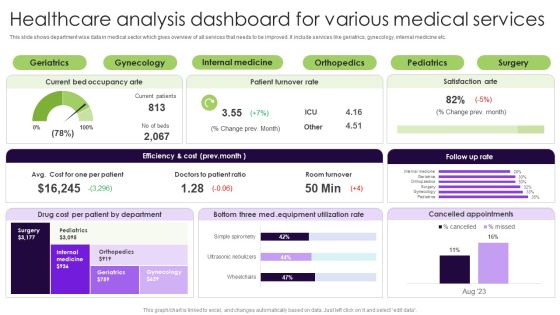
Healthcare Analysis Dashboard For Various Medical Services Ideas PDF
This slide shows department wise data in medical sector which gives overview of all services that needs to be improved. It include services like geriatrics, gynecology, internal medicine etc. Pitch your topic with ease and precision using this Healthcare Analysis Dashboard For Various Medical Services Ideas PDF. This layout presents information on Equipment Utilization Rate, Drug Cost Per Patient, Internal Medicine. It is also available for immediate download and adjustment. So, changes can be made in the color, design, graphics or any other component to create a unique layout.

Online Marketing KPI Dashboard With Cost Trend Slides PDF
The following slide highlights the key metrics of digital marketing to reach the target audience in the most cost effective way. It includes average daily impressions, click through rate, cost per click, lead generation, conversion and scoring etc. Pitch your topic with ease and precision using this Online Marketing KPI Dashboard With Cost Trend Slides PDF. This layout presents information on Average Daily Impressions, Click Through Rate, Cost Per Click, Lead Generation, Conversion And Scoring. It is also available for immediate download and adjustment. So, changes can be made in the color, design, graphics or any other component to create a unique layout.
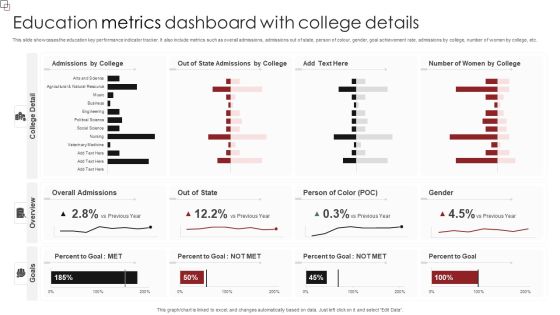
Education Metrics Dashboard With College Details Formats PDF
This slide showcases the education key performance indicator tracker. It also include metrics such as overall admissions, admissions out of state, person of colour, gender, goal achievement rate, admissions by college, number of women by college, etc. Pitch your topic with ease and precision using this Education Metrics Dashboard With College Details Formats PDF. This layout presents information on Overall Admissions, Person Of Color, Percent To Goal. It is also available for immediate download and adjustment. So, changes can be made in the color, design, graphics or any other component to create a unique layout.

Data Structure IT Data Structure Performance Tracking Dashboard Diagrams PDF
Slidegeeks is here to make your presentations a breeze with Data Structure IT Data Structure Performance Tracking Dashboard Diagrams PDF With our easy-to-use and customizable templates, you can focus on delivering your ideas rather than worrying about formatting. With a variety of designs to choose from, youre sure to find one that suits your needs. And with animations and unique photos, illustrations, and fonts, you can make your presentation pop. So whether youre giving a sales pitch or presenting to the board, make sure to check out Slidegeeks first.

Dashboard For Cloud Data Firm Revival Action Plan Summary PDF
Following slide highlights the strategies to optimize recovery performance is to provide a revival techniques to improve performance and overcome the problem of industrial sickness. The major strategies covered herein are cost control strategy, retrenchment strategy and leader replacement strategy. Pitch your topic with ease and precision using this Dashboard For Cloud Data Firm Revival Action Plan Summary PDF. This layout presents information on Device, Success, Process. It is also available for immediate download and adjustment. So, changes can be made in the color, design, graphics or any other component to create a unique layout.

International Sales Performance Dashboard With Regional Market Report Inspiration PDF
This slide showcases global report that can help organization to estimate forecast of the sales and identify yearly revenue generated. Its key elements are yearly sales, market share, regional outlook, competitor analysis and geographical sales. Pitch your topic with ease and precision using this International Sales Performance Dashboard With Regional Market Report Inspiration PDF. This layout presents information on Regional Outlook, Sales And Forecast, Market Share Overview. It is also available for immediate download and adjustment. So, changes can be made in the color, design, graphics or any other component to create a unique layout.

Account Based Marketing Customer Engagement Dashboard Infographics PDF
Purpose of the following slide is to show key metrics that can help the organization to track their account based marketing efforts, it highlights essential KPIs such as CTR, session by account. Boost your pitch with our creative Account Based Marketing Customer Engagement Dashboard Infographics PDF. Deliver an awe inspiring pitch that will mesmerize everyone. Using these presentation templates you will surely catch everyones attention. You can browse the ppts collection on our website. We have researchers who are experts at creating the right content for the templates. So you do not have to invest time in any additional work. Just grab the template now and use them.

Customer Relationship Management Dashboard Customer Retention Benefits Inspiration PDF
This graph or chart is linked to excel, and changes automatically based on data. Just left click on it and select Edit Data.Deliver an awe inspiring pitch with this creative customer relationship management dashboard customer retention benefits inspiration pdf bundle. Topics like increasing customer retention rates, on average, loyal customers are worth up to 10 times as ,much as their first purchase, profits by 25percent to 95percent can be discussed with this completely editable template. It is available for immediate download depending on the needs and requirements of the user.

Managing Customer Experience CRM Application Dashboard Month Mockup PDF
This graph or chart is linked to excel, and changes automatically based on data. Just left click on it and select Edit Data.Deliver an awe-inspiring pitch with this creative managing customer experience crm application dashboard month mockup pdf bundle. Topics like show me the deals by each stage, what is the revenue this month, get me the number of leads created this month by source can be discussed with this completely editable template. It is available for immediate download depending on the needs and requirements of the user.

Construction Management Dashboard With Project Phases And Performance Inspiration PDF
This graph for chart is linked to excel, and changes automatically based on data. Just left click on it and select Edit Data. Deliver and pitch your topic in the best possible manner with this Construction Management Dashboard With Project Phases And Performance Inspiration PDF. Use them to share invaluable insights on Project Cost Performance, Actual Cost, Project Performance, Timeline VS Resource Capacity, Time vs Project Phase and impress your audience. This template can be altered and modified as per your expectations. So, grab it now.

Finance Metrics Dashboard Illustrating Income And Cash Flow Template PDF
This graph or chart is linked to excel, and changes automatically based on data. Just left click on it and select edit data. Pitch your topic with ease and precision using this Finance Metrics Dashboard Illustrating Income And Cash Flow Template PDF. This layout presents information on Current Accounts Receivable, Current Account Payable, Cash End Period, Account Receivable Account. It is also available for immediate download and adjustment. So, changes can be made in the color, design, graphics or any other component to create a unique layout.

Client Helpline Dashboard With Retention Rate Ppt Gallery Ideas PDF
This graph or chart is linked to excel, and changes automatically based on data. Just left click on it and select Edit Data. Pitch your topic with ease and precision using this Client Helpline Dashboard With Retention Rate Ppt Gallery Ideas PDF. This layout presents information on Cost per Support 2022, Total Requests, Total Revenue 2022, Avg Requests Answered. It is also available for immediate download and adjustment. So, changes can be made in the color, design, graphics or any other component to create a unique layout.

Power Plant Energy Production Dashboard For Consumption Statistics Download PDF
This graph or chart is linked to excel, and changes automatically based on data. Just left click on it and select edit data. Pitch your topic with ease and precision using this Multiple Country Energy Consumption Statistics Comparison Dashboard Formats PDF. This layout presents information on August Year 2022, Return on Investments, Power Plan Detail . It is also available for immediate download and adjustment. So, changes can be made in the color, design, graphics or any other component to create a unique layout.
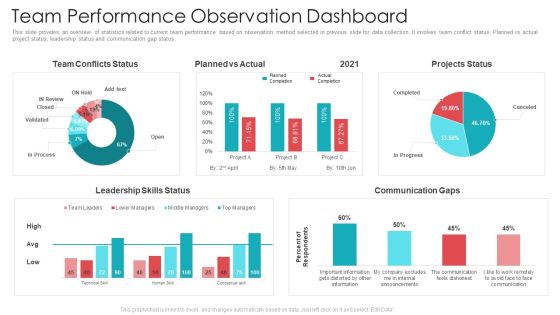
Official Team Collaboration Plan Team Performance Observation Dashboard Background PDF
This slide provides an overview of statistics related to current team performance based on observation method selected in previous slide for data collection. It involves team conflict status, Planned vs actual project status, leadership status and communication gap status. Deliver an awe-inspiring pitch with this creative official team collaboration plan team performance observation dashboard background pdf bundle. Topics like leadership skills status, team conflicts status, communication gaps can be discussed with this completely editable template. It is available for immediate download depending on the needs and requirements of the user.

Auto Insurance Policies Claims Management Dashboard Infographics PDF
This slide illustrates graphical representation of data that helps the insurer company manages the car insurance policy claims. It includes no. of claims, percentage of claims, claims by usage, claims by type of vehicle etc. Pitch your topic with ease and precision using this Auto Insurance Policies Claims Management Dashboard Infographics PDF. This layout presents information on Percentage Claims, Claims Usage, Claims Type Vehicle. It is also available for immediate download and adjustment. So, changes can be made in the color, design, graphics or any other component to create a unique layout.

KPI Dashboard To Monitor Performance Of Dcaas Pictures PDF
Following slide highlights major benefits of applying data center as a service to business operations which can be used by businesses looking to modernize their IT infrastructure. Major benefits are in terms of scalability, flexibility, cost effectiveness, and security. Pitch your topic with ease and precision using this KPI Dashboard To Monitor Performance Of Dcaas Pictures PDF. This layout presents information on Customer Type, Counts By Model Attributes, Items By Status. It is also available for immediate download and adjustment. So, changes can be made in the color, design, graphics or any other component to create a unique layout.
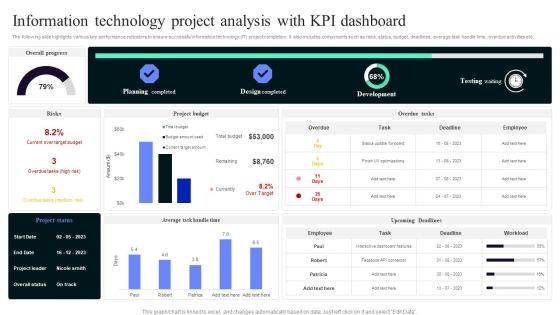
Information Technology Project Analysis With Kpi Dashboard Portrait PDF
The following slide highlights various key performance indicators to ensure successful information technology IT project completion. It also includes components such as risks, status, budget, deadlines, average task handle time, overdue activities etc. Pitch your topic with ease and precision using this Information Technology Project Analysis With Kpi Dashboard Portrait PDF. This layout presents information on Planning Completed, Design Completed, Development . It is also available for immediate download and adjustment. So, changes can be made in the color, design, graphics or any other component to create a unique layout.

Online Enterprise Customer Activity Overview Dashboard Download PDF
The following slide highlights the key performance indicators of online customer activity to create better user experience. It includes KPAs such as website traffic, device breakdown summary, average time spent etc. Pitch your topic with ease and precision using this Online Enterprise Customer Activity Overview Dashboard Download PDF. This layout presents information on Device, Analysis, Summary. It is also available for immediate download and adjustment. So, changes can be made in the color, design, graphics or any other component to create a unique layout.
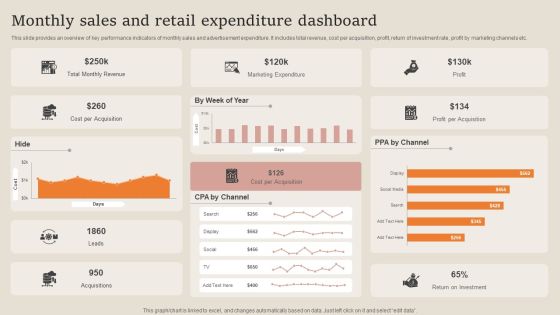
Monthly Sales And Retail Expenditure Dashboard Summary PDF
This slide provides an overview of key performance indicators of monthly sales and advertisement expenditure. It includes total revenue, cost per acquisition, profit, return of investment rate, profit by marketing channels etc. Pitch your topic with ease and precision using this Monthly Sales And Retail Expenditure Dashboard Summary PDF. This layout presents information on Marketing Expenditure, Revenue, Cost Per Acquisition. It is also available for immediate download and adjustment. So, changes can be made in the color, design, graphics or any other component to create a unique layout.
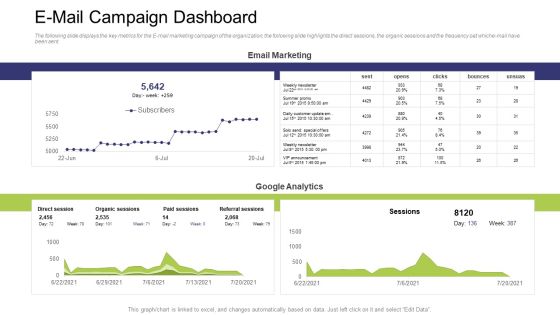
E Mail Campaign Dashboard Ppt Infographic Template Clipart Images PDF
The following slide displays the key metrics for the E-mail marketing campaign of the organization, the following slide highlights the direct sessions, the organic sessions and the frequency oat whiche-mail have been sent Deliver and pitch your topic in the best possible manner with this e mail campaign dashboard ppt infographic template clipart images pdf. Use them to share invaluable insights on direct session, paid sessions, organic sessions, referral sessions and impress your audience. This template can be altered and modified as per your expectations. So, grab it now.
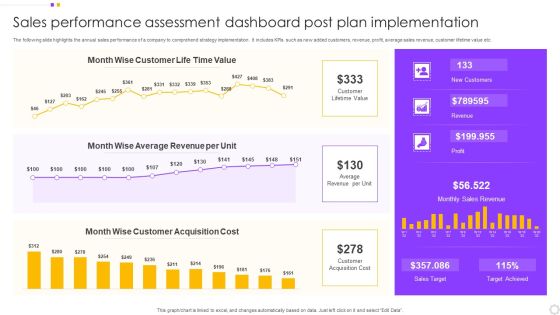
Sales Performance Assessment Dashboard Post Plan Implementation Introduction PDF
The following slide highlights the annual sales performance of a company to comprehend strategy implementation. It includes KPIs such as new added customers, revenue, profit, average sales revenue, customer lifetime value etc. Pitch your topic with ease and precision using this Sales Performance Assessment Dashboard Post Plan Implementation Introduction PDF. This layout presents information on Customer, Value, Average Revenue. It is also available for immediate download and adjustment. So, changes can be made in the color, design, graphics or any other component to create a unique layout.
Remarketing Techniques Dashboard For Tracking Facebook Retargeting Campaign Sample PDF
This slide covers metrics for analysing the results of Facebook retargeting campaign. It includes KPIs such as ad spend, cost per click, click-through rate, ad reach, post engagement, ad clicks, ad impressions, link clicks, etc. Deliver an awe inspiring pitch with this creative Remarketing Techniques Dashboard For Tracking Facebook Retargeting Campaign Sample PDF bundle. Topics like Ad Spend, Cost Per Thousand, Cost Per Click, Clicks Through Rate can be discussed with this completely editable template. It is available for immediate download depending on the needs and requirements of the user.

Remarketing Techniques Dashboard For Tracking Instagram Retargeting Campaign Slides PDF
This slide covers metrics for analysing the results of the Instagram retargeting campaign. It includes KPIs such as amount spend, total reach, total impressions, website clicks, page likes, ad clicks, post reactions, etc. Deliver and pitch your topic in the best possible manner with this Remarketing Techniques Dashboard For Tracking Instagram Retargeting Campaign Slides PDF. Use them to share invaluable insights on Latest Campaigns, Ad Placement, Total Amount Spent and impress your audience. This template can be altered and modified as per your expectations. So, grab it now.

Virtual Assets Investment Guide Cryptocurrency Portfolio Investment Dashboard Guidelines PDF
Identifying the metrics which help in analyzing the product performance play a crucial role when it comes to tracking performance. The following slide highlights such manor KPIs, these are total sell, total buy, etc. Deliver an awe inspiring pitch with this creative Virtual Assets Investment Guide Cryptocurrency Portfolio Investment Dashboard Guidelines PDF bundle. Topics like Bitcoin BTC, Total Sell, Total Buy can be discussed with this completely editable template. It is available for immediate download depending on the needs and requirements of the user.

Company Payout Dashboard For Subscription Based Startup Designs PDF
The slide carries different metrics to evaluate and record payments of subscription-based business start-up. Various KPIs included are net revenue, MRR, customers, current day revenue, failed and successful payments, live feed- subscription and payments. Pitch your topic with ease and precision using this Company Payout Dashboard For Subscription Based Startup Designs PDF. This layout presents information on Net Revenue, MRR, Customers, Current Day Revenue. It is also available for immediate download and adjustment. So, changes can be made in the color, design, graphics or any other component to create a unique layout.
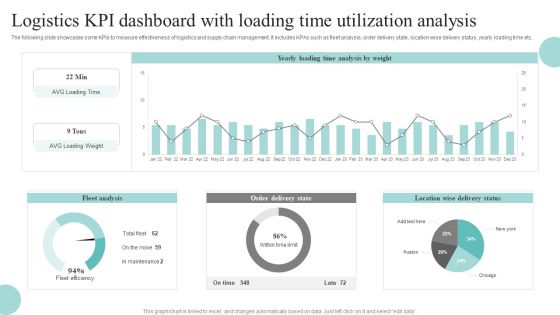
Logistics KPI Dashboard With Loading Time Utilization Analysis Download PDF
The following slide showcases some KPIs to measure effectiveness of logistics and supply chain management. It includes KPAs such as fleet analysis, order delivery state, location wise delivery status, yearly loading time etc. Pitch your topic with ease and precision using this Logistics KPI Dashboard With Loading Time Utilization Analysis Download PDF. This layout presents information on Fleet Analysis, Order Delivery State, Location Wise Delivery Status. It is also available for immediate download and adjustment. So, changes can be made in the color, design, graphics or any other component to create a unique layout.

Enhance Profit Client Journey Analysis Email Engagement Dashboard Slides PDF
Email engagement metrics help you understand which email campaigns saw the highest open rate and click-through rate. It also gives you an idea of how different age groups interact with your emails helping you customize the content accordingly. Deliver and pitch your topic in the best possible manner with this enhance profit client journey analysis email engagement dashboard slides pdf. Use them to share invaluable insights on engagement over time by age of profile, open rate by age of profile and impress your audience. This template can be altered and modified as per your expectations. So, grab it now.
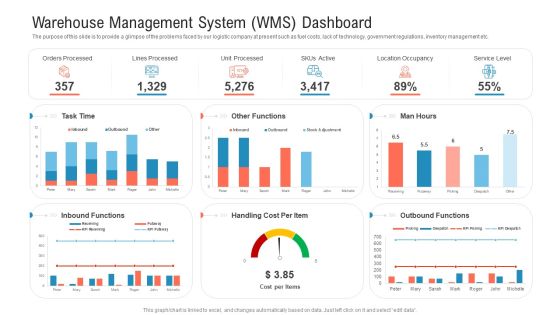
Warehouse Management System Wms Dashboard Cost Summary PDF
The purpose of this slide is to provide a glimpse of the problems faced by our logistic company at present such as fuel costs, lack of technology, government regulations, inventory management etc. Deliver and pitch your topic in the best possible manner with this warehouse management system wms dashboard cost summary pdf. Use them to share invaluable insights on orders processed, lines processed, unit processed, skus active, location occupancy and impress your audience. This template can be altered and modified as per your expectations. So, grab it now.
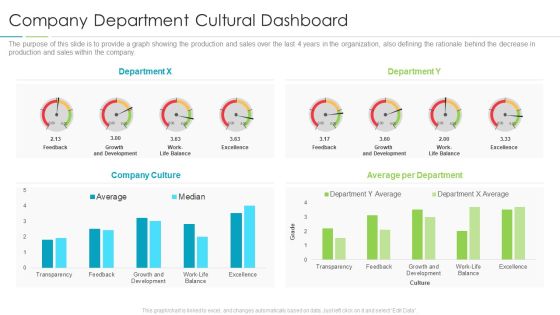
Refining Company Ethos Company Department Cultural Dashboard Rules PDF
The purpose of this slide is to provide a graph showing the production and sales over the last 4 years in the organization, also defining the rationale behind the decrease in production and sales within the company. Deliver an awe inspiring pitch with this creative refining company ethos company department cultural dashboard rules pdf bundle. Topics like growth, development, excellence, culture can be discussed with this completely editable template. It is available for immediate download depending on the needs and requirements of the user.

Building Efficient Work Environment Company Department Cultural Dashboard Guidelines PDF
The purpose of this slide is to provide a graph showing the production and sales over the last 4 years in the organization, also defining the rationale behind the decrease in production and sales within the company. Deliver an awe inspiring pitch with this creative building efficient work environment company department cultural dashboard guidelines pdf bundle. Topics like growth, development, excellence, culture can be discussed with this completely editable template. It is available for immediate download depending on the needs and requirements of the user.
Sales Techniques Playbook Sales Management Activities Tracking Dashboard Introduction PDF
This slide provides information regarding various metrics catered to track sales team performance in terms of average revenue per account, win rate, NPS, along with sales representative performance tracking through number of opportunities created, lead response time, etc. Deliver an awe inspiring pitch with this creative sales techniques playbook sales management activities tracking dashboard introduction pdf bundle. Topics like growth, sales can be discussed with this completely editable template. It is available for immediate download depending on the needs and requirements of the user.
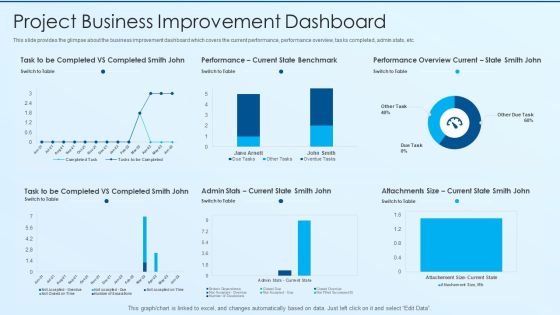
Process Advancement Scheme Project Business Improvement Dashboard Mockup PDF
This slide provides the glimpse about the factors which leads to software project failure such as lack of user participation, changing requirements, unclear objectives, lack of talent people, poor governance, etc. Deliver and pitch your topic in the best possible manner with this process advancement scheme project business improvement dashboard mockup pdf. Use them to share invaluable insights on lack user participation, changing requirement, unclear objectives and impress your audience. This template can be altered and modified as per your expectations. So, grab it now.
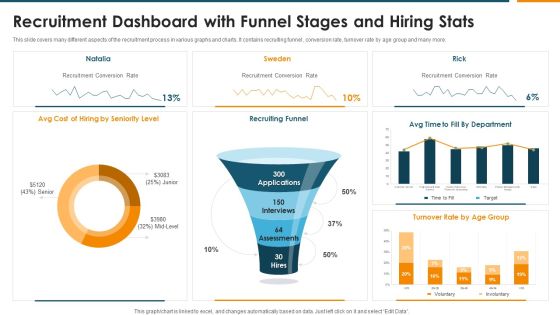
Recruitment Dashboard With Funnel Stages And Hiring Stats Rules PDF
This slide covers many different aspects of the recruitment process in various graphs and charts. It contains recruiting funnel , conversion rate, turnover rate by age group and many more. Pitch your topic with ease and precision using this Recruitment Dashboard With Funnel Stages And Hiring Stats Rules PDF. This layout presents information on Recruiting Funnel, Recruitment Conversion Rate, Seniority Level. It is also available for immediate download and adjustment. So, changes can be made in the color, design, graphics or any other component to create a unique layout.

Cyber Intelligence Risk Assessment Dashboard With Heat Map Portrait PDF
This slide exhibits risk rating breakdown and heat map for analyzing current cyber security measures effectiveness. It covers top 5 vulnerabilities and clients under scrutiny. Pitch your topic with ease and precision using this Cyber Intelligence Risk Assessment Dashboard With Heat Map Portrait PDF This layout presents information on Risk Rating Breakdown, Action Plan Breakdown, Risk Possibility It is also available for immediate download and adjustment. So, changes can be made in the color, design, graphics or any other component to create a unique layout.
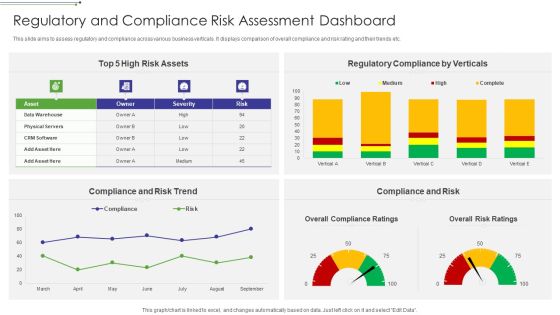
Regulatory And Compliance Risk Assessment Dashboard Designs PDF
This slide aims to assess regulatory and compliance across various business verticals. It displays comparison of overall compliance and risk rating and their trends etc.Pitch your topic with ease and precision using this Regulatory And Compliance Risk Assessment Dashboard Designs PDF This layout presents information on Risk Assets, Regulatory Compliance By Verticals, Compliance And Risk Trend It is also available for immediate download and adjustment. So, changes can be made in the color, design, graphics or any other component to create a unique layout.
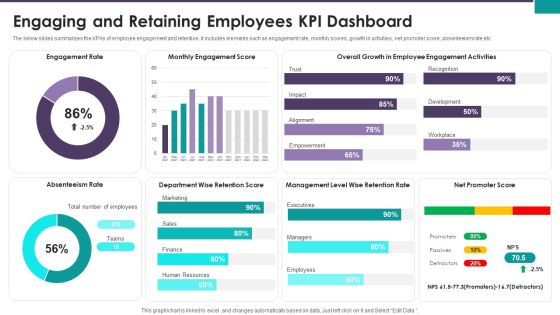
Engaging And Retaining Employees KPI Dashboard Ppt Slides Show PDF
The below slides summarizes the KPAs of employee engagement and retention. It includes elements such as engagement rate, monthly scores, growth in activities, net promoter score, absenteeism rate etc. Pitch your topic with ease and precision using this Engaging And Retaining Employees KPI Dashboard Ppt Slides Show PDF. This layout presents information on Engagement Rate Monthly, Engagement Score Overall, Growth Employee Engagement. It is also available for immediate download and adjustment. So, changes can be made in the color, design, graphics or any other component to create a unique layout.
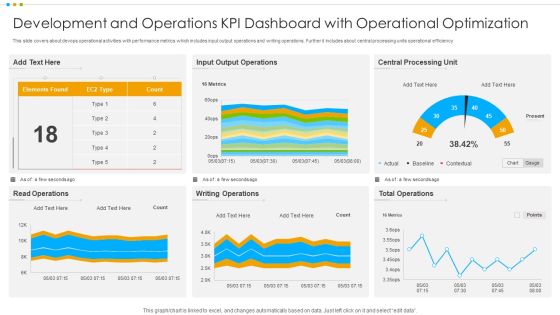
Development And Operations KPI Dashboard With Operational Optimization Pictures PDF
This slide covers about devops operational activities with performance metrics which includes input output operations and writing operations. Further it includes about central processing units operational efficiency.Pitch your topic with ease and precision using this Development And Operations KPI Dashboard With Operational Optimization Pictures PDF This layout presents information on Output Operations, Central Processing, Total Operations It is also available for immediate download and adjustment. So, changes can be made in the color, design, graphics or any other component to create a unique layout.
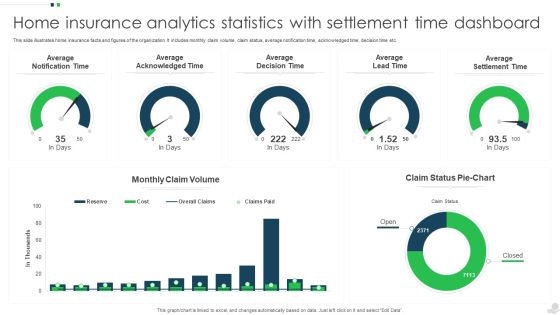
Home Insurance Analytics Statistics With Settlement Time Dashboard Ideas PDF
This slide illustrates home insurance facts and figures of the organization. It includes monthly claim volume, claim status, average notification time, acknowledged time, decision time etc. Pitch your topic with ease and precision using this Home Insurance Analytics Statistics With Settlement Time Dashboard Ideas PDF. This layout presents information on Average Acknowledged Time, Average Decision Time, Average Lead Time. It is also available for immediate download and adjustment. So, changes can be made in the color, design, graphics or any other component to create a unique layout.
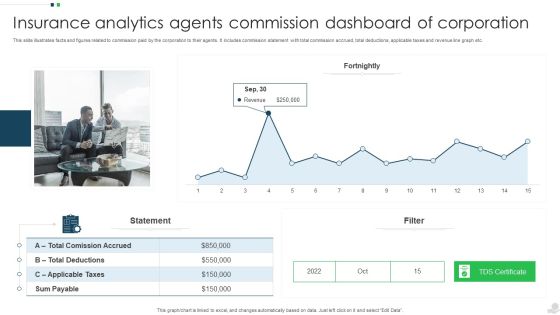
Insurance Analytics Agents Commission Dashboard Of Corporation Introduction PDF
This slide illustrates facts and figures related to commission paid by the corporation to their agents. It includes commission statement with total commission accrued, total deductions, applicable taxes and revenue line graph etc. Pitch your topic with ease and precision using this Insurance Analytics Agents Commission Dashboard Of Corporation Introduction PDF. This layout presents information on Applicable Taxes, Sum Payable, Revenue. It is also available for immediate download and adjustment. So, changes can be made in the color, design, graphics or any other component to create a unique layout.
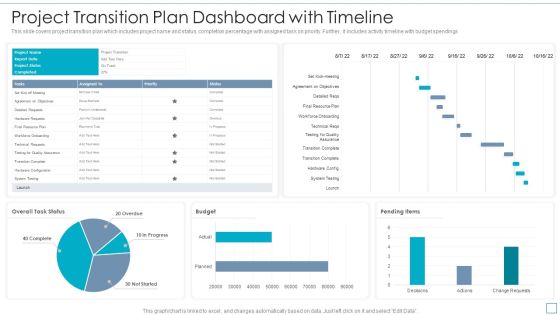
Project Transition Plan Dashboard With Timeline Topics PDF
This slide covers project transition plan which includes project name and status, completion percentage with assigned task on priority. Further, it includes activity timeline with budget spendings. Pitch your topic with ease and precision using this Project Transition Plan Dashboard With Timeline Topics PDF. This layout presents information on Budget, System Testing, Testing For Quality Assurance. It is also available for immediate download and adjustment. So, changes can be made in the color, design, graphics or any other component to create a unique layout.

Financial Forecast And Essential Metrics Dashboard Ppt File Show PDF
This slide elaborates about the multiple sources through which one can project about the growth and current status of the company. It includes lead conversion rate, monthly revenue , short term assets , net and gross profit margins, etc. Pitch your topic with ease and precision using this Financial Forecast And Essential Metrics Dashboard Ppt File Show PDF. This layout presents information on Monthly Revenue Growth, Short Term Assets, Overall Financial Performance, Net Profit Margin. It is also available for immediate download and adjustment. So, changes can be made in the color, design, graphics or any other component to create a unique layout.
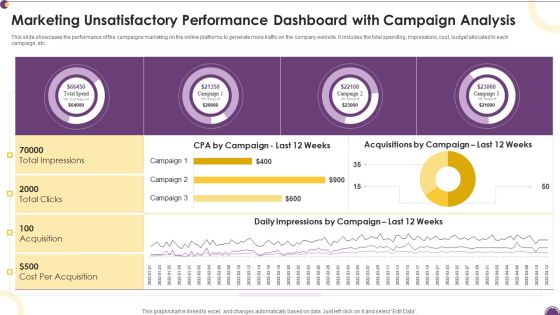
Marketing Unsatisfactory Performance Dashboard With Campaign Analysis Information PDF
This slide showcases the performance of the campaigns marketing on the online platforms to generate more traffic on the company website. It includes the total spending, impressions, cost, budget allocated to each campaign, etc.Pitch your topic with ease and precision using this Marketing Unsatisfactory Performance Dashboard With Campaign Analysis Information PDF. This layout presents information on Cost Acquisition, Total Clicks, Total Impressions. It is also available for immediate download and adjustment. So, changes can be made in the color, design, graphics or any other component to create a unique layout.

Quarterly Overall Business Performance Assessment With Kpi Dashboard Microsoft PDF
The given below slide showcases the overall business performance to evaluate the trends and KPAs. It includes quarterly insights of elements such as revenue, new customers, net profit, customer satisfaction, sales profitability, growth etc. Pitch your topic with ease and precision using this Quarterly Overall Business Performance Assessment With Kpi Dashboard Microsoft PDF. This layout presents information on Revenue, Customer Satisfaction, Net Profit. It is also available for immediate download and adjustment. So, changes can be made in the color, design, graphics or any other component to create a unique layout.
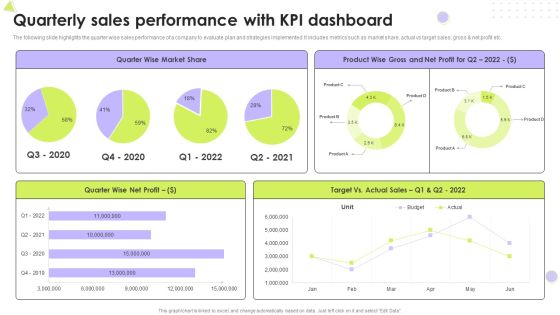
Quarterly Sales Performance With Kpi Dashboard Introduction PDF
The following slide highlights the quarter wise sales performance of a company to evaluate plan and strategies implemented. It includes metrics such as market share, actual vs target sales, gross and net profit etc. Pitch your topic with ease and precision using this Quarterly Sales Performance With Kpi Dashboard Introduction PDF. This layout presents information on Market Share, Net Profit, Target. It is also available for immediate download and adjustment. So, changes can be made in the color, design, graphics or any other component to create a unique layout.

 Home
Home